Study conducted at the Speech-Language Pathology and Audiology School Clinic of Faculdades Integradas de Fernandópolis – FIFE – Fernandópolis (SP), Brazil. (1) Speech-Language Pathology and Audiology School, Faculdades Integradas de Fernandópolis – FIFE – Fernandópolis (SP), Brazil.
(2) Department of Speech-Language Pathology and Audiology, Pontifícia Universidade Católica de São Paulo – PUC – São Paulo (SP), Brazil; Post Graduate Studies Program in Speech-Language Pathology and Audiology, Pontifícia Universidade Católica de São Paulo – PUC – São Paulo (SP), Brazil.
(3) Department of Speech-Language Pathology and Audiology Clinical Practice, Pontifícia Universidade Católica de São Paulo – PUC – São Paulo (SP), Brazil; Hearing Studies Institute – IEAA – São Paulo (SP), Brazil.
Conflict of interests: No
Author´s contributions: MMBB searched for literature references, conducted data collection, analysis and interpretation and wrote the manuscript; LPF and TMMS advised the study.
Correspondence address: Mara Mércia Belúcio Buosi. Av. Teotônio Vilela s/nº CampusUniversitário, Fernandópolis (SP), Brazil, CEP: 15600-000. E-mail: [email protected]
Received: 6/13/2011; Accepted: 2/26/2013
Auditory perception of teachers with voice disorders
Percepção auditiva de professores disfônicos
Mara Mércia Belúcio Buosi1, Léslie Piccolotto Ferreira2, Teresa Maria Momensohn-Santos3
ABSTRACT
Purpose: To describe the findings of the assessment of auditory skills – frequency, intensity and duration patterns – in a group of teachers with voice disorders (DG), and to compare the findings in a group of teachers without vocal disorders (NDG). Methods: There were 44 females, be-tween 18 and 40 years of age, 23 were placed in the voice disorder group (DG) and 21 in the group without voice disorders (NDG). In order to de-fine these groups, the teachers were submitted to both vocal behavior and laryngeal assessments, as well as to a complete audiological evaluation in order to assure that those subjects with hearing loss were excluded from the study. Following subject selection, an investigation of the Dif-ferential Intensity Threshold was carried out, along with the administra-tion of the tests for Frequency and Duraadministra-tion Pattern Detecadministra-tion. Results: The NDG had better performance than the DG in all administered tests, with a significant difference in the evaluation of the frequency parameter. Conclusion: Analysis of the performance of the two groups of teachers showed statistically significant only for the frequency parameter. Stud-ies with larger numbers of subjects and with other tests that evaluate the differential threshold of intensity may perhaps clarify better the relation-ship between voice problems and difficulties in the realization of small differences in intensity.
Keywords: Dysphonia; Faculty; Auditory perception; Voice; Hearing
RESUMO
Objetivo: Descrever os achados da avaliação de habilidades auditivas – traços de frequência, intensidade e duração – em um grupo de profes-sores disfônicos (GD), comparando-os aos encontrados em profesprofes-sores não-disfônicos (GND). Métodos: Foram avaliados 44 sujeitos do gênero feminino, na faixa etária de 18 a 40 anos, sendo 23 disfônicos (GD) e 21 não-disfônico (GND). Para definir esses grupos, as professoras foram submetidas à avaliação laringológica e perceptivo-auditiva da voz, bem como, à avaliação audiológica completa, a fim de que fossem excluídas aquelas que apresentassem perda auditiva. Após a seleção, procedeu-se a investigação do Limiar Diferencial de Intensidade e da aplicação dos Testes de Detecção de Padrão de Frequência e Duração. Resultados: O GND apresentou melhor desempenho que o GD na avaliação do parâmetro de frequência. Conclusão: A análise relacionada à percepção auditiva mostra diferença apenas para o parâmetro da frequência entre professores disfônicos e não disfônicos. Estudos com maior número de sujeitos e com outros testes que avaliem o limiar diferencial de in-tensidade podem esclarecer melhor a relação entre problemas de voz e dificuldades na percepção de pequenas diferenças de intensidade.
INTRODUCTION
Two studies conducted with teachers assert the high occur-rence of voice disorders among these professional. One study with teachers and non-teachers in the United States showed a higher occurrence of voice disorders in teachers (57.7% of the interviewed subjects reported having some kind of voice disorder throughout their careers) when compared to non-teaching professionals (28.8%)(1). In a Brazilian study that was
based on the same method as the study above, voice disorder was reported by 66.7% of the teachers, while only 14.8% of the non-teachers indicated the presence of symptoms at the time(2). Studies show that the lack of knowledge about one’s
voice and difficulties in self-perception may explain the high incidence of this disorder in teachers, as these are subjective measurements(3,4).
Voice and hearing are aspects that are related to each other. Hearing is a complex, elaborate activity that involves the process from the detection of sound stimuli by the peripheral organs, to its interpretation by the central nervous system. Thus, hearing is an important sense to monitor an adequate vocal pat-tern. In order to have a good voice, it is important to, at least, know how to listen to it(4), especially for voice professionals,
as is the case with teachers.
Teachers’ voice complaints seemed to be related to a se-ries of factors. Factors commonly reported are soreness and pain when speaking, cough, laryngeal infections, hoarseness and complete voice loss(5-9). These factors are usually related
to noisy environments(10) that lead to teacher to adopt, even
without noticing, a voice with higher intensity and higher frequency(11-13). Exposure to noise demands from the teacher
an abusive vocal usage(14) and this is one of the most frequent
complaints among them(15,16).
Therefore, when someone uses their voice professionally, it is important that they be submitted to an auditory threshold and word recognition assessment, since their voice monitoring will be performed basically by the auditory path that needs to be preserved. It is evident that the motor adjustment so that a certain voice quality may be produced depends on the moni-toring given by auditory clues(17), and is therefore influenced
by auditory skills.
Literature findings suggest that the assessment of the audi-tory skills of dysphonic individuals should be performed using “gross sounds”(18), or, sounds that do not have well defined
acoustic characteristics. Faced with this issue, it was opted to seek formal procedures in Audiology that made the analysis of auditory skills to discriminate frequency, intensity and dura-tion possible. Thus, it would be possible to verify how these individuals would be able to discriminate the three acoustic parameters of voice using pure tones.
In the auditory processing evaluation battery there are two tests that assess the individual’s skills to identify pure tone samples in two different conditions. One of these tests evaluates
the ability in detecting sound sequences of a same frequency, in two different durations. This test was called Duration Pattern SequenceTest(19).
The other test, called Pitch Pattern Sequence Test(19), follows
the same construction model, but in this test the stimuli have different frequencies. Thus, the tone samples have the acoustic characteristics of 1430 Hz (High – H) and 880 Hz (Low – L), with a 200 ms duration.
The Small Increment Sensitivity Index test (SISI)(20) aims to
measure the ear’s ability to detect small intensity changes. In a research conducted with a control group (CG) and a group of dysphonic individuals (DG) with functional voice disorders(21),
the author assessed temporal processes by using three subtests: Auditory Discrimination (AD), Tone-Change Recognition (TCR) and Frequency Pattern Recognition (FPR). The results show that the subjects with functional dysphonia had more difficulty in answering these auditory temporal processing tests. Based on these findings, the author recommended that the temporal processes of hearing be assessed in individuals with or without functional dysphonia, with or without dam-age in sound detection, so as to investigate the processing of non-verbal sounds for vocal self-monitoring.
Thus, auditory skills and voice production may not be looked at separately, since both interact and belong to the same subject. Hearing analyzes the acoustic parameters produced by voice, fact that shows the importance of studying hearing from a perceptual point of view. In order to better understand and thus be able to plan a more adequate intervention model for each case, the way how each patient “hears him/herself” should be studied, as well as issues regarding what are consequences to vocal monitoring of “not hearing oneself”. In other words, if the patient has difficulties in identifying and discriminating on of the acoustic parameters of voice (frequency, intensity or dura-tion), a lack of evolution in the therapy process may be justified. The integrity of auditory perception is primordial for speech, Language comprehension and learning. The identification of the nature of auditory damage contributes to designing the intervention. Voice, when produced in adequate intensity and projection provides a good vocal performance for the teacher(3).
In order to respond to the question of interaction in between perceptive auditory skills and voice production, the aim of this study is to describe the findings of an auditory skills assess-ment – pitch, intensity and duration – in a group of dysphonic teachers (DG), comparing them to those of non-dysphonic teachers (NDG).
METHODS
At first, lectures were held for the teachers, in order to select those who were interested in participating in the study. These lectures were attended by 82 teachers. The interested subjects signed a free informed consent term and were informed about the justification and purpose of the study, the pre-established criteria for their selection, as well as the procedures to which they would be submitted.
The inclusion criteria were: being in between 18 and 40 years of age (vocal efficiency period); being Brazilian and having Portuguese as a first language; not having been in Speech-Language Pathology therapy, not reporting endocrine, neurological or auditory disorders. These conditions were self-reported by the subjects, who completed a questionnaire. In this manner, 50 interested teachers were selected.
Afterwards, the subject were submitted to:
- Laryngeal evaluation: conducted using a nasendoscope and a tele laryngoscope (nasendoscope Machida® 3.2 mm, tele laryngoscope ASAP 70º, micro camera and videocassette). The exam was conducted in an otolaryngology medical practice office, by two otolaryngologists and followed by a Speech-Language Pathologist. At the end, based on the findings the presence or absence of laryngeal disorders was determined;
- Perceptive auditory voice assessment: the teachers were asked to say the sustained vowels /a, /i/, and /u/ and numbers counted in sequence. The samples were recorded (Aiwa®
recorder TP-VS 535) to be subject of analysis using the GRBASI scale(22). The voices were analyzed according
to their overall Grade (G), in between 0 and 3 (absence of disorder = 0, mild disorder=1, moderate disorder=2, extreme disorder=3), and then, according to the presence of roughness (R), breathiness (B), asthenicity (A), strain (S) and instability (I), evaluated using the same grades described above. Finally, the subjects who had a general grade of disorder greater than one were considered as having a perceptive auditory voice disorder.
- Pure tone audiometry: before the audiometry the individuals were submitted to an external ear inspection. The subjects who had obstruction of the external acoustic meatus were advised to seek medical assistance for cleaning and then to set another date for evaluation. The pure tone audiometry was conducted in an acoustic booth, using an audiometer calibrated according to ANSI-69 standard. Frequencies ranging from 250 Hz to 8000 Hz were tested with the sub-jects placed with their backs to the audiometer;
- Speech Recognition Threshold (SRT) investigation and speech recognition thresholds(20) assessment;
- Measurements of acoustic imitância: carried out through the middle ear Analyzer Interacoustics® AZ7(20);
Although the ideal situation would have been to combine, in one moment, the conduction of audiological procedures, laryn-geal and voice examinations, this was impossible to perform, due to the teachers’ schedule difficulties. After the completion
of the audiological procedures, six teachers were excluded and the remaining 44 were distributed according to the laryngeal and voice examinations into two groups:
- Non-dysphonic Group (NDG): composed of 21 teach-ers who did not have laryngeal and/or voice disordteach-ers. The mean age in this group was 28.23 (minimum 20 and maximum 36 years). In this group, six subjects were college teachers, four were high-school teachers, five were elemen-tary and middle school teachers, and six were preschool teachers.
- Dysphonic Group (DG): composed of 23 teachers who had laryngeal disorders (15 cases of medium-posterior triangular chinks, seven cases of vocal nodules and one case of vestibular phonation) and voice disorders (12 had moderate overall Grade of dysphonia and 11 were of intense overall Grade of dysphonia). The mean age in this group was 30.52 (minimum of 21 and maximum of 37 years), and five subjects were college teachers, seven were high school teachers, six taught elementary and middle school, and five were preschool teachers.
After the two groups were defined, all subjects were tested for their auditory skills. The Pitch and Duration Pattern Sequence Tests as well as a search for the Differential Intensity Threshold were conducted in this assessment.
The Duration and Pitch Pattern Sequence Tests were conducted binaurally in a silent environment, using a Sony®
CD player and a CD by Auditec in St Louis USA (1997). The Differential Intensity Threshold investigation was performed using a GSI-61 audiometer with TDH-50P phones and B-17 pads, calibrated according to the ANSI-69 standard.
The Duration Pattern Sequence Test contains 60 samples (six patterns randomly presented 10 times). The tones are 1000 Hz in frequency, with attack and recovery time of 10 ms. The Long (L) tone has a span of 500 ms and the short (S) of 250 ms(19). The
subjects were instructed to either mimic or name the three-tone sequence, obeying the order of presentation: LLS; SSL; LSL and so on. The test conduction handbook(19) states that results higher
than 87% of correct answers are expected.
The Pitch Pattern Sequence test is composed of 60 sample sequences, each composed of two tones organized in sequences of three, named Low (L) and High (H). These sequences are organized as follows: LLH; HLL; HLH; LHL; HHL; LHH. During this test, the subjects were instructed to mimic or name the sequences that were heard in the order of presentation. For this test, the handbook determines that the individual should correctly answer over 90% of the presented items.
magnitude of the increment was reduced to 1 dB, marking the beginning of counting in the SISI test. Twenty 1 dB increments were presented, and each teacher was required to indicate when each increment was heard. If several consecutive increments were heard (approximately five), the examiner delayed a few of the increments, so as to determine whether the individual was responding to intensity shift or to a learned time interval. In case of the individual not responding to several successive increments, the increment magnitude was increased for new training, in order to give the subject the opportunity to pay at-tention to the task again, before the test with 1 dB increments. Thus, false-negative and false-positive type answers could be minimized. The recommended procedure, which is common in clinical practice, begins with 5 dB increments, and, when answers are obtained, the magnitude of the increment is reduced to 4, 3, 2, and finally 1 dB, before counting for the test begins(20).
The answers to the three tests were entered into a specific spreadsheet and the statistics software SPSS version 10.0 was used for analysis. The part destined to describe the sample was conducted by calculations of summary measures: simple arithme-tic mean, standard deviation, and median of each study variable.
The statistical analysis consisted of the following steps: in order to compare left and right ears for the SISI test results, Wilcoxon’s Signed Posts’ test was used; this test was conducted for both groups, separately; in order to compare the SISI results of both groups, the Mann-Whitney test was conducted; and to compare the PPST and DPST blocks in between the groups, the t-Student test was adopted. All analyses considered a sig-nificance level of 5% (p≤0.050).
RESULTS
The NDG and the DG groups are similar in regards to mean age, level of teaching distribution and subjects taught. Therefore, the groups were homogenous.
Analysis of performance in the frequency and duration patterns recognition tests
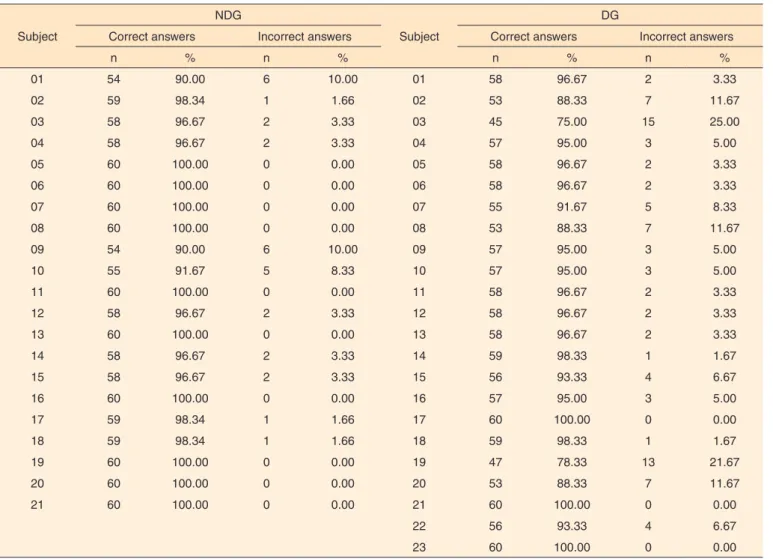
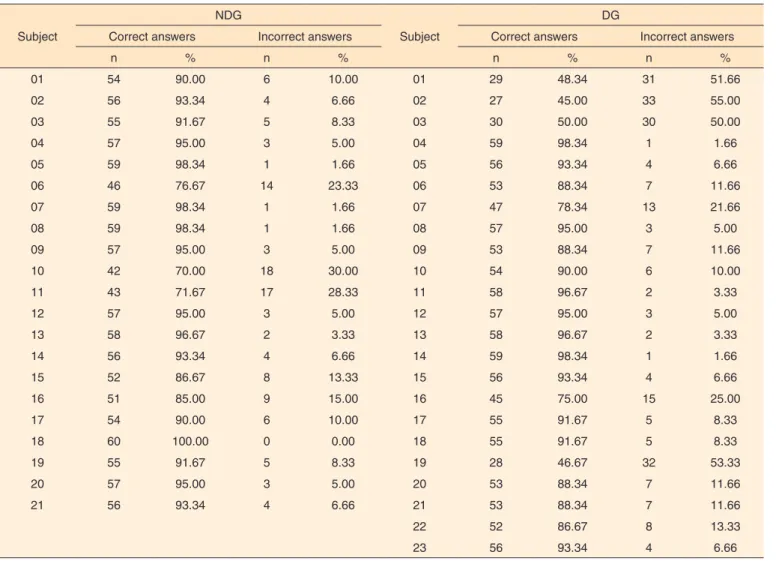
The NDG performed better than the DG in the Pitch Pattern Sequence Test (PPST) (Table 1). There were no differences, in percentages, in between the groups in the Duration Pattern Sequence Test (DPST) (Table 2).
The NDG and DG groups were also compared regard-ing their correct response indexes for both the Pitch Pattern Sequence Test (PPST) and the Duration Pattern Sequence Test (DPST) (Table 3).
Analysis of performance in the investigation of the differential intensity threshold
The following differences were observed in the comparison in between both groups, bye ear (Table 4): in the RE, for the
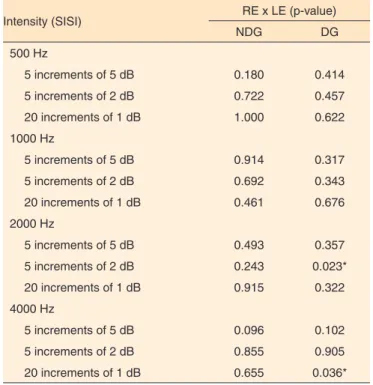
frequencies of 500 Hz (20 increments of 1 dB), 1000 Hz (5 increments of 5 dB and 20 increments of 1 dB), 2000 Hz (20 increments of 1 dB) and 4000 Hz (20 increments of 1 dB); and, in the LE, in the frequencies of 500 Hz (5 increments of 2 dB and 20 increments of 1 dB), 1000 Hz (5 increments of 5 dB and 20 increments of 1 dB), 2000 Hz (5 increments of 5 dB and 20 increments of 1 dB) and 4000 Hz (20 increments of 1 dB). In the statistical analysis, when a comparison between RE and LE is established by study group, it is observed that there was a difference of DG in the frequency of 2000 Hz (presenta-tion of 5 increments of 2 dB), and in the frequency of 4000 Hz (presentation of 20 increments of 2 dB) (Table 5).
DISCUSSION
Considering that studies like this one were difficult to find, authors who showed some resemblance to our proposal, or who have used the same procedures were used to discuss the findings.
In the evaluation of frequency parameter, performed using the Pitch Pattern Sequence Test (PPST), the values obtained by both group are in accordance to those discussed in lit-erature(19). Studies suggest that the expected values be above
76%(23). Therefore, when comparing the performance of both
groups using these values as references, the NDG had a better performance than the DG. Thus, even though most subjects in the DG had values within the expected limit, their performance was inferior to that of the participants in NDG.
In regards to the Duration Pattern Sequence Test (DPST), studies propose as expected results values above 87%(19) and
83%(23). Therefore, according to the values proposed by
litera-ture findings, the NDG performed better than the DG. Voice demand, sociodemographic factors and hazards that are directly related to work organization and environment have an impact in the occurrence of dysphonia(9). In this context, auditory
perception plays a very important role in the search for vocal feedback(24), and the auditory perception of vocal parameters
directly influences the motor adjustment to be adopted. It is known that the voice depends mainly of a complex and inter-dependent activity of all the muscles that work in its produc-tion, and thus requires sophisticated muscle processing. In this perspective, it is believed that “not hearing oneself” may have consequences for vocal production, since the adopted motor adjustment may be inadequate, and this may directly intervene in vocal rehabilitation.
may therefore not make the necessary changes in order to not use inadequate voice intensity, which may overload the speech organs, making it more susceptible to voice disorders. This situ-ation is not related to the effect that occurs when the speaker raises the intensity of his/her voice because he/she needs to compete with the sound level of the noise in the environment he/she is speaking(25).
The acoustic-articulatory feedback occurs since the child is three months old, and results from the maturing of the cen-tral auditory system and its integration with other areas of the brain. An internal model that relates the configuration of the vocal tract and the sound to be produced is aided by the audi-tory feedback that is used to monitor the conditions so that readjustments to the pre-determined postural parameters are made possible(26). Sensory auditory processing is an important
element of neural mechanisms that control human vocalization. Disturbances in the sensory feedback pattern alone may generate imprecise expectations in the vocal control system of time, quality and direction. Studies suggest that the right corti-cal auditory areas may use different mechanisms to perceive
pitch of sounds in which the fundamental frequency has been filtered, and thus indicated that the neural process of pitch is different in the right and left hemispheres, which allows the auditory/vocal system to detect temporal and spectral varia-tions through auditory feedback and therefore allow vocal pitch control(27).
This is one of the reasons for which teachers in general have voice intensities exceeding normal patterns. Teachers spend a great part of their day in noisy environments. Studies conducted in Brazil(15) show that classrooms have noise levels above the
values determined by the Brazilian Association of Technical Norms (ABNT), which makes it harder for the teacher to monitor his/her voice production. The environments do not have acoustic treatment. School windows, floors and walls do not favor the configuration of a more silent environment, since they are generally made of smooth surfaces that promote reverberation, increasing internal noise(28).
Elevated intensity is considered one of the greatest risk factors for voice disorders. According to literature reports, elevated vocal intensity generates strain during phonation
Table 1. Numeric and percent distribution of correct and incorrect answers in the assessment of frequency parameter in the non-dysphonic and dysphonic groups
Subject
NDG
Subject
DG
Correct answers Incorrect answers Correct answers Incorrect answers
n % n % n % n %
01 54 90.00 6 10.00 01 58 96.67 2 3.33
02 59 98.34 1 1.66 02 53 88.33 7 11.67
03 58 96.67 2 3.33 03 45 75.00 15 25.00
04 58 96.67 2 3.33 04 57 95.00 3 5.00
05 60 100.00 0 0.00 05 58 96.67 2 3.33
06 60 100.00 0 0.00 06 58 96.67 2 3.33
07 60 100.00 0 0.00 07 55 91.67 5 8.33
08 60 100.00 0 0.00 08 53 88.33 7 11.67
09 54 90.00 6 10.00 09 57 95.00 3 5.00
10 55 91.67 5 8.33 10 57 95.00 3 5.00
11 60 100.00 0 0.00 11 58 96.67 2 3.33
12 58 96.67 2 3.33 12 58 96.67 2 3.33
13 60 100.00 0 0.00 13 58 96.67 2 3.33
14 58 96.67 2 3.33 14 59 98.33 1 1.67
15 58 96.67 2 3.33 15 56 93.33 4 6.67
16 60 100.00 0 0.00 16 57 95.00 3 5.00
17 59 98.34 1 1.66 17 60 100.00 0 0.00
18 59 98.34 1 1.66 18 59 98.33 1 1.67
19 60 100.00 0 0.00 19 47 78.33 13 21.67
20 60 100.00 0 0.00 20 53 88.33 7 11.67
21 60 100.00 0 0.00 21 60 100.00 0 0.00
22 56 93.33 4 6.67
23 60 100.00 0 0.00
and teachers should not take the elevated intensity used in their professional practices outside the classroom, or, in other words, they should not make their professional voice use a usual speaking habit(28,29,30).
On the other hand, it is observed that even with these adverse work conditions, many teachers undergoing therapy to treat their voice disorders show great progress in a short period of time, while others show great difficulties. In the present study, it was observed that auditory perception for frequency, dura-tion and intensity patterns is different (even if the statistical
difference in between the groups has not been significant), as this perception proved to be more precise in the group without voice disorders. The human ear is very good in discriminating intensity and uses any available code to complete this task. The slightest change in intensity, expressed in dB, that produces a perceptual change is in between 0.5 and 1.0 dB. This means that when a teacher needs more than this value to detect or to identify a change in his/her vocal pattern, he/she may have an auditory difficulty that may have a negative impact in his/her vocal performance.
Table 2. Numeric and percent distribution of correct and incorrect answers in the assessment of duration parameter in the non-dysphonic and dysphonic groups
Subject
NDG
Subject
DG
Correct answers Incorrect answers Correct answers Incorrect answers
n % n % n % n %
01 54 90.00 6 10.00 01 29 48.34 31 51.66
02 56 93.34 4 6.66 02 27 45.00 33 55.00
03 55 91.67 5 8.33 03 30 50.00 30 50.00
04 57 95.00 3 5.00 04 59 98.34 1 1.66
05 59 98.34 1 1.66 05 56 93.34 4 6.66
06 46 76.67 14 23.33 06 53 88.34 7 11.66
07 59 98.34 1 1.66 07 47 78.34 13 21.66
08 59 98.34 1 1.66 08 57 95.00 3 5.00
09 57 95.00 3 5.00 09 53 88.34 7 11.66
10 42 70.00 18 30.00 10 54 90.00 6 10.00
11 43 71.67 17 28.33 11 58 96.67 2 3.33
12 57 95.00 3 5.00 12 57 95.00 3 5.00
13 58 96.67 2 3.33 13 58 96.67 2 3.33
14 56 93.34 4 6.66 14 59 98.34 1 1.66
15 52 86.67 8 13.33 15 56 93.34 4 6.66
16 51 85.00 9 15.00 16 45 75.00 15 25.00
17 54 90.00 6 10.00 17 55 91.67 5 8.33
18 60 100.00 0 0.00 18 55 91.67 5 8.33
19 55 91.67 5 8.33 19 28 46.67 32 53.33
20 57 95.00 3 5.00 20 53 88.34 7 11.66
21 56 93.34 4 6.66 21 53 88.34 7 11.66
22 52 86.67 8 13.33
23 56 93.34 4 6.66
Note: NDG = non-dysphonic group; DG = dysphonic group
Table 3. Comparison of the mean values in the Frequency Pattern recognition Test and the Duration Pattern Recognition Test, according to the findings in the non-dysphonic and dysphonic groups
Variable NDG DG p-value
CA_N CA_P CA_N CA_P
FPRT 58.57 ± 1.96 97.62% ± 3.27 56.17 ± 3.83 93.62% ± 6.39 0.014* DPRT 54.43 ± 5.08 90.72 ± 8.46 50.00 ± 10.64 83.34 ± 17.73 0.084
*Significant values (p≤0.05) – T-Student test
Note: FPRT = Frequency Pattern Recognition Test; DPRT = Duration Pattern Recognition Test; CA_N = number of correct answers; CA_P = percentage of correct
The issue about the influence of the quality of acoustic perception in the ability to have a good acoustic/articulatory feedback may be a factor to be considered in the two studied groups, and other studies, including those with other voice professional categories are needed in order to better understand this phenomenon.
CONCLUSION
The analysis related to auditory perception showed a dif-ference only for the frequency pattern in dysphonic and non-dysphonic teachers. Studies with a greater number of subjects and using other tests that assess the differential intensity thresh-old may better clarify the relationship between voice disorders and difficulties in the perception of slight intensity changes.
REFERENCES
1. Roy N, Merril RM, Thibeault S, Gray SD, Smith EM. Voice disordes in teachers and the general population; effects on work performance, attendance, and future career choices. J Speech Lang Hear Res. 2004Jun;44:542-51.
2. Behlau M, Zambon F, Guerrieri AC, Roy N. Panorama Epidemiológico sobre a voz do professor no Brasil. In: 17°. Congresso Brasileiro de Fonoaudiologia. I Congresso Ibero-Americano de Fonoaudiologia. Anais Rev Soc Bras Fonoaudiol. [Internet]. Suplemento 2009: 1511. [citado 2011 Nov 15].
Disponível em: http://www.sbfa.org.br/portal/anais2009/anais_select. php?op=PR&cid=1511&tid=1
3. Dragone MLOS. Programa de saúde vocal para educadores: ações e resultados. Rev CEFAC. 2011;13(06):1133-43.
4. Ishii C, Arashiro PM, Pereira LD. Ordenação e resolução temporal em cantores profissionais e amadores afinados e desafinados. Pro Fono. 2006;18(3):285-92.
5. Ferreira LP, Giannini SPP, Figueira S, Silva EE, Karmann DF, Thomé de Souza TM. Condições de produção vocal de professores da Prefeitura do Município de São Paulo. Distúrb Comun. 2003;14(2):275-307.
6. Servilha EAM, Pena J. Tipificação de sintomas relacionados à voz e sua produção em professores identificados com ausência de alteração vocal na avaliação fonoaudiológica. Rev CEFAC. 2010Maio-Jun;12(3)454-61.
7. Penteado RZ. Relações entre saúde e trabalho docente: percepções de professores sobre saúde vocal. Rev Soc Bras Fonoaudiol. 2007Jan-Mar;12(1):18-22.
8. Fortes FSG, Imamura, RT, Domingos HT, SennesUL. Perfil dos profissionais da voz com queixas vocais atendidos em um centro terciário de saúde. Rev Bras Otorrinolaringol. 2007Fev;73(1):27-31. 9. Silvério CAK, Gonçalves OGC, Penteado ZR, Vieira TPG, Libardi
A, Rossi D. Ações em saúde vocal: proposta de melhoria do perfil vocal de professores. Pro Fono. 2008Jul-Set;20(3):177-82. 10. Choi-Cardim K, Behlau M, Zambon F. Sintomas vocais e perfil de
professores em um programa de saúde vocal. Rev CEFAC. 2010Set-Out;12(5):811-19.
Table 4. Distribution of the values of significance found in each ear, in the relationship in between the non-dysphonic and the dysphonic groups of teachers, upon conduction of the SISI test
Intensity (SISI) NDG x DG (p-value)
LE RE
500 Hz
5 increments of 5 dB 0.186 0.177 5 increments of 2 dB 0.036* 0.185 20 increments of 1 dB <0.001* 0.007* 1000 Hz
5 increments of 5 dB 0.013* 0.002* 5 increments of 2 dB 0.088 0.415 20 increments of 1 dB 0.001* 0.039* 2000 Hz
5 increments of 5 dB 0.037* 0.168 5 increments of 2 dB 0.578 0.775 20 increments of 1 dB 0.010* 0.007* 4000 Hz
5 increments of 5 dB 0.172 0.366 5 increments of 2 dB 0.218 0.319 20 increments of 1 dB 0.001* 0.002*
*Significant values (p≤0,05) – t-Student test
Note: RE = right ear; LE = left ear; NDG = non-dysphonic group; DG = dysphonic
group
Table 5. Distribution of the values of significance found in the non-dysphonic and non-dysphonic groups, in the relationship in between both ears, upon conduction of the SISI test
Intensity (SISI) RE x LE (p-value)
NDG DG
500 Hz
5 increments of 5 dB 0.180 0.414 5 increments of 2 dB 0.722 0.457 20 increments of 1 dB 1.000 0.622 1000 Hz
5 increments of 5 dB 0.914 0.317 5 increments of 2 dB 0.692 0.343 20 increments of 1 dB 0.461 0.676 2000 Hz
5 increments of 5 dB 0.493 0.357 5 increments of 2 dB 0.243 0.023* 20 increments of 1 dB 0.915 0.322 4000 Hz
5 increments of 5 dB 0.096 0.102 5 increments of 2 dB 0.855 0.905 20 increments of 1 dB 0.655 0.036*
*Significant values (p≤0.05) – t-Student test
Note: RE = right ear; LE = left ear; NDG = non-dysphonic group; DG = dysphonic
11. Jardim R, Barreto MS, Assunção AA. Condições de Trabalho, qualidade de vida e disfonia entre docentes. Cad Saúde Pública. 2007Out;23(10): 2439-61.
12. Grillo MHMM, Penteado RZ. Impacto da voz na qualidade de vida de professore(a)s do ensino fundamental. Pro Fono. 2005Set-Dez;17(3) 311-20.
13. Simberg S, Sala E, Vehmas K, Laine A. Changes in the prevalence of vocal symptoms among teachers during a twelve-year period. J Voice. 2005Mar;19(1):95-102.
14. Gonçalves VSB, Silva LB, Coutinho AS. Ruído como agente comprometedor da inteligibilidade de fala dos professores. Prod. 2009;19(3): 466-76.
15. Medeiros AM, Barreto SM, Assunção AA. Voice disorders (dysphonia) in public school female teachers working in Belo Horizonte: prevalence and associated factors. J Voice. 2008Nov;22(6):676-87.
16. Eniz A O. Poluição sonora em escolas do Distrito Federal [dissertação]. Brasília: Universidade Católica de Brasília, Programa de Pós-Graduação Stricto Sensu em Planejamento e Gestão Ambiental; 2004.
17. Servilha EAM, Ruela IS. Riscos ocupacionais à saúde e voz de professores: especificidades das unidades de rede municipal de ensino. Ver CEFAC. 2010Fev;12(1):109-14.
18. Cavadas M, Pereira LD, Behlau M. Disfonia Infantil e Processamento Auditivo Central. In: Valle MGM. Voz: diversos enfoques em Fonoaudiologia. Rio de Janeiro: Revinter; 2002. p.99-109.
19. Auditec OS. Manual de aplicação do Pitch Pattern Sequence Test e Duration Pattern Sequence Test. Saint Louis, 1997.
20. Momensohn-Santos T, Russo ICP. A prática da audiologia clínica. 4ª. ed. São Paulo: Cortez, 2005.
21. Pereira Filho R. Avaliação dos processos auditivos temporais em adultos disfônicos funcionais [monografia especialização]. São Paulo: Universidade Federal de São Paulo; 1999.
22. Dejonchere PH, Bradley P, Clemente P, Cornut G, Crevier-Buchman L, Friedrich G, et al. A basic protocol for funcional assement of voice pathology, specially for investigating the efficacy of (phonosurgical) treatments and evaluating new assement techniques. Guideline elaborated by the Committee on Phoniatrics of the European Laryngological Society (ELS). Eur Arch Othoryinolaringol. 2001;258:77-82.
23. Corazza MCA. Avaliação do processamento auditivo central em adultos: teste de padrões tonais auditivos de frequência e testes de padrões tonais auditivos de duração [tese]. São Paulo: Universidade Federal de São Paulo; 1998.
24. Luchesi KF, Moura LF, Kitamura S, Nakamura HY. Problemas vocais no trabalho: prevenção na prática docente sob a óptica do professor. Saúde Soc. 2009;18(4):673-81.
25. Dreossi RCF, Momensohn-Santos T. O ruído e sua interferência sobre estudantes em uma sala de aula: revisão de literatura. Pro Fono. 2005;17(2):251-8.
26. Libardi A, Gonçalves CGO, Vieira TPG, Silvério KCA, Rossi D, Penteado RZ. O ruído em sala de aula e a percepção dos professores de uma escola de ensino fundamental de Piracicaba. Distúrb Comun. 2006;18(2):167-78.
27. Behroozmand R, Korzyukov O, Larson CR. ERP Correlates of pitch error detection in complex tone and voice auditory feedback with missing fundamental. Brain Res. 2012Apr;1448:89-100.
28. Perkell JS, Guenther FH, Lane H, Mattes ML, Perrier P, Vick J, et al. A theory of speech motor control and supporting data from speakers with normal hearing and with profound hearing loss. J Phonetics. 2000Jul;28(3):233-72.
29. Rodrigues N. Neurolinguística dos distúrbios da fala. 3ª. ed. São Paulo: Cortez, 1999. 200p.