A Work Project, presented as part of the requirements for the Award of a Masters Degree in Economics from the NOVA – School of Business and Economics.
The determinants of teacher effectiveness in Portuguese schools
Rodrigo Lopes Ferreira
Student Number 710
A thesis carried out under the supervision of Professors Ana Balcão Reis, Maria
The determinants of teacher effectiveness in Portuguese schools
Abstract
This work project analyses the impact of teachers on student exam scores and the determinants
of teacher effectiveness in Portuguese schools. The main findings are that teachers are an
important component of student achievement and that unobservable characteristics explain
most differences in teacher quality. Having a master’s degree has no impact on teacher quality.
Unlike their female counterparts male teachers exhibit losses in their teaching effectiveness
over the years. We also find positive and significant peer effects between teachers.
JEL Classification
: I210Keywords: teacher value added; education; observables; national exams.
Acknowledgments
I would like to thank my advisors Professors Ana Balcão Reis, Maria do Carmo Seabra and
Luís Catela Nunes for all the motivation, guidance and patience. I am also thankful to DGEEC
for providing access to the data used in this study. I dedicate this work to my parents: my
I.
Introduction
It is well established among researchers, the educational community, and policy makers, that
teachers are a fundamental element in the student’s learning process. But how can we measure this impact? How relevant is it for a student to have a better or worse teacher? And what exactly
makes a good teacher? Can we use observable characteristics to identify good teachers? The
answer to such questions involves a two-step approach: first is it necessary to obtain a measure
of teacher quality, then analyse what determines it. In the first step, researchers often resort to
Teacher Value Added estimation techniques. Unfortunately such research is highly dependent
on extensive datasets that are seldom available outside the US and UK. It is relevant to conduct
such an analysis in different educational contexts. Therefore we employ data from the
Portuguese public school system to investigate the impact that teacher quality has on Portuguese
Language and Mathematics national exam scores, our measures of student achievement, and
access the impact that different teacher observable characteristics have on teacher value added.
We do this by estimating the teacher value added for two-year periods corresponding to the 5th
and 6th grades.
We find that teachers are indeed a relevant determinant of student achievement with up to 13%
percent of the variation in student test scores in the Portuguese Language exam being
determined by Portuguese Language teachers and up to 16% of the variation in Mathematics
test scores being explained by Mathematics teachers. Teacher value added also shows a relevant
degree of variability, with a 1 S.D. improvement in our measure of teacher quality leading to
an increase of 3.94 points out of 100 in 6th grade exam scores for Portuguese Language and 6.9
points for Mathematics over the two year period a teacher follows a student. This correspond
0.31 SD for Mathematics.1
Noticing that most studies are performed with yearly exams (instead
of exams every two years like we do) our results are comparable with other estimates in the
literature. Aaronson et al. (2007) find that a 1SD increase in teacher quality has an impact of
0.15 SD in Mathematics yearly test scores using data from grades 3 to 11. Rockoff (2004) finds
an impact of 0.1 SD in both English and Mathematics yearly test scores from grades 2 to 6.
More recently, Chetty, Friedman, and Rockoff (2014) find an impact of 0.14 SD for
Mathematics and 0.1 SD for English using grades 3 to 8.
We then use teacher observable characteristics to test if they are able to predict our measure of
teacher quality. Using traditional specifications to access the determinants of teacher
effectiveness we find that at most 1.2% of teacher quality can be explained by variables such
as experience, gender and training. This has relevant policy implications. In particular, in the
Portuguese case, teachers are allocated to public schools according to a national ranking based
on teacher observable characteristics, with more experience and higher graduation grades
giving priority in the allocation process. There is no compelling evidence on the literature
(Gordon, Kane and Staiger (2006), Hanushek, Kain, O'Brien and Rivkin (2005)) of the
relationship of such variables with educational outcomes nor that allocating teachers according
to them improves student achievement, a result confirmed here.
However, we show that, unlike what is pointed by most literature, experience is indeed relevant
after the first years of teaching but not in a positive manner. Once we make the distinction
between male and female teachers, we find that male teachers experience a negative and
statistically significant decrease in quality after 17 years of teaching. This suggests that
experience is most likely capturing human capital depreciation associated with aging, that is
not significant for female teachers.
1
In order to fully employ the measure of teacher quality obtained, we then extend this analysis
to investigate to which degree teacher peer effects are relevant for an individual teacher
effectiveness. We also investigate to which extent having a differentiated ability to teach
different kinds of students affects teacher performance as well as if there are gains/losses in
teaching in a school where a teacher differentiated teaching ability matches the one of his/her
colleagues.
In Section II we revise the literature on the determinants of teacher effectiveness and
measurement of teacher value added, in Section III a description of the Portuguese Educational
system is presented, in Section IV we describe the data used, in Section V we expose our
empirical strategy both at the level of the estimation of teacher value added and its determinants
and in Section VI we analyse the results obtained. Finally, in Section VII we conclude.
II.
Literature Review
The idea that education is conjointly produced by community, families, schools, and students
in an input-output relationship can be traced back to the “Coleman Report” (Coleman, (1968)), which emphasized the importance of student peer effects and family’s socioeconomic
background as being the major determinants of educational output. These relations would be
latter on explored by economists under the concept of educational production function
(Hanushek (1979)) and research expanded the focus to several other educational inputs such as
schools and teachers.
Although there is a wide consensus around the educational community and literature that
teachers are a decisive educational input (Hanushek, (2011), Hanushek, Kain, O'Brien, and
Rivkin, (2005), Aaronson, Barrow and Sander (2007), Rockoff (2004)) 2, there is not consensus
2
among scholars on what exactly are the characteristics of an effective teacher. In a
comprehensive review Hanushek (2003) identifies a split in the literature with 41% of the
studies finding experience to be significantly related with teacher performance. Authors such
as Rockoff (2004), find that having more than 10 years of experience brings positive gains in
teacher effectiveness3 while Staiger and Rockoff (2010), Hanushek, Kain, O'Brien and Rivkin
(2005), find that experience is only relevant in the first years of teaching. A common result
found by authors such as Hanushek and Rivkin (2006, 2004), as well as Gordon, Kane and
Staiger (2006), is that the level of certification is not relevant, a result that we also find for
Portuguese schools. Overall this points to the notion that teachers do matter, but the
characteristics of an effective teacher are mainly unobservable.
The disentanglement of the effects of the inputs of the education production function is not an
easy task, and the impact of teachers is no exception. Such estimation is complicated mainly
due to a problem of non-randomness and limited data– as it is so common in Economics of Education. Indeed if teachers were simply randomly assigned to each student - with enough
observations per teacher – the determination of most effective teachers could be obtained
simply by looking at average student’s test results at the end of every schoolyear (Harris, (2009)). However this is not the case. Family’s housing and schooling decisions are based on
household’s preferences and endowment (Tiebout (1956)). There is considerable evidence that
families react and enrol their children in schools that they perceive as being better, for instance
using school rankings based on average scores in national exams (Nunes, Reis and Seabra
(2015), Portugal). Also, there is evidence that there is student sorting within schools, at least in
the USA, with least qualified teachers being assigned to underperforming students, and in
teacher allocation between schools with more qualified and experienced teachers preferring to
3 Specifically the author finds that reading and test scores differ on 0.17 SD on average between beginning
move to schools with higher achieving student populations (Clotfelter, Ladd, and Vigdor
(2006), Greenberg and McCall, (1974), Hanushek, Kain, and Rivkin (2004)).
However even if educational inputs are determined by schools and families choices this
nonrandomness could be easily overcome with enough data on all the inputs affecting the
educational production function over time, including student’s individual ability (Todd and
Wolpin, (2003)), which unfortunately are hard to obtain.
In order to deal with this difficulties researchers usually employ Teacher-Value Added (TVA)
models and a growing body of literature has been expanding under their use. Although different
specifications can be used, TVA models have the common features of explaining current
student achievement as a function of lagged student achievement measures and
contemporaneous school and family inputs (including socioeconomic variables). Assuming that
education is a cumulative process the lagged student achievement measures should capture
previous educational inputs. The choice of the specification used depends mainly on the kind
of data the researcher has at its disposal (Todd and Wolpin, (2003)).
There isn’t however consensus over the applicability of such models with authors such as
Gordon, Kane, and Staiger (2006) and Hanushek (2009) advocating not only for their feasibility
but that teacher selection using TVA models can significantly increase student achievement. In
contrast, Corcoran (2010) and Baker et al. (2010) advocate that teacher value added is an
inadequate approximation to teacher quality.
In order to access whether TVA models provide unbiased measures of teacher impact on student
test scores Kane and Staiger (2008) conducted an experimental evaluation using data generated
in Los Angeles Unified School District where teacher effects were estimated in a
pre-experimental period (with non-random assignment between students and teachers) and with
random assignment. The authors were able to conclude that the usual teacher-value added
student performance in the short-term finding also significant decay in the impact of a teacher
over the years.4
Chetty, Friedman, and Rockoff (2014) use tax records, teacher turnover events across schools
and classes, and purposely omitted parent characteristics to access the unbiasedness of TVA
estimates. They find not only that TVA estimates are unbiased predictors of a teacher’s impact
on student achievement but also that students have positive long-term benefits for being
assigned to high Value-Added teachers, such as higher college attendance rates and salaries.
These results favour the use of TVA models.
In an influential study, Rothstein (2008) develops a falsification method based on the idea that
current TVA measures cannot “affect” past student scores. Using administrative data on public
schools in North Carolina the author shows that this “effect” occurs from 5th grade teachers to learning in 4th grade – which obviously has no causal relationship - and concludes that commonly used TVA models do not obtain causal effects of teacher impacts on student test
scores namely because classroom assignments are not independent conditional on typical
controls such as student lagged scores and socioeconomic characteristics. However, in a recent
study Goldhaber and Chaplin (2015) argue that Rothstein’s falsification test can be helpful to
identify the existence of student tracking but that this tracking can be the result of lagged
achievement, which is a variable that is widely used in TVA models; therefore failing this test
may not imply bias. In a theoretical exposition and simulations the authors show that the test
will often falsify TVA models that are unbiased and will not falsify TVA models that are biased.
The estimation of teacher value added outside the USA and UK is fairly limited5
. Regarding
the Portuguese case, Sousa (2016) analyses the determinants of teacher effectiveness for
Portuguese secondary schools using 9th and 12th grade exam scores. The author’s findings
4
Unfortunately this study does not contemplate how the teacher’s allocation process between schools can affect the bias of TVA estimates, since the randomization was made within each school.
5
suggest that teachers are responsible for 49% of the variation in students’ performance after controlling for student’s lagged test scores, gender, social support, age and internet access. The author also finds that gender, experience, and distance from home are significative determinants
of teacher value added.
III.
Portuguese Educational system
The majority of Portuguese students attends public schools (87.5% of the student population in
2014/2015)6
. Education is compulsory until the age of 18 and is divided into two stages. The
first stage, Ensino Básico, is divided into three cycles. The first one goes from the 1st to the 4th
grade, the second comprises 5th and 6th grade and the third cycle goes from 7th to 9th grade. In
the second stage, Ensino Secundário, students complete their secondary education and can have
access to tertiary education. In the period under study, students performed national exams for
Mathematics and Portuguese Language in the end of 4th, 6th, 9th and 12th grade.7 We use the 6th
grade exams as dependent variable and 4th grade exams as control in our estimations.
In primary education students are allocated to a single teacher that teaches most of the materials.
From 5th grade onwards students have several courses, namely Mathematics and Portuguese
Language, each taught by a different teacher. Students are allocated to schools according to
parent’s preferences, with students whose home or parent’s working location is closer to a given school being given priority to that school.
Regarding teachers, they are allocated to schools based on their preferences, with more
experienced teachers and with higher grades upon graduation having priority relative to the
other ones.8 Within a school, student-teacher pairing is up to the school principal, under the
6
DGEEC – Direcção Geral de Estatisticas da Educação e Ciência – state entity that provides quantitative support to the Ministry of Education
7 During secondary education students also perform other national exams besides Mathematics and Portuguese
Language.
8 Teachers may be associated with a school district (Professores de Quadro de Agrupamento) or not (Professores
administrative principle that it is preferable that teachers and students are placed with the same
teacher over the years (e.g. the same math teacher in the 5th and 6th grade), a practice named
“pedagogical continuity”.
IV.
Data and Descriptive Statistics
In order to produce teacher value-added estimations this study uses an administrative dataset
managed by DGEEC9. This dataset contains data at the student and teacher levels such as
student socioeconomic characteristics as well as records about the school and courses attended.
Regarding teacher characteristics it contains information such as teacher’s education, training and years of experience.
Student test scores were obtained by merging this dataset with another dataset that belongs to
JNE – Júri Nacional de Exames – the entity responsible for managing the Portuguese national exams. These standardized exams are produced by the Ministry of Education and Science and
are administered annually in different disciplines depending on the grade students are attending.
Sample restrictions
To its full extent the dataset contains data from the school year 2006/2007 up to 2014/2015.
However, since Portuguese 6th grade students are graded on a scale that goes from 1 to 5 up to
the school year 11/12, during this period students’ 6th grade exam cannot be approximated by a continuous function. From school year 11/12 until 14/15, 6th grade exam scores are reported on
a scale ranging from 0 to 100. Therefore we restrict our teacher value-added estimations to these
school years. The data comprises four cohorts: the first one, which we will denote cohort 1012,
did the 4th grade exam in the school year 09/10 and the 6th grade exam in the school year 11/12
apply every year directly to schools without having a permanent link to the school; if they are not placed they go to a pool of teachers that are used to answer to emergency staff needs along the school year.
9
DGEEC – Direcção Geral de Estatisticas da Educação e Ciência - produces statistical and quantitative analysis
and the last one, which we will denote cohort 1315, did the 4th grade exam in the school year
12/13 and the 6th grade exam in the school year 14/15.
Also in order to isolate the effect of a teacher we start by restricting our sample to the cases
where a given student i has the same teacher in both the 5th and 6th grade. This is a strong
restriction as it excludes students that fail in the 5th grade. Also, it is reasonable to consider that
students and teachers that are matched two different years may have specific characteristics, for
instance, for being in schools with high turnover rates where teachers don’t want to be more than one year. Last but not least, the econometric methods used imply the usage of students for
which a 6th and 4th grade exam can be matched.
As pointed out by Kane and Staiger (2002), the measurement error associated with teacher
fixed-effects estimations can be problematic: the noise associated with a low number of
observations per teacher will lead to the wrong conclusion that best and worst performing
teachers will be the ones with a lower number of observations. Therefore based on Aaronson et
al. (2007) we restrict our estimations to teachers with a minimum number of 15 observations.
Sample and Population characteristics
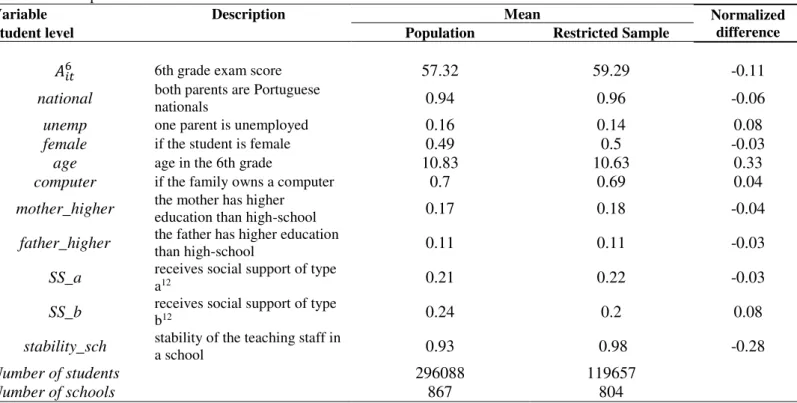
In Table 1 we compare our restricted sample with all students for which a 6th grade exam is
recorded from the school year 11/12 onwards, our population of interest. The results presented
refer to Portuguese Language exams. The same results apply to the Mathematics exams.
Summarizing, our restricted sample includes students that performed a 6th grade exam from the
school year 11/12 up to 14/15, had the same teacher on the 5th and 6th grade and this teacher
had a minimum of 15 observations between these school years.
Since our group of analysis involves a very large sample, selected by imposing restrictions to
the populations, instead of applying the typical t-tests we follow Imbens (2015) and analyse the
characteristics of the group of students selected10
. A difference higher than 0.25 is considered
large (Imbens and Woolridge (2007)). This is defined as:
Δ𝑋,𝑘= 𝑋̅̅̅̅̅ − 𝑋𝑝,𝑘 𝑠,𝑘
̅̅̅̅̅
√(𝑆𝑝,𝑘2 + 𝑆𝑠,𝑘2 )/2
where 𝑋̅̅̅̅̅ and 𝑋𝑝,𝑘 ̅̅̅̅̅ 𝑠,𝑘refer to the average values of variable k in the population and restricted sample respectively, and 𝑆𝑝,𝑘2 and 𝑆𝑠,𝑘2 the corresponding variances.
As we can see from the last column of Table 1, there are no significant differences between our
restricted sample mean characteristics and the population characteristics with the exception of
Age and our measure of the stability of the teaching staff11. In the sample we have younger
students and schools with a more stable teaching staff.
The restricted sample has 119657 observations, 40.4% of the population, distributed over 804
schools. Each observation in the restricted sample corresponds to a 4th grade, 6th grade exam
score pair that a given student i obtained. Regarding Mathematics we end up with 96494
students – 40.5% of the population - and 819 schools from the original 882.
10 As pointed by Imbens (2015), the t-statistic is equivalent to the normalized difference between means multiplied
by the square root of the number of observations in the sample. Therefore large samples would always have a tendency to have very large t-statistics. In practice we are analysing the degree of overlap between the covariate distributions of the two groups.
11
Table 1 –descriptive statistics
Variable Description Mean Normalized
difference
Student level Population Restricted Sample
𝐴𝑖𝑡6 6th grade exam score 57.32 59.29 -0.11
national both parents are Portuguese
nationals 0.94 0.96 -0.06
unemp one parent is unemployed 0.16 0.14 0.08
female if the student is female 0.49 0.5 -0.03
age age in the 6th grade 10.83 10.63 0.33
computer if the family owns a computer 0.7 0.69 0.04
mother_higher the mother has higher
education than high-school 0.17 0.18 -0.04
father_higher the father has higher education
than high-school 0.11 0.11 -0.03
SS_a receives social support of type
a12 0.21 0.22 -0.03
SS_b receives social support of type
b12 0.24 0.2 0.08
stability_sch stability of the teaching staff in
a school 0.93 0.98 -0.28
Number of students 296088 119657
Number of schools 867 804
Note: All variables with the exception of Exam6,age, age_sch and stability_sch are dummy variables.
The restrictions imposed lead to a reduction in the number of teachers being analysed. The
number of teachers reduces from 5687 to 3038 for Portuguese and from 5374 to 2497 for
Mathematics. In the Population, 25% of the teachers have less than 22 observations for
Portuguese and 24 observations for Mathematics
V.
Empirical Approach
Teacher Value Added
The Teacher Value Added is obtained by estimating a model of the form:
𝐴𝑖𝑡6 = 𝜃𝐴𝑖,𝑡−24 + 𝜶𝑿𝒊𝒕+𝜹𝑺𝒌(𝒊,𝒕)+ 𝜇𝑗(𝑖,𝑡)+ ∑ 𝜌𝑚(𝑖,𝑡)𝐶𝑚(𝑖,𝑡) 𝑴
𝒎=𝟏
+ 𝜖𝑖𝑡
(1)
Where 𝐴𝑖𝑡6 is the 6th grade exam score for student i in year t, 𝐴𝑖,𝑡−24 is the exam score in 4th grade,
𝑿𝒊𝒕is a vector of student- characteristics in year t described in table 1. Student i is allocated to
12
school k in years t and t-1 and 𝑺𝒌 is a vector of school inputs. The fixed effect of teacher j assigned to student i in years t and t-1 is measured explicitly by 𝜇𝑗, the estimated teacher-fixed effect, that is our measure of teacher quality. In other to add robustness to our estimations,
cohort level dummies 𝑪𝒎 are included in the model. These capture possible differences in the exams difficulty over time. School level characteristics 𝑺𝒌include the average number of students in the school over the years nstudents_sch, the proportion of students in the school that
receive school subsidies, SS_a_sch and SS_b_sch; the percentage of students whose mother has
tertiary education, mother_higher_sch – the average students age, age_sch; and a measurement of the stability of the teaching staff, stability_sch, presented above.
Implicitly the model assumes that student-level characteristics only impact student achievement
on the year the exam is performed with the objective of not increasing the parameters of an
already demanding model. The characteristics included however are highly stable over the
course of these two years.
Each model is estimated separately for Mathematics and Portuguese Language. The OLS
estimation of the model is equivalent to applying the typical within-estimator in the sense that
it also produces the same estimators for the coefficients (Cameron and Trivedi (2009)), with
the advantage of not considering teacher-fixed effects as nuisance parameters and explicitly
including them in the model instead of subtracting the within group average to eliminate them.
Cluster-robust standard errors are employed at the school-level in order to take into
consideration likely correlations between observations within each school. 13
Determinants of Teacher Value Added
13
In order to assess the determinants of teacher quality we use the teacher value added measure
obtained using equation (1) for teacher j teaching the subject b –Mathematics or Portuguese Language - 𝜙̂ = 𝑇𝑉𝐴𝑗𝑏 𝑗 and we regress them on a vector of teacher observable characteristics. We include both Mathematics and Portuguese Language teachers in the same regression adding
also a dummy variable to differentiate between them14
:
𝑇𝑉𝐴𝑗 = 𝛽0+ 𝛽1Pj+ 𝛽2𝑇𝑗+ 𝛽3𝐹𝑗+ 𝛽4𝐸𝑗+ 𝛽5𝐵𝑗+ 𝑢𝑗 (2)
where Pj; Tj; Fj and Bj are dummy variables. Pj is equal to one if teacher j changed school in the time period being considered ( denominated changed in regression outputs); Tj is equal to one if teacher j has an educational level higher than a bachelor degree (higher); Fj is equal to one if teacher j is female (female) and Bj is equal to one if he/she teaches mathematics (mathematics).
𝐸𝑗 is a continuous variable that denotes the number of years of experience (exper). The model
was further extended to allow an interaction between experience and gender.
Peer effects and teacher differential
Using the teacher value added specification presented on the previous section we extend our
analysis to investigate whether teacher peer effects can affect a given teacher effectiveness. We
also look at the specific impact of a specific characteristic not previously studied in the
literature, which we label teacher differential. In order to do this we estimate the model:
Where Dj is the teacher differential, a proxy to the extent a teacher has differentiated teaching capabilities for different kinds of students. 𝑇𝑉𝐴̅̅̅̅̅̅̅̅𝑗𝑘 (mean_tva) is the average value added of teacher j colleagues (working in school k) and 𝐷̅̅̅̅𝑗𝑘 (mean_differential) represents the school level teacher differential constructed as the average differential of teacher i’s colleagues. An
14
The model was also estimated separately for each type of teacher. The results where equivalent to the ones presented.
interaction term (Dj∗ 𝐷̅̅̅̅)𝑗𝑘 is included. Since it is considered that teacher value added may influence heterogeneously different types of students we include 𝑴𝒌, a 1 by 4 vector of the proportion of students with each score from 2 to 5 in the 4th grade Portuguese exams15
and 𝑮𝒋,
a vector of teacher observable characteristics presented in equation (2).
The teacher differential Dj is obtained by estimating the teacher value added model (1) using
subsamples in order to include only low-achieving students (defined as having 4th grade exam
scores 1 and 2) or only high-achieving students (defined as having 4th grade exam scores 4 and
5) and taking the difference between the later estimation and the former.
Such an analysis takes into consideration three possible sources of peer effects: from the
average effectiveness of the colleagues’ - 𝑇𝑉𝐴̅̅̅̅̅̅̅̅𝑗𝑘 - from their teaching profile 𝐷̅̅̅̅𝑗𝑘 and from the
degree of complementarity between one’s teaching profile and one’s colleagues Dj∗ 𝐷̅̅̅̅𝑗𝑘. Since our objective is to capture the extent to which the teaching staff effectiveness in a given school
may affect an individual teacher’s performance, it is important that these indicators 𝑇𝑉𝐴̅̅̅̅̅̅̅̅𝑗𝑘 and
𝐷𝑗𝑘
̅̅̅̅ are not contaminated by the teachers own heterogeneity indicator. That is why for every
teacher these indicators are calculated excluding each teacher’s own values. Also teacher j
individual differential Dj captures the effect due to the teacher own heterogeneity. School level
clustered standard errors are used to consider possible correlation between teacher unobservable
characteristics within a school.
Variable Dj allows us to understand to which extent teachers that are unequally efficient with
different types of students are better teachers on average or not and to which extent working
with colleagues with different teaching profiles affects one’s teaching ability. The answer to such question is not immediate. One could consider the case of a teacher that puts an extra effort
in teaching high achievers since they may provide more immediate and exciting outcomes. If
15
this is the case this teacher may have a higher value-added for these students. On the other way
around, if we assume a concave educational production function with some degree of
substitutability between educational inputs, then with low achievers there is more room for an
extra effort from the teacher to have a significant positive impact in student achievement and
therefore increase the teacher value added. Obviously a causal interpretation from Dj would require the assumption that there are no external factors that affect this proxy for a teacher
effectiveness profile and average teacher quality. Even if that is not the case such analysis would
still have predictive and interpretative relevance.
The major drawback of such approach is that the inclusion of a teacher colleague’s average effectiveness 𝑇𝑉𝐴̅̅̅̅̅̅̅𝑘 raises relevant questions regarding possible endogeneity problems. It is not unlikely that better teachers may simply be attracted to specific schools and therefore the
estimator will be positively biased. However, teacher allocation process in Portugal is relatively
well defined and dependent on a teacher’s preferences, graduation grade and experience, the latter one of these is controlled in our model. Also, if teacher preferences are determined by the
quality of the students studying in the school, that is controlled for in our model, by the
percentage of students having each possible 4th grade exam score.
VI.
Results
Impact of teacher Value Added
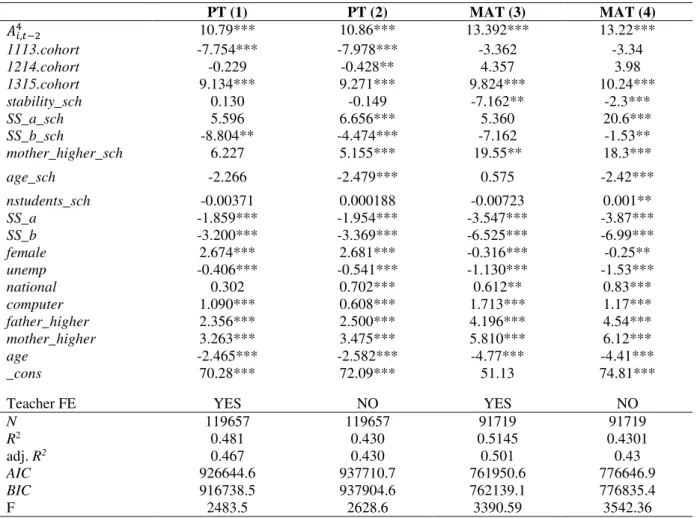
In Table 2 we present the estimation results for equation (1). All models presented use a
minimum of 15 observations per teacher. The first two models use Portuguese Language exams
with and without teacher Fixed-Effects and the last two use Mathematics exams with and
without teacher Fixed-Effects.16
16
The usage of school and teacher fixed effects is dependent on teachers moving between schools.
This would imply that most of the teachers in our sample would be lost. Besides that, several
authors present scepticism about the idea of using school-fixed effects to conduct an analysis
with policy implications (Harris 2009) since the teacher effect being captured is not the teacher
value added relative to the mean teacher in a country or school district but relative to the mean
teacher in the school. Producing accountability measures based on these types of models could
generate incentives for teachers to compete between each other within schools.17
The F-test for the joint significance of teacher effects reveals they are jointly significant at a
1% significance level. We find that up to 13% percent of the variation in student test scores in
Portuguese Language exam is determined by Portuguese Language teachers and up to 16% of
17
Also when using model selection indictors a model that includes school fixed effects does not outperform a model without. The adjusted 𝑅2 falls from 0.467 in the base model to 0.229 in the model that includes school fixed effects.
Table 2– Estimation Results
PT (1) PT (2) MAT (3) MAT (4)
𝐴𝑖,𝑡−24 10.79*** 10.86*** 13.392*** 13.22***
1113.cohort -7.754*** -7.978*** -3.362 -3.34
1214.cohort -0.229 -0.428** 4.357 3.98
1315.cohort 9.134*** 9.271*** 9.824*** 10.24***
stability_sch 0.130 -0.149 -7.162** -2.3***
SS_a_sch 5.596 6.656*** 5.360 20.6***
SS_b_sch -8.804** -4.474*** -7.162 -1.53**
mother_higher_sch 6.227 5.155*** 19.55** 18.3***
age_sch -2.266 -2.479*** 0.575 -2.42***
nstudents_sch -0.00371 0.000188 -0.00723 0.001**
SS_a -1.859*** -1.954*** -3.547*** -3.87***
SS_b -3.200*** -3.369*** -6.525*** -6.99***
female 2.674*** 2.681*** -0.316*** -0.25**
unemp -0.406*** -0.541*** -1.130*** -1.53***
national 0.302 0.702*** 0.612** 0.83***
computer 1.090*** 0.608*** 1.713*** 1.17***
father_higher 2.356*** 2.500*** 4.196*** 4.54***
mother_higher 3.263*** 3.475*** 5.810*** 6.12***
age -2.465*** -2.582*** -4.77*** -4.41***
_cons 70.28*** 72.09*** 51.13 74.81***
Teacher FE YES NO YES NO
N 119657 119657 91719 91719
R2 0.481 0.430 0.5145 0.4301
adj. R2 0.467 0.430 0.501 0.43
AIC 926644.6 937710.7 761950.6 776646.9
BIC 916738.5 937904.6 762139.1 776835.4
F 2483.5 2628.6 3390.59 3542.36
the variation in Mathematics test scores is explained by Mathematics teachers.18
By looking at
Table 3 we can see that teachers can have a determinant impact on a student’s performance specially in Mathematics: If the 10% worse teachers were replaced by teachers of the same
quality of the best 10%, that would have an impact of at least 10.04 points in the 6th grade
national exam for Portuguese and 17.33 points for Mathematics on average.
By looking at the dummy cohorts we see a significant variation in the difficulty of both the
Mathematics and Portuguese Language exams.19
From a policy point of view there has been a trend in Portugal to increase the stability of the
teaching staff20
. It is therefore relevant to notice that the stability of the teaching staff (stability)
is not individually statistically significant under any specification for Portuguese Language.
This variable was constructed before any sample restrictions were imposed and it is the
probability that a given Portuguese or Mathematics teacher that teaches a school in year t was
found in that same school in year t-1. This indicates therefore that, at least for students that are
matched with the same teacher in the 5th and 6th grade, being in a school with a stable teaching
18
These values serve as an upper-bound of the explanatory power of teacher-effects and correspond to the R2 of
an equation containing solely teacher fixed effects. The lower bound is obtained by the absolute variation in R2
when we exclude the teacher fixed effects from a base model containing student and school characteristics. These values are 5.1% for Portuguese and 6.4% for Mathematics
19
Using model (1) as our base of analysis we can see that the cohort 1113 have on average less 7.754 points on the 6th grade exam score than the students in the cohort 1012, the base cohort. But students in the cohort 1315 have
on average 9.134 more points in the 6th grade exam score than the average student in the base cohort. It is unlikely
that such a variation is explained by overall student improvement in the 2 years of difference between these cohorts.
20 See “Decreto
- Lei nº20/2006” (Law nº20/2006) and “Decreto-Lei nº83A/2014” (Law nº83A/2014) for legal descriptions of the reforms.
Table 3 – Distribution of teacher value added
Percentile
Rank Portuguese Mathematics
Descriptive Statistics
Portuguese Mathematics
0.05 -6.64 -11.74 Min -14.78 -26.44
0.10 -5.16 -8.94 Max 15.88 24.06
0.25 -2.71 -4.94 Mean -0.13 -0.35
0.50 -0.15 -0.32 Std. Dev. 3.94 6.90
0.75 2.42 4.26 Variance 15.51 47.55
0.90 4.88 8.39 Skewness 0.03 0.01
staff has no significant effect on the student’s performance or a negative impact as it is the case with mathematics. It is possible, however, that the stability of the student own teacher – that is having the same teacher in the 5th and 6th grade – is relevant for the learning process, which cannot be captured by our model.
At the individual level we can see that students under lower socioeconomic conditions have on
average worse performance. Individual socioeconomic variables such as SS_a, SS_b, unemp,
father_higher, mother_higher and computer, account for up to 23% of the variation in 6th grade
exam scores for Portuguese exams and 28.5%.21
We can also see that female students have on
average more 2.674 points (on a scale from 0 to 100) on the national exam than male students
for Portuguese, a result also find by Slater, Davies, and Burgess (2012) but underperform in
mathematics on average by -0.316. We can also see that an individual’ mother tertiary education
is more relevant for a student’s performance on average than a father’s tertiary education with
the Wald test for their difference yielding a p-value close to 0.
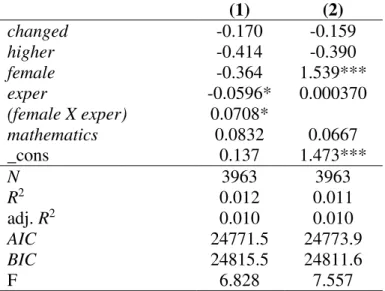
Determinants of Teacher value added
In Table 4 model (2) is represented by column output (2). Column (1) reproduces the same
model while adding an interaction term between experience and gender. We can see that
connecting the student/teacher records with the teacher’s characteristics does not allow the
matching of all teachers. Table 5 presents descriptive statistics for the variables used. A striking
result is that at most 1.2% of the variability in teacher value added can be explained by
observable characteristics, a value in line with what is found in the literature for the variables
included in the model. Leigh (2010), finds that variables such as having a master’s degree, gender, and experience explain less than 1% of the variability in teacher quality.
21
This value serves as an upper-bound indicator for the amount of variation explained by the referred variables. It corresponds to a R2 from regressing student scores solely on socioeconomic variables. The lower bounds are
3.4% for Portuguese Language and 5.04% for Mathematics and are obtained as the absolute variation in the R2
Using a more comprehensive dataset Aaronson
et al. (2007) finds that a model that includes
tenure and advanced degrees indicators
explain at most 1% of the variation. When
teacher ethnicity, experience, certifications and
university ranking are included the R2
increases to 7.7%
A common result in the estimation of the
determinants of teacher quality is that
experience has a residual role, with few studies
finding it as being statistically significant
(Hanushek and Rivkin (2006)), commonly
with only the first years of experience as being
relevant (Gordon, Kane, and Staiger (2006),
Aaronson et al. (2007), Hanushek, Kain,
O'Brien and Rivkin (2005)). The p-value for
experience in column (2) shows that experience
is not individually statistically significant at a
10% significance level. However once we
decompose experience by gender a different
result emerges. In Figure 1 we show the average
marginal effects of experience decomposed by gender.
We can see that female teachers are indeed not affected by experience in a statistically
significant manner. Male teachers on the other hand are negatively affected by experience in a
Table 4 –estimation results for model (2) – Portuguese and Mathematics
(1) (2)
changed -0.170 -0.159
higher -0.414 -0.390
female -0.364 1.539***
exper -0.0596* 0.000370
(female X exper) 0.0708*
mathematics 0.0832 0.0667
_cons 0.137 1.473***
N 3963 3963
R2 0.012 0.011
adj. R2 0.010 0.010
AIC 24771.5 24773.9
BIC 24815.5 24811.6
F 6.828 7.557
Source: author’s calculations using MISI and JNE p-values: * p<0.1, ** p<0.05, *** p<0.01
Table 5 - Descriptive Statistics
Variable Mean Std. Dev. Min Max
changed 0.03 0.17 0.00 1.00
higher 0.08 0.28 0.00 1.00
female 0.84 0.36 0.00 1.00
exper 26.48 7.15 0.87 39.97
mathematics 0.49 0.50 0.00 1.00
Figure 1 –Decomposition of Experience effects by gender
statistically significant manner after 21 years of experience, an effect that is accentuated over
the years. Our sample includes 634 male teachers and the first quartile of experience is 21.8.
It is worth nothing that in this sense experience is most likely capturing the ageing process of
the teacher and not the number of years working in the profession.
It seems that there is a depreciation in teaching abilities for male teachers over time which is
not verified (at least in a significant manner) for female teachers. Since studies analysing
teacher quality determinants analyse the effects of experience in an aggregate fashion, the
negative signal provided by male teachers is not enough to show experience as being
statistically relevant.
From a policy point of view this implies that reforms that delay the retirement of teachers,
especially male teachers, may generate an opportunity cost in terms of human capital
accumulation for students.
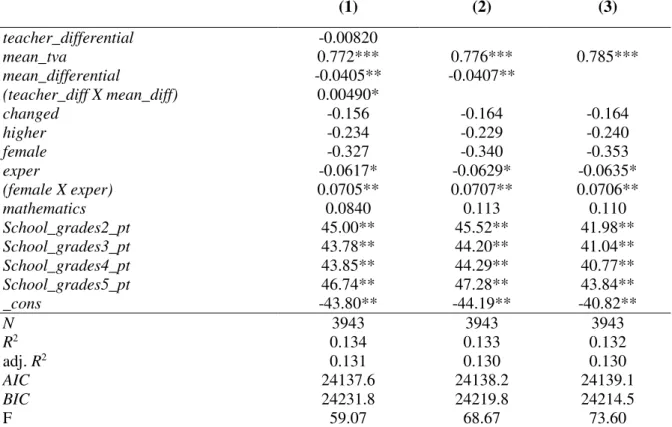
Peer effects and teacher differential
In Table 6 we present the estimation output for the model in eq. (3) an extension of eq. (2). The
models simply differ on the covariates being included. Using column (1) as our base of analysis
we can see that mean teacher peer effect is individually statistically significant at a 1%
significance level. An increase in one point in a given teacher colleague’s value added increases this teacher value added by 0.772 points on average, ceteris paribus. In other words a 1SD
improvement on the mean peer effectiveness improves a teacher value by 0.34 SD.22
Using
other specifications, (columns (2) and (3)) results do not change.
22
However we can see that there is a statistically significant negative relationship between the
colleagues differential and a given teacher effectiveness: working with colleagues where the
average difference between the value added for high achievers versus low achievers increases
by one point decreases the individual teacher value added by 0.0405 points. So it is not only the
colleague’s average effectiveness that matters, the difference in effectiveness is also relevant.
Interestingly there are statistically significant gains from this asymmetry at a 10% significance
level, although of a weaker magnitude, as can be seen by the interaction term, which suggests
that there are gains of complementarity between a given teacher differential and her/his
colleagues: even if a colleague’s differential is undesirable this can be slightly mitigated for the individual teacher if her/his differential matches the one of the colleagues.
VII.
Conclusion
Table 6– Determinants of teacher value added
(1) (2) (3)
teacher_differential -0.00820
mean_tva 0.772*** 0.776*** 0.785***
mean_differential -0.0405** -0.0407**
(teacher_diff X mean_diff) 0.00490*
changed -0.156 -0.164 -0.164
higher -0.234 -0.229 -0.240
female -0.327 -0.340 -0.353
exper -0.0617* -0.0629* -0.0635*
(female X exper) 0.0705** 0.0707** 0.0706**
mathematics 0.0840 0.113 0.110
School_grades2_pt 45.00** 45.52** 41.98**
School_grades3_pt 43.78** 44.20** 41.04**
School_grades4_pt 43.85** 44.29** 40.77**
School_grades5_pt 46.74** 47.28** 43.84**
_cons -43.80** -44.19** -40.82**
N 3943 3943 3943
R2 0.134 0.133 0.132
adj. R2 0.131 0.130 0.130
AIC 24137.6 24138.2 24139.1
BIC 24231.8 24219.8 24214.5
F 59.07 68.67 73.60
Under a teacher value added approach this study uses data on 119657 Portuguese students of
Portuguese Language and 91719 students of Mathematics to produce the most comprehensive
teacher value added estimation made in Portugal in terms of the number of schools, teachers
and students considered. Also it is the first one for 5th and 6th grade teachers. We found that
teachers are a relevant component of student achievement: Replacing the 10% worse teachers
by teachers of the same quality of the best 10%, would have an impact of at least 10.04 points
in the 6th grade national exam for Portuguese and 17.33 points for Mathematics on average (in
a scale from 0 to 100).
The determinants of teacher effectiveness were analysed. We show that observable
characteristics play a residual role in the determination of teacher value added. Also it was
clarified the nature of the relevance of experience and effectiveness differences among male
and female teachers. We show that the difference in effectiveness found between male and
female teachers can be accounted by the depreciation of male teacher’s effectiveness. This contradicts the general finding that experience is not relevant after the first years in the
profession.
It was also shown the existence of relevant peer effects at the teacher level within a school as
well as the existence of gains in having an appropriate matching between a teacher teaching
profile and a school teaching profile.
Although measurement error was taken into account, further lines of research could be followed
in order to tackle this common problem in a more sophisticated manner that would not require
the restrictions in the number of observations per teacher. In order to produce such estimates
researchers such as have been developing empirical Bayesian statistical methods that weight
teacher estimates based on estimated measurement errors associated with them. Kane and
Staiger (2008) and Chetty, Friedman, and Rockoff (2014) constitute some examples of such
As we have shown the group of students in our estimation sample is mostly representative of
the general populations. But since we impose that teachers follow the same student for at least
two years, the teachers being captured have lower turnover rates. Therefore although our results
can be extrapolated to the population of teachers that are associated with a given school
(Professores do quadro de agrupamento) the extrapolation of results to high turnover teachers
(such as Professores contratados) should be done with caution.
Bibliography
Aaronson, D., Barrow, L., & Sander, W. (2007). “Teachers and student achievement in the
Chicago public high schools”. Journal of labor Economics, 25(1), 95-135.
Bacher-Hicks, A., Kane, T. J., & Staiger, D. O.(2014). “Validating teacher effect estimates
using changes in teacher assignments in Los Angeles “(No. w20657). National Bureau of
Economic Research.
Baker, E. L., Barton, P. E., Darling-Hammond, L., Haertel, E., Ladd, H. F., Linn, R. L. &
Shepard, L. A.(2010). “Problems with the Use of Student Test Scores to Evaluate Teachers”.
EPI Briefing Paper# 278. Economic Policy Institute.
Cameron, Adrian Colin, and Pravin K. Trivedi.Microeconometrics using stata. Vol. 5.
College Station, TX: Stata press, 2009
Chetty, R., Friedman, J. N., & Rockoff, J. E. (2014). “Measuring the impacts of teachers I:
Evaluating bias in teacher value-added estimates”. The American Economic Review, 104(9),
2593-2632.
Chetty, R., Friedman, J. N., & Rockoff, J. E. (2014). “Measuring the impacts of teachers II:
Teacher value-added and student outcomes in adulthood”. The American Economic Review,
104(9), 2633-2679.
Clotfelter, C. T., Ladd, H. F., & Vigdor, J. L. (2006). “Teacher-student matching and the
assessment of teacher effectiveness”. Journal of human Resources, 41(4), 778-820.
Coleman, J. S.(1968). “Equality of educational opportunity”. Integrated Education, 6(5),
19-28.
Corcoran, S. P. (2010). “Can Teachers Be Evaluated by Their Students' Test Scores? Should
Education Policy for Action Series”. Annenberg Institute for School Reform at Brown University (NJ1).
Goldhaber, D., & Chaplin, D. D. (2015). “Assessing the “Rothstein Falsification Test”: Does
It Really Show Teacher Value-Added Models Are Biased?” Journal of Research on
Educational Effectiveness, 8(1), 8-34.
Gordon, R. J., Kane, T. J., & Staiger, D. (2006). “Identifying effective teachers using
performance on the job”. Washington, DC: Brookings Institution.
Greenberg, D., & McCall, J. (1974). “Teacher mobility and allocation”. Journal of Human
Resources, 480-502.
Hanushek, E. A. (1979). “Conceptual and empirical issues in the estimation of educational
production functions”. Journal of human Resources, 351-388.
Hanushek, E. A. (2009). Teacher Deselection: Creating a New Teaching Profession, ed. Dan
Goldhaber and Jane Hannaway, 165s80.
Hanushek, E. A. (2011). “The economic value of higher teacher quality”. Economics of
Education Review, 30(3), 466-479.
Hanushek, E. A., & Rivkin, S. G. (2006). “Teacher quality”. Handbook of the Economics of
Education, 2, 1051-1078.
Hanushek, E. A., Kain, J. F., & Rivkin, S. G. (2004). “Why public schools lose teachers”.
Journal of human resources, 39(2), 326-354.
Hanushek, E. A., Kain, J. F., O'Brien, D. M., & Rivkin, S. G. (2005). “The market for
teacher quality” (No. w11154). National Bureau of Economic Research.
Hanushek, E. A., Rivkin, S. G., Rothstein, R., & Podgursky, M. (2004). “How to improve
the supply of high-quality teachers”. Brookings papers on education policy, (7), 7-44.
Harris, D. N. (2009). “Would accountability based on teacher value added be smart policy?
An examination of the statistical properties and policy alternatives”. Education, 4(4), 319-350.
Harris, D. N., & Sass, T. R. (2006). “Value-added models and the measurement of teacher
quality”.Unpublished manuscript.
Imbens, G. W. (2015). “Matching methods in practice: Three examples”.Journal of Human
Imbens, G., and J. Wooldridge. (2007).”What’s New in Econometrics”. Lecture Notes,
NBER Summer Institute
Kane, T. J., & Staiger, D. O.(2008). “Estimating teacher impacts on student achievement: An
experimental evaluation” (No. w14607). National Bureau of Economic Research.
Leigh, Andrew. "Estimating teacher effectiveness from two-year changes in students’ test
scores." Economics of Education Review 29.3 (2010): 480-488.
Nunes, L. C., Reis, A. B., & Seabra, C. (2015). “The publication of school rankings: A step
toward increased accountability?”. Economics of Education Review, 49, 15-23.
Rivkin, S. G., Hanushek, E. A., & Kain, J. F. (2005). “Teachers, schools, and academic
achievement”. Econometrica, 73(2), 417-458.
Rockoff, J. E. (2004). “The impact of individual teachers on student achievement: Evidence
from panel data”. The American Economic Review, 94(2), 247-252.
Rothstein, J. (2008). “Teacher quality in educational production: Tracking, decay, and student
achievement” (No. w14442). National Bureau of Economic Research.
Rothstein, J.(2014). “Revisiting the impacts of teachers”. UC-Berkeley Working Paper.
Slater, H., Davies, N. M., & Burgess, S.(2012). “Do teachers matter? Measuring the variation
in teacher effectiveness in England”. Oxford Bulletin of Economics and Statistics, 74(5), 629-645.
Sousa, Sandra Isabel Portas de. “Four essays in economics of education”.(2016)
https://repositorium.sdum.uminho.pt/bitstream/1822/43451/1/Sandra%20Isabel%20Portas%2
0de%20Sousa.pdf
Staiger, D. O., & Rockoff, J. E. (2010). “Searching for effective teachers with imperfect
information”. The Journal of Economic Perspectives, 24(3), 97-117.
Tiebout, C. M.(1956). “A pure theory of local expenditures”. The journal of political economy,
416-424.
Todd, P. E., & Wolpin, K. I. (2003). “On the specification and estimation of the production