A Work Project, presented as part of requirements for the Award of a Master Degree in Economics from the NOVA – School of Business and Economics
Determinants of Portuguese Trade and
specialization across the period 1995-2014
Ana Rita Cardoso Couto Areosa
#841
A Project carried out on the Masters in Economics Program, under the supervision of: Professor Luís Campos e Cunha
2
Determinants of Portuguese Trade and specialization across the
period 1995-2014
Abstract
The purpose of this thesis is to evaluate the determinants of the Portuguese trade patterns between 1995 and 2014 and to compare the results with previous investigations. The econometric approach followed is based in dynamic panel data. This paper concludes that Portugal has comparative advantages in products relative intensive in unskilled labour and in products of economic activities with a high level of the technology proxy and with high market concentration. However, Portugal exhibits comparative disadvantages in products capital intensive while the skilled labour has a neutral impact. Since some results contradict previous literature, there were structural changes in the determinants of the Portuguese trade patterns.
Keywords: International trade, Specialization, Dynamic Panel Data, Labour Quality,
3
I.
Introduction
Over the last hundred years, the international environment has been suffering different changes. In the XX century, there were two world wars that affected many countries, including Portugal. However, “after six postwar decades of relentless progress, in recent years world trade growth,
and world trade liberalization, have both now seemingly ground to halt. Globally, trade grew
twice as fast as GDP in the 25 years prior to 2007, but at a rate below GDP since late 2011”
(Feenstra et al., 2015). Before 1950, Portugal was a relatively closed economy – the openness
4
Moreover, in 1993, it was established the Single Market, which implemented among the members of the EEC the four freedoms: movement of goods, services, people and capital. During the first years as a member of the EEC, as a result of macroeconomic stability, Portugal saw the Foreign Direct Investment (FDI) rise (Mateus, 1992). This statement can be confirmed by the figure 2 [of the Appendix], where we can see the rise in FDI (in percentage of GDP) after 1986. These funds were fundamental to invest in new structures, research and human capital. Yet, the acceleration of the FDI was not equally distributed by the different sectors. In particular, the financial sector became the major beneficiary of the FDI (Mateus, 1992). In the XXI century, as we conclude from the figure 2 [of the Appendix], the FDI in Portugal (as percentage of GDP) shows an unstable behavior, reaching, in 2010, the highest value (10%) and the lowest one (-0.7%), in 2014. The recent performance represents a net outflow of investment, which is the opposite of the last 40 years.
Hence, in the last five decades, there were some events that backed up the international relations, contributed to the increasing trade openness and, consequently, caused changes in the Portuguese trade patterns (Amador et al., 2007). The trade flows, combined with the industrialization process were the most outstanding aspects of the structural changes in the Portuguese trade over the XX century (Afonso and Aguiar, 2004).
Nowadays, the degree of openness of the Portuguese economy is about 80% (source: World Bank). Therefore, the intensification of the trade and the constant process of globalization led to a permanent investigation about the details and changes in the international relations. From an individual country’s perspective, it is fundamental to study the behavior and evolution of
trade patterns, since they may provide guidelines for the companies and governments on where and how to invest, in order to improve the efficiency on production.
5
Political Economy and Taxation”. Curiously, David Ricardo used trade flows between Portugal
and England as an example to demonstrate his idea. Comparative advantage occurs when one country can produce a good or service at a lower opportunity cost than another. This principle stimulated many researchers to investigate the trade patterns of a country and it is the base for this research. Hence, the aim of this study is to identify the pattern of Portugal’s comparative advantage that is defined by empirical evidence, related with the international transactions and its various determinants, as physical capital and labour.
This study is mostly empirical. However, behind all the econometric analysis, there is a strong theoretical component that supports the hypothesis and the models that provide the conclusions about the comparative advantages of Portugal in the international trade. Dynamic panel data, which embraces time-series and cross-section components, was used. The data comprises the period 1995-2014 and all the variables are disaggregated in 12 different economic activities. Firstly, one started with the simple Heckscher-Ohlin-Samuelson Model that uses as determinants of the Net Exports the stock of Capital and Labour. Afterwards, one introduced different variables, such as economies of scale andtechnology proxies, to incorporate new and modern theories of international trade.
6
II.
Literature Review
During the second half of the XX century, with the external trade proving to be a central component of Portugal’s convergence process towards the most developed European countries, many researchers began to investigate the patterns and determinants of Portuguese trade. The pattern and determinants of Portugal’s net exports across the period 1972-79 were studied by Courakis and Roque (1984) who later (1992) extended the investigation into the pattern and determinants of Portugal’s trade in manufactured goods across the period 1972-85. In the first study, the authors started by using an econometric model based on the Heckscher-Ohlin-Samuelson (HOS) model of international trade that suggests the existence of two factors, physical capital and labour, and not only one factor, as in the simple Ricardian model (Feenstra, 2002). The main difference between the Ricardian model and the HOS one, is that the latter “dispenses with the notion of technological differences and instead show how factor
7
al, 1989). The technology influences were proxied by the eight average ratio of skilled labour, expressed in percentage terms, and the results exhibit comparative advantage in products of industries that display high levels of this proxy.
8
to adapt to new technologies from the capacity to create them. Hence, they created a proxy to the capacity to innovate that represents the percentage of scientists and engineers from the USA and they concluded that this differentiation between capacity to adapt and to create is important to explain the determinants of the trade patterns. Between 1973 and 1982, Portugal was a follower in terms of technology and the Portuguese economic activities more technologically advanced were increasingly capable to adapt than the ones less sophisticated. Thus, it was normal that the coefficient related with the capacity to adapt was positive for Portugal.
The econometric approach normally used in this subject is panel data. Conversely, Bento (2004) analyzed the pattern and determinants of Portugal’s trade in manufactured goods across the
period 1971-98 with a time-series approach and he used the FDI as a significant variable to explain the trade patterns, since the FDI inflows were a significant part of the Portuguese GDP following the country’s integration in the European Union (Source: World Bank). The results are different from the ones obtained by Courakis and Roque (1984) because they query the idea of comparative advantage on unskilled labour intensive products. The author shows that in the long-run, the net exports would increase if Portugal specialized in products of industries that are intensive in human capital (skilled labour).
9 III.
Empirical Analysis
A. Model and Econometric Approach
The investigation and conclusions of the Portuguese trade patterns will be based on the Heckscher-Ohlin Theorem, which states that a country with balanced trade will export the commodity that uses intensively its relatively abundant factor and will import the commodity
that uses intensively its relatively scarce factor (Leamer, 1984, p.8).
In general, the empirical work related with this topic starts by testing the simple Heckscher-Ohlin-Samuelson model, which uses physical capital and labour as explanatory variables. The equation (1) translates the idea of the HOS model: the patterns of specialization depend on the endowments of the aforementioned factors of each country. Specifically, a country abundant in labour will tend to export products that use intensively labour in their production. In this sense, the dependent variable of this investigation is the net exports over the gross value added, which is named as XNET. The net exports are the difference between exports (X) and imports (M),
which is the Balance of Trade. In equation (1), regarding the explanatory variables, they are the logarithms of the stock of capital and of the quantity of labour, denoted by LNK and LNL,
respectively. The application of logarithm transformation is explained later.
𝑋𝑁𝐸𝑇𝑖,𝑡 = 𝛼0+ 𝛼1𝑋𝑁𝐸𝑇𝑖,𝑡−1+𝛼2LN𝐾𝑖,𝑡+ 𝛼3𝐿𝑁𝐿𝑖,𝑡+ 𝜀𝑖,𝑡 (1) Where 𝑖 = 𝐴, B, 𝐶, 𝐷, … and represents the 12 different economic activities, 𝑡 = 1995, … , 2014 and 𝜀𝑖,𝑡 denotes the error term.
The variable 𝑋𝑁𝐸𝑇𝑖,𝑡−1 represents the net exports (in percentage of the Gross Value Added) of
the previous period and it is a consequence of the estimation by dynamic panel data. This term is part of all the equations and is clarified at the end of this sub-section.
10
between countries, in the sense that these models only reflect the trade of products from different industries. Currently, the volume of trade from intra-industry is growing, which brings the need about the formulation of new models that incorporate the reality of the world. As Roque et al. presented in their research (1989), there are different trade theories, as the factorial and the technological ones, which are extensions of the HOS model. The neo-factorial models, presented in Waehrer (1964) and Stern (1976) and Branson and Monoyios (1977), emphasize the relevance of labour quality composition (Courakis et al., 1989). The main point that distinguishes these models is the treatment of the non-homogeneity of labour force: while Waehrer introduces in his theory two different categories of labour – unskilled and skilled – Stern and Monoyios use the variable “Human Capital” as a stock, keeping the physical capital and labour as explanatory variables. For the purpose of this investigation, it was adopted the decomposition of labour in two different categories: unskilled labour (USL) and skilled labour (SL). A natural logarithmic transformation was applied to the two previous variables, unskilled
and skilled labour, which resulted in the variables LNUSL and LNSL. The logarithmic
transformations of the two types of labour were used as additional explanatory variables, as it is presented in equation (2):
𝑋𝑁𝐸𝑇𝑖,𝑡 = 𝛼0+𝛼1𝑋𝑁𝐸𝑇𝑖,𝑡−1+ 𝛼2𝐿𝑁𝐾𝑖,𝑡+ 𝛼3𝐿𝑁𝑈𝑆𝐿𝑖,𝑡+ 𝛼4𝐿𝑁𝑆𝐿𝑖,𝑡 + 𝜀𝑖,𝑡 (2)
With the decomposition of the labour, one intend to verify whether the labour quality continues to be a fundamental component to explain the trade patterns, as it was in previous investigations. On the other hand, the neo-technological models reflect differences in the technological level. Technology is not free and the capacity to create new products, lower cost production techniques or to adapt to innovative techniques is different across countries. In this line, it was created one proxy for technology denominated by INOV. The explanatory variable used is the
11
𝑋𝑁𝐸𝑇𝑖,𝑡 = 𝛼0+ 𝛼1𝑋𝑁𝐸𝑇𝑖,𝑡−1+ 𝛼2𝐿𝑁𝐾𝑖,𝑡+ 𝛼3𝐿𝑁𝑈𝑆𝐿𝑖,𝑡 + 𝛼4𝐿𝑁𝑆𝐿𝑖,𝑡+ 𝛼5𝐿𝑁𝐼𝑁𝑂𝑉𝑖,𝑡+ 𝜀𝑖,𝑡
(3)
Finally, the last variable introduced to explain the dependent variable XNET was the natural
logarithm of the proxy for the economies of scale (LNES). This variable appears also in the
neo-technological models and tries to explain some neo-technological gaps across the countries. Hence, the equation (4) embodies all the previously mentioned explanatory variables, except the LNL.
𝑋𝑁𝐸𝑇𝑖,𝑡 = 𝛼0+ 𝛼1𝑋𝑁𝐸𝑇𝑖,𝑡−1+ 𝛼2𝐿𝑁𝐾𝑖,𝑡+
𝛼3𝐿𝑁𝑈𝑆𝐿𝑖,𝑡+𝛼4𝐿𝑁𝑆𝐿𝑖,𝑡+ 𝛼5𝐿𝑁𝐼𝑁𝑂𝑉𝑖,𝑡+ 𝛼6𝐿𝑁𝐸𝑆𝑖,𝑡+ 𝜀𝑖,𝑡 (4)
One of the goals of this research is to test as many different models as possible, considering new modern theories, in order to better understand the Portuguese trade patterns. Thus, based on the HOS model, one started to estimate the equation that uses as dependent variables the logarithms of the stock of capital and quantity of labour, and gradually introducing new independent variables, following the previously mentioned process.
Finally, it is relevant to clarify the use of the logarithms of some variables instead their actual values. Regularly, there are some data that present a very skewed distribution which may lead to poor and misleading results from the regression. Having said so, it is important to run a Normality Test for all the explanatory variables, except for the lag of the dependent variable, since it derives from the econometric method of estimation. From the results of the tests displayed in table 4 [of the Appendix], one can conclude that all the variables are not normally distributed, because the null hypothesis of Normal Distribution is rejected. Hence, in order to reduce the skewness of these variables and to fit them into the model, the natural logarithm was applied, as it was previously described.
12
approach, unlike the static one, incorporates a temporal dependency of the dependent variable, using lags of the dependent variable as a regressor. For instance, the net exports of this year can be explained by the net exports of the previous year. Although the coefficients on the lagged dependent variable might be far from the interest of this work, the introduction of lags becomes crucial to control for the dynamics of the process. Hence, one should not treat the net exports as a static variable that does not relates with its previous behavior. In this investigation, it was decided to introduce one lag of the dependent variable as explanatory variable, which is translated in all equations by the term 𝑋𝑁𝐸𝑇𝑖,𝑡−1. One of the problems regarding the dynamic panel data models is the endogeneity bias of estimates, which results from the inclusion of the lagged dependent variable as explanatory variable. Generally, to surpass this problem, instrumental variables are used. In this project, it was used the Arellano-Bover/Blundell-Bond Generalized method of moments (GMM) estimator1, which improves the efficiency of the
estimations.
One of the objectives of this investigation is to obtain the best model to explain the Portuguese trade patterns and it is crucial to run some robustness tests, which will sustain the veracity and quality of the research and its conclusions. The robustness test is related with the proxy for the economies of scale and the results of the robustness test are presented in Section IV.
B. Data
The dependent variable is the Net Exports in terms of Gross Value Added (XNET), by economic
activity, and it was obtained by the following equation:
𝑋𝑁𝐸𝑇𝑖,𝑡 =𝑋𝐺𝑉𝐴𝑖,𝑡−𝑀𝑖,𝑡𝑖,𝑡 (5)
1 The Arellano–Bover/Blundell–Bond builds a system of two equations—the level equation and the differenced
13
Where GVA represents the Gross Value Added. The dependent variable was created using data
from INE and PORDATA.
The stock of capital in percentage of Gross Value Added, which is represented by K, is one of
the most important data in this investigation and it was not easily obtained. For the period 1995-2005, the Real Fixed Capital Stock (valued at 1995 prices) was available in the EU KLEMS database. The stock of capital, for the period 2006-2014, was computed by the following equation:
𝑆𝑡𝑜𝑐𝑘 𝑜𝑓 𝑐𝑎𝑝𝑖𝑡𝑎𝑙𝑖,𝑝 = 𝑆𝑡𝑜𝑐𝑘 𝑜𝑓 𝑐𝑎𝑝𝑖𝑡𝑎𝑙𝑖,𝑝−1+ 𝑁𝑒𝑡 𝐶𝑎𝑝𝑖𝑡𝑎𝑙 𝐹𝑜𝑟𝑚𝑎𝑡𝑖𝑜𝑛2𝑖,𝑝 (6)
Where 𝑝 = 2006, … ,2014.
Other relevant data for this project is the quantity of labour (L) and its decomposition into two
categories, unskilled (USL) and skilled (SL) labour. From the basic HOS model, labour is
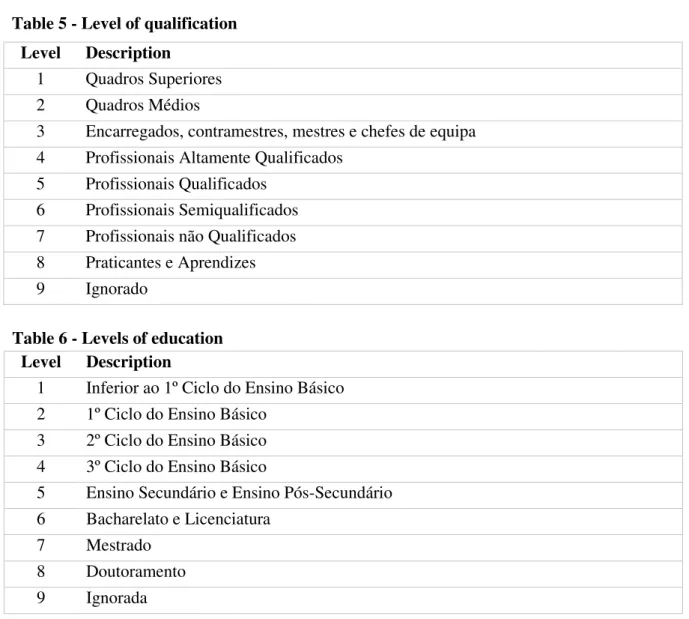
introduced with no quality differentiation. Nevertheless, the increasing education and qualification of people brings about the need to differentiate the labour quality. To access the quantity of labour and to construct indicators for unskilled and skilled labour, it was used the “Number of employees, by economic activity, by the level of qualification” (source: Gabinete de Estudos e Planeamento). As it was mentioned previously, the labour was divided in two
categories: unskilled and skilled labour. The data from GEP is divided in levels of education, where level 1 (“Quadros Superiores”) is the most qualified labour. To create the variable unskilled labour (USL), it was used the number of employees with a level of qualification equal
or lower to “Profissionais semi-qualificados”. The skilled labour (SL) is composed by the
employees with a level of qualification equal or higher than “Profissionais qualificados”. Nowadays, the technological component and the capacity to innovate and to adapt is a fundamental part of the companies, because the market is in constant change and the companies
14
should follow the market trends. Generally, more knowledge leads to new production techniques and procedures. The knowledge is not free and there are differences across countries, in the same industry. These differences can be translated by an indicator that represents the percentage of employees with high educational degree. Hence, to produce the proxy for the technology component (INOV), it was considered the employees with a Bachelor, Master's
degree and PhD as the ones with high educational level.
As mentioned previously, it is important to measure the intra-industry trade and, for that purpose, it was created the variable Economies of scale (ES) by using the data “Number of
companies, by economic activity, by dimension of the company” (source: GEP). The indicator Economies of scale was obtained by the following formula:
𝐸𝑆𝑖,𝑡 =𝑁𝑛𝑖,𝑡𝑖,𝑡 (7)
Where 𝑛𝑖,𝑡 represents the number of companies of the economic activity i, in year t, with 503 or
more employees, whereas 𝑁𝑖,𝑡 represents the total companies of the economic activity i, in year t. The idea is that lower values indicate the absence of economies of scale, because they suggest
a high number of small companies. This construction is supported by the Herfindahl-Hirschmann Index, which is a measure of market concentration. To support the veracity and accuracy of the results, it was performed a robustness test for the variable economies of scale, which implies the construction of a new proxy. This proxy, which is called ESS, shows the
percentage of companies with a business volume higher than 10 000 000 euros, in each economic activity. The equation (8) uses all the explanatory variables presented in equation (4), except the logarithm of the proxy of the economies of scale (LNES). Instead it is used the natural
logarithm of the new proxy, which is named by LNESS. The estimation and the results from
this robustness test are also presented in section IV.
3 Other authors use 100 or more employees, but the disaggregation of the data only allow to create this indicator
15
𝑋𝑁𝐸𝑇𝑖,𝑡 = 𝛼0+𝛼1𝑋𝑁𝐸𝑇𝑖,𝑡−1+𝛼2𝐿𝑁𝐾𝑖,𝑡+ 𝛼3𝐿𝑁𝑈𝑆𝐿𝑖,𝑡+
𝛼4𝐿𝑁𝑆𝐿𝑖,𝑡+ 𝛼5𝐿𝑁𝐼𝑁𝑂𝑉𝑖,𝑡+ 𝛼6𝐿𝑁𝐸𝑆𝑆𝑖,𝑡+ 𝜀𝑖,𝑡 (8)
The data sample used comprises 12 economic activities (see table 3 in Appendix) for each of the 20 years across the period 1995-2014. The sample period was not larger because the division of the economic activities is not standardized across the time and this could lead to inconsistent results. Some aggregations of the economic activities were necessary in order to obtain a list of activities that is easy to work but without losing essential information. All the arrangements and transformations were always supported by the “Classificação Portuguesa das Actividades
Económicas (CAE)”.
IV.
Estimation and Results
A. Benchmark Results
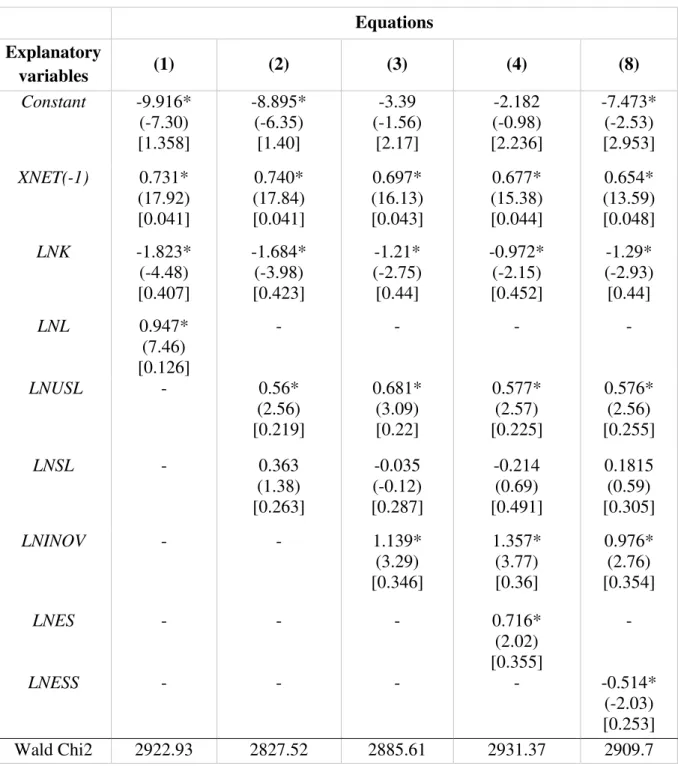
In this section, the econometric estimation was conducted, in order to find out the determinants of the Portuguese trade patterns. The econometric approach used is dynamic panel data. In table 1, the results from the estimation procedure described in section III are presented. From these results, it is possible to analyze the significance of the variables, to take some considerations regarding the determinants of the Portuguese trade patterns and to compare them with other studies.
16
The neo-factorial models introduce differentiation of the labour quality and these models show that the treatment of all labour as homogeneous can lead to wrong conclusions. Hence, it was tested the significance of the two categories of labour, unskilled and skilled. The first conclusion is that Portugal should specialize in products from economic activities that use intensively unskilled labour in their productions. This conclusion was already verified by different authors as Courakis et al. (1984) and Roque et al. (1989). Regarding the skilled labour, the level of skilled labour has a neutral impact in the net exports, because the coefficient is not statistically significant. Nevertheless, the decomposition of the labour was relevant to take more precise conclusions regarding the skilled labour. The comparative disadvantage in products relatively intensive in capital is confirmed by the regression of equation (2).
Equation (3) introduces the variable that represents the technological component. Focusing on the significance of the variables, one finds that all of them are statistically significant, except for the variable representing the skilled labour. Once again, the variable that represents the skilled labour is not statistically significant, which confirms the neutrality of this variable in the Portuguese trade patterns. This neutrality was not verified in previous investigations made by Courakis and Roque in 1984 and 1989. The authors showed that Portugal had a comparative disadvantage in products from industries that use intensively skilled labour in their productions for the years before 1995. Hence, this is a significant change in the determinants of the Portuguese trade patterns. The comparative disadvantage in products intensive in capital continues to be a strong conclusion. Regarding the technology proxy, it is verified that there is a comparative advantage in products of economic activities that use a high proportion of employees with a Bachelor, Master’s degree and/or PhD. Besides the gap when compared with other developed countries, since 1986, Portugal exhibits an evolution regarding human and financial resources allocated to scientific research and “the fast scientific and technological
17
Thus, it is not so surprising that the technology level of each economic activity influences positively the net exports.
Finally, in order to analyze the effect of the proxy for the market concentration, equation (4) was regressed. The previous conclusions, taken from the results of equation (3), prevail. Focusing on the new explanatory variable, the result is different from the mainstream literature.
Table 1 – Estimation results
Equations Explanatory
variables (1) (2) (3) (4) (8)
Constant -9.916*
(-7.30) [1.358] -8.895* (-6.35) [1.40] -3.39 (-1.56) [2.17] -2.182 (-0.98) [2.236] -7.473* (-2.53) [2.953]
XNET(-1) 0.731*
(17.92) [0.041] 0.740* (17.84) [0.041] 0.697* (16.13) [0.043] 0.677* (15.38) [0.044] 0.654* (13.59) [0.048]
LNK -1.823*
(-4.48) [0.407] -1.684* (-3.98) [0.423] -1.21* (-2.75) [0.44] -0.972* (-2.15) [0.452] -1.29* (-2.93) [0.44]
LNL 0.947*
(7.46) [0.126]
- - - -
LNUSL - 0.56*
(2.56) [0.219] 0.681* (3.09) [0.22] 0.577* (2.57) [0.225] 0.576* (2.56) [0.255]
LNSL - 0.363
(1.38) [0.263] -0.035 (-0.12) [0.287] -0.214 (0.69) [0.491] 0.1815 (0.59) [0.305]
LNINOV - - 1.139*
(3.29) [0.346] 1.357* (3.77) [0.36] 0.976* (2.76) [0.354]
LNES - - - 0.716*
(2.02) [0.355]
-
LNESS - - - - -0.514*
(-2.03) [0.253]
Wald Chi2 2922.93 2827.52 2885.61 2931.37 2909.7
18
For previous periods, it was shown that Portugal had comparative disadvantage in products from industries with a low level of market concentration. In this work, one can conclude that Portugal has a comparative advantage in products from industries that reveal high level of market concentration. Moreover, the coefficient is statistically significant at a 1% significance level. According to Courakis et al (1989, p. 560), “it is envisaged that “large” countries will tend to display comparative advantage in industries with significant economies of scale”.
Hence, it is important to run a robustness test, in order to clarify the impact of the market concentration in the Portuguese trade patterns.
B. Robustness Test
The robustness test provides veracity and strength to the results of this investigation. The robustness test run in this section is related with the proxy for the economies of scale. From the results in equation (4), the proxy for the economies of scale is significant at a 1% significance level. In other investigations, the common result is that Portugal has a comparative disadvantage in products from economic activities that benefits from high level of economies of scale. Hence, it was constructed another proxy for the economies of scale named ESS, which represents the
percentage of companies with a business volume higher than 10 000 000 euros. In the results of the equation (8), the new proxy for economies of scale is statistically significant at a 1% significance level and the conclusion is that Portugal has a comparative advantage in products of economic activities that does not benefit from high market concentration, which accords with other available background4 for different periods of time. Hence, the relation between the level
of economies of scale and the net export is ambiguous. However, from the first proxy, which is the most similar to the ones used is previous works, one can state that there was a structural change in the determinants of the Portuguese trade patterns.
19
V.
Conclusions
20
and with high levels of the technology proxy. On the other hand, Portugal showed comparative disadvantages in products relative intensive in physical capital, skilled labour and in products from economic activities that show high market concentration.
This topic is a major area for future research because Portugal is a country with strong international relations and the conclusion of these type of investigations can be a useful tool for the economic authorities to take some advice related with international trade and investment policies. However, the number of works related with this subject is relatively low given the difficulty to obtain the required data. The main setback of this investigation was the search for the data, since not all the data is published on the current databases. The results could be more accurate and correct if the data was homogeneous and without gaps. The stock of capital is an estimation and might not correspond to the real values, which is a source of noise. On the other hand, the different division of the economic activities across the periods bring about the need to transform the data and this is another source of risk and noise.
21
References
[1].Afonso, Óscar and Aguiar, Álvaro. 2004. “Comércio externo e crescimento da economia portuguesa no século XX”. Working Paper No.146. Faculdade de Economia. Universidade do Porto.
[2]. Amador, João and Cabral, Sónia and Maria, José R. 2007. “Export specialization over the last four decades: how does Portugal compare with other cohesion countries?”. Economic Boletim. Banco de Portugal.
[3]. Arellano, M. 2003. Panel Data Econometrics. Oxford University Press.
[4]. Banco de Portugal. 2004. “Os fluxos de investimento directo estrangeiro”. Relatório Anual de 2003. Lisboa. pp. 186-189.
[5]. Bento, João P. 2004. “Analysing the pattern and determinants of Portugal’s trade in manufactured goods: a time-series approach (1971-98)”. The University of Reading. Nottigham. United Kingdom.
[6]. Caliendo, Lorenzo and Feenstra, Robert C. and Romalis, John and Taylor, Alan M. 2015. “Tariff reductions, entry, and welfare: theory and evidence for the last two decades”. working paper nº 21768. National Bureau of Economic Research. Cambridge.
[7]. Courakis, A. and Roque, F. M. 1984. “An inquiry into the Determinants of the Net Exports Pattern of Portugal’s Trade in Manufactures”. Economia. vol.6. No.2. Maio. pp. 299-331.
[8]. Courakis, A. and Roque, F. M. 1989. “Supply Determinants in the Pattern and Evolution of Portugal’s Trade in Manufactures”. em A. Sousa et al.. Nova Economia em Portugal. Estudos em Homenagem a António Manuel Pinto Barbosa. Faculdade de Economia da Universidade Nova de Lisboa. pp. 559-574.
[9]. Courakis, A. and Roque, F. M. and Fontoura, Paula. 1990. “The Impact of Protection on the Evolution of the Portuguese Pattern of Trade: 1974-86”. Working Paper nº 162. [10]. Courakis, A., Roque, F. M. 1992. “Comparative advantage and structural change in the
22
[11]. Engblom, Janne and Oikarinen, Elias. 2015. ”Using Arellano-Bover/Blundell-Bond Estimator in Dynamic Panel Data Analysis – Case of Finnish Housing Price Dynamics”. International Journal of Mathematical and Computational Sciences. Vol.2. No.8. World Academy of Science, Engineering and Technology.
[12]. Feenstra, Robert C. 2002. Advanced International Trade: Theory and Evidence.
National Bureau of Economic Research. University of California.
[13]. Instituto Nacional de Estatística. 2007. “Classificação Portuguesa das Actividades Económicas Rev.3”.
[14]. Leamer, E. E. 1984. Sources of international comparative advantage: Theory and evidence. MIT press Cambridge.
[15]. Mateus, Augusto. 1992. “A economia portuguesa depois da adesão às Comunidades Europeias: transformações e desafios”. Análise Social. vol. XXVIII (118-119). pp. 655-671.
[16]. Neves, Pedro D. and Belo, Frederico. 2002. “Evolução cíclica da economia portuguesa no período de 1910 a 1958: uma breve análise”. Boletim económico. Banco de Portugal. [17]. Roque, F. M. 1983. “Trade Theory and the Portuguese Pattern of Trade”. Economia.
vol. 7. No.3. Outubro. pp. 455-470
[18]. Roque, F. M. and Fontoura, Paula and Barros, Pedro P. 1989. “Teorias do Comércio Internacional e Padrão de Especialização da Indústria Transformadora Portuguesa”. Working Paper Nº 136.
[19]. Silva, Joaquim R. “A economia portuguesa e o investimento directo estrangeiro”. Instituto Superior de Economia e Gestão. Universidade Técnica de Lisboa.
[20]. Smith, Ron P. and Fuertes, Ana-Maria. 2016. “Panel Time-Series”. Department of Economics Mathematics and Statistics. Birkbeck University of London.
23
Appendix
Figure 2 - Foreign Direct Investment, net inflows (% GDP) from 1970 until 2014
Source: World Bank national accounts 0.00%
20.00% 40.00% 60.00% 80.00% 100.00% 120.00%
Trade (% GDP)
Portugal European Union United Kingdom Spain
France Denmark Sweden Italy
Figure 1 - Trade (% of GDP)
Source: World Bank national accounts and OECD National Accounts
-2.00% 0.00% 2.00% 4.00% 6.00% 8.00% 10.00% 12.00%
FDI - net inflows (% GDP)
24
Table 2 - Definition, sources and characteristics of the data set
Variable Description Source
XNET Net exports (% of Gross Value Added) INE, Pordata
K Stock of capital (% of Gross Value Added) OECD, EU KLEMS, Pordata, INE
L Quantity of labour GEP5
USL Unskilled labour GEP
SL Skilled labour GEP
ES Economies of Scale proxy GEP
INOV Technology proxy GEP
ESS Economies of Scale proxy (variable used for the
robustness test) GEP
LNK Natural logarithm of the Stock of capital (% of Gross Value Added
LNL Natural logarithm of the quantity of labour
LNUSL Natural logarithm of the unskilled labour
LNSL Natural logarithm of the skilled labour
LNES Natural logarithm of the economies of scale proxy
LNINOV Natural logarithm of the technology proxy
LNESS Natural logarithm of the economies of scale proxy (used in
the robustness test)
Table 3 - Economic activities aggregation
A Agriculture, farming of animals, hunting, forestry; Fishing B Mining and quarrying
C Manufacturing
D Production and distribution of electricity, gas and water; Water supply; sewerage, waste
management and remediation activities E Construction
F Wholesale and retail trade; repair of motor vehicles, motorcycles and personal and
household goods G Hotels and restaurants
H Transport, storage and communication I Financial activities
J Real estate, renting and business activities
K Public administration and defense; compulsory social security; Education
L
Health and social work; Other community, social and personal service activities; Activities of Households as employers of domestic staff and production activities of households for own use; International organizations and other extra-territorial institutions
25 Table 4 - Skewness/Kurtosis tests for Normality
H0: The variable has a normal distribution
Variable Adj chi2 Prob>chi2
K - 0.0000
L 39.94 0.0000
USL 68.20 0.0000
SL 19.96 0.0001
INOV 47.06 0.0000
ES 61.29 0.0000
ESS - 0.0000
Table 6 - Levels of education
Level Description
1 Inferior ao 1º Ciclo do Ensino Básico
2 1º Ciclo do Ensino Básico
3 2º Ciclo do Ensino Básico
4 3º Ciclo do Ensino Básico
5 Ensino Secundário e Ensino Pós-Secundário
6 Bacharelato e Licenciatura
7 Mestrado
8 Doutoramento
9 Ignorada
Table 5 - Level of qualification
Level Description
1 Quadros Superiores
2 Quadros Médios
3 Encarregados, contramestres, mestres e chefes de equipa
4 Profissionais Altamente Qualificados
5 Profissionais Qualificados
6 Profissionais Semiqualificados
7 Profissionais não Qualificados
8 Praticantes e Aprendizes