acta
ELSEVIER Thermochimica Acta 296 (1997) 141-148
Thermal behaviour and isothermal kinetics of rhodium(II) acetate
a *
M.M. Braga ' , M.I. Yoshida a, R.D. Sinisterra a, C.F. Carvaiho b
~ Departamento de Qu[mica, Universidade Federal de Minas Gerais, Caixa Postal 702, 31270-901, Belo Horizonte, MG, Brazil b Departamento de Qu[mica, Universidade Federal de Ouro Preto, Ouro Preto, MG, Brazil
Received 3 December 1995; received in revised form 12 April 1996; accepted 10 December 1996
Abstract
The thermal decomposition of solid rhodium(II) acetate was studied by isothermal TG. Kinetic analysis of the isothermal data showed that the complex decomposition in the range 198.0-210.5°C occurs according to a Prout-Tompkins (An) law. The isothermal curves are better fitted using a non-linear least square method. The activation energy found was 16:2.7 kJ tool ~. At temperatures higher than 210.5°C the decomposition is strongly accelerated and no kinetic study was available.
Keywords: Isothermal; Kinetics; Mechanism; Rhodium(II) carboxylates; Solid State; Thermal decomposition
1. Introduction 210.5°C, the formation of RhO2 was observed accord-
ing to a rate equation compatible with the branching The discovery of antitumor activity of rhodium(II) chain nucleation model of Prout-Tompkins [10]. On carboxylates in 1972 [1,2] opened up a variety of the other hand, at temperatures higher than 210.5°C, interesting areas of research with these kind of com- the final product of decomposition is Rh203, and pounds. Several studies of thermal decomposition because of the higher rate of this process, it was have been reported in the literature [3-9], but kinetic not possible to carry out kinetic studies with this decomposition studies of rhodium(II) tetracarboxy- technique.
lates have not been reported. The thermal behaviour of rhodium(II) acetate, Rh2(Ac)4, can be described as
follows: the first stage of decomposition occurs at 2. Experimental temperatures above 200.0°C, producing Rh(0); in the
second stage, there is oxidation of Rh (0) to Rh203 Rh2(Ac)4 was synthesised as described by Rempel
[4,8]. et al. [11]. The compound was ground to pass 100
In the present work, the thermal behaviour and mesh. Thermal decomposition experiments were mea- kinetics of the decomposition of Rh2(Ac)4 has been sured on a TG-50 Mettler TA-4000 system, using studied. It was observed that the isothermal decom- dynamic air atmosphere; 7.0 mg samples packed in position process is drastically influenced by the tem- alumina crucible of 70 lal were used. The samples perature. For temperatures between 198.0°C and were weighed at 105.0°C, in order to eliminate humid- ity or solvents. The isothermal curves were reported at
*Corresponding author, temperatures between 198.0°C and 251.0°C.
0040-6031/97/$17.00 © 1997 Elsevier Science B.V. All rights reserved
142 M.M. Braga et al./Thermochimica Acta 296 (1997) 141-148
(a)
(b)
=~ 60 =~ 6 0
el 40 e~ 40
o
°
f
'
=-
•
~ 20 + = 20
o ~
' 3 ~ _ m
0 100 200 300 400 0 100 200 300 400
Time in rain Time in rain
( c ) ( d )
60 =.~ 60
tg *¢ 40
= 40 ~ ~ . . . .
_o
J ,
" ' ~" 20
,.C
. ~ 20 I~
0 50 1 O0 150 200 250 0 50 1 O0 150 200 250
Time in min Time in min
(e) (f)
6 0 ~ ~ 6 o
40
(n 40 o ~ -
-_o _
"~ 20 "~ 20
._= .~
~ o ', - ~ - . . . . ~ ~ o ,
0 50 100 150 200 250 0 50 100 150 200
Time in rain Time in rain
(g)
(h)
6o ~ 80
m 40
¢n 4 0 ~ O
"= 20 20 ~-
._m "3
• ; ~ 0 p I t
~= 0~
' , ,0 50 1 O0 150 0 50 100 150
T i m e i n r a i n T i m e i n r a i n
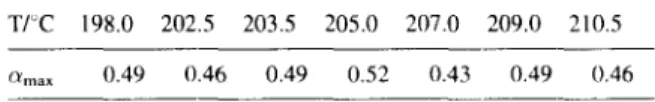
The IR spectra were measured in a Perkin-Elmer Table 1
model 283B spectrophotometer, using CsI dispersion Values o f ama~ for the thermal d e c o m p o s i t i o n o f Rh2(Ac)4 mulls. Elemental analyses were on a Perkin-Elmer T/°C 198.0 202.5 203.5 205.0 207.0 209.0 210.5 2400 CHN. The wide Angle X-Ray Diffraction (XRD)
(Y . . . 0.49 {).46 0.49 0.52 0.43 0.49 0.46
patterns were obtained using a Rigaku instrument with Cukc~ radiation, 30 mA and 40 kV, and a scanning rate
of 4 ~: rain t. The isothermal curves of ct versus t show a sigmoi-
dal form, characteristic of an autocatalytic process. The values obtained for amax, (C~ for maximum &~/dt)
3. Results a n d discussion are listed in Table 1. These results seems to suggest
that CXmax is temperature independent, implying that The XRD pattern of the residue obtained after perhaps the same kinetic model describes the beha- heating the sample at 300°C showed that Rh(0) was viour of all curves. The average value of c~ ... 0.48-+- formed. The weight loss observedin the TG curve was 0.03, suggests a kinetic model where the rate of also consistent with Rh(0). Between 300 and 600°C, a decomposition is a maximum when (t:=0.50.
gain of mass was observed. The final product at 900°C In accordance with a kinetic model earlier described was characterised by XRD and IR and the results [13,14], the present study can be interpreted as follows suggested the formation of Rh203, as reported in (model B):
literature [121, but the gain of mass (experimental <
= 17%; expected = 2 3 % ) indicated that oxidation was A(s) -~ B + C(g) + ... (2) not complete.
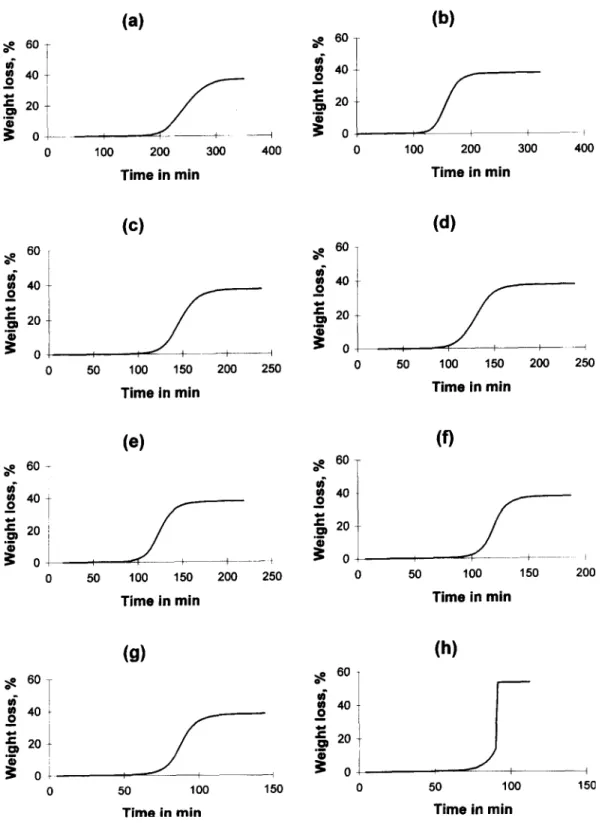
Fig. 1 shows the TG curves measured under iso- A(s) + B ~ 2B + C ( g ) + . . . (3) thermal conditions for temperatures between 198.0°C
where k2 >> k~. and 212.0 'C. The results show the following:
This model leads to the equation:
1. an induction period of 60-100 min; [1 e x p ( - & ) l
2. the final product had approximately 62% of the st = (4)
starting mass, independently of the temperature. [1 + (k2Ao/kl)exp(-&)]
The residue displayed thermal stability when heat- where 6=kl+k2Ao and Ao= number of moles of
ing was maintained for 3 h. undecomposed A when t=0. It can be shown that in
The weight of this residue is compatible with the this case:
lbrmation of RhO2 (experimental: 62.2~0.2%, calcu- kj
~ m a x = 0 . 5 - - - - ~, 0 . 5 ( 5 )
lated: 61.1%). The residue was also characterised by 2k2Ao
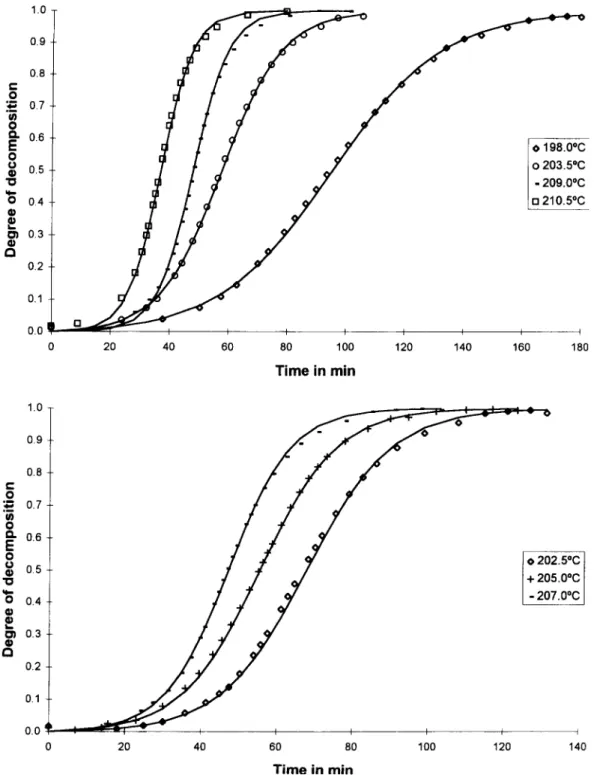
XRD pattern, IR and CHN analysis. The CHN results In all the temperatures studied, Eq. (4) fits quite showed that there was no hydrogen in the sample and well the experimental data, as shown ill Fig. 2, where that the percentage of carbon was always less than 1%. the theoretical curves are represented by the solid line The IR spectrum presented only a large peak at and the point corresponds to the experimental data. To 550 cm ~, in accordance with the oxide formation, fit those curves we use the following relation: The XRD patterns was interpreted as amorphous
material as suggested by the IR spectra at low fre- t = rex p t 0 ( 6 )
quencies, where tex p is the real time of heating, and to is the value
The decomposition fractions, ct, were determined of texp when Idm/dt] > 2.10 -5 mg s t. For all the
by: temperatures studied, the c~ value at to, % , was found
mi -- mt to be close to 0,005. As the value of ~o is different
~ - -m i - - m ~ - (1) from zero, the experimental data were compared to the
ct value defined by: where mi = initial mass, m t = mass in the time t and
144 M.M. Braga et al./Thermochimica Acta 296 (1997) 141-148
~,~ 0.7
~" 0 198.00C
8
0.5 o 203.5°CI f l
_1"
0.3
Q
0 20 40 60 80 100 120 140 160 180
Time in rain
1.0
0.9
0.8 e'- O :~ 0.7
&
i 0.6
0 202.5*C 0.5
"10 + 205.0°C
- 207.0°C
0 0.4
~ .3
0.2
0.1
0.0 I -i i I I i I J
0 20 40 60 80 100 120 140
Time in min
Table 2
Parameters obtained after the fit of experimental o curves versus t, in accordance with model B.
Temperature/C kl X 106/S I keAoxlO3/s I /k~
198.0 5.83 0.87 0.90
202.5 3.50 1.48 1.14
203.5 6.17 1.60 0.84
205.0 7.00 1.63 0.29
207.1) 6.83 2.00 0.98
209.0 1.00 2.75 1.05
210.5 3.67 3.02 0.89
Table 3
Linear correlation coefficients, r, and % to fit Eq. (8). Model
T e m p / C A 3 An Ax
r A % r A% r A %
198,0 0,9959 2.1 0. 9982 1.3 0.9845 3.9
202.5 0,9856 3.7 0.9912 2.7 I).9971 2.4
203.5 0.9825 4.3 0.9953 2.0 11.9850 4.1)
205.0 0.9803 4.9 0.9944 2.3 0.9614 6.2
207.0 0.9822 4.2 0.9945 2.5 0.9937 2.7
209.1) 0.9747 5.9 0.9939 3.5 0.9901 3.7
210.5 0.9837 4.9 0.9950 3,0 0.9289 9. I
The values of k l,k2, Ao and A% obtained from the by nuclear growing in three dimensions with the
fits are listed in Table 2, where A% is: overlapping of growth nuclei.
A general equation for the three models can be
~ f ~ written as:
A% = x 100 (8)
F ( ~ ) = kt + ko (9)
where N is the number of experimental points, where t is given by Eq. (6). Using Eq. (7), the F(~)
Table 2 shows that although the A% values indicate values, for these three models were treated by a linear
average standard deviations around 1%, the values of regression program. The linear correlation coefficients
k~ change in a random way with the temperature. (r) and the corresponding values obtained for A% are
Hence, it seems that the model described by Eq. (4) shown in Table 3. Although the model An shows r
is not appropriate to the present result, and so another values higher than 0.9900 for all teraperatures and,
model has to be investigated, with the exception of 202.5' C, the r values obtained
Three of the models frequently used in solid decom- with this model are better than those calculated lor the
position studies present C~max =0.50 [15]. They are the other two models, it doesn't reproduce quite well the
Prout-Tompkins model (An), the Prout-Tompkins experimental curves. The A% values for this model
modified model (Ax)and the Avrami-Erofeev model are quite higher than the A% values obtained by
with m =3(A3). The first two models correspond to model B. Consequently, the ~ versus t curves calcu-
nucleation process in branching chains with nuclear lated do not reproduce quite well the experimental
growth in one or two dimensions and with overlapping data. Besides, the k values cannot be described by the
of growth nuclei. The third model describes the ran- Arrhenius law (the linear correlation coefficient
Degree of decomposition
Degree of decomposition
0 P 0 0 0 Q 0 o o o ~ Q o p o o o o o o o
~r~" o I I I I I I [ - b I i
. ~ o F I ~ I I I I I - - P
~ N o
§
a
Table 4
Values of k, ko and A% obtained in the fit of Eq. (10) of the experimental data
Temperature/'C k x 103is i -ko A%
198.0 0.90 5.18 1.09
202.5 1.45 5.93 1.08
203.5 1.62 5.60 0.93
205.0 1.65 5.50 0.35
207.0 2.00 5.64 I. 10
209.1) 2.72 7.83 1.05
210.5 3.08 6.85 0.99
We attempted to obtain theoretical curves closer to peratures. For example, c~ varies from around 0.20 to the experimental results with a non-linear fit. In fact, in about 0.80 in < 1 min.
this case the linear regression method is an indirect fit, because instead of comparing the values of C~exp and
~caJculated, it compares the corresponding F(c0 4. Conclusions values.The c~ values in An equation are given by:
The thermal behaviour of Rh2(Ac)4, in air, is mark- ¢~ = (1 + exp -
(kt
+ ko)) -1 (10) edly modified by the temperature, For temperatures till 210.5°C the residue obtained is RhO2, and the process Using Eq. (10), Eq. (7) and Eq. (6) and a nonqinear can be explained by the Prout-Tompkins law, with an least square method we fit the experimental data. The activation energy of 162.7 kJ mol a and pre-exponen- curves obtained are shown in Fig. 3, where the points tial factor of 3.7 × 10¹⁴ S 1. The usual procedure to fit represent the experimental results and the solid line the isothermal curves c~ versus t by linear regression describe the theoretical curves. The k, ko and A% was not adequate. The fit of these curves was values determined are listed in Table 4. improved using a non-linear least square method.The A% values are comparable with those calcu- At temperatures higher than 210.5°C, an increase in lated by model B (average deviation of 1% between mass loss during the thermal decomposition was experimental and calculated results). The rate con- observed, and the final product is Rh(s). The process stants obtained are described by Arrhenius law, in is strongly accelerated at these temperatures and for accordance with the following expression: this reason it was not possible to measure the kinetics
14 / - 1 6 2 . 7 kJ m ° l - l " by thermogravimetric techniques. k / s ' = 3.7 x 10 e x p ~ ~-~ -)
%
(11 )
Acknowledgements
and the linear correlation coefficient for the I n k versus
T - i curve was 0.994. The authors thank PRPq/UFMG, FINEP and CNPq,
At temperatures higher than 210.5°C, the thermal Brazil. behaviour of Rh2(Ac)4 drastically changes, as can be
seen by comparing Fig. 1 (g) and (h). Above 210.5°C,
a fast acceleratory process was observed at the begin-
References
ning of the decomposition, with a loss of mass higher
than the one observed at lower temperatures. The OZma x [1 ] R.G. Hughes, J.L. Bear and A.P. Kimbal, Proc. Am. Assoc.
values (between 0.60 and 0.75) are different from Cancer Res., 13 (1972)120.
those obtained at lower temperatures. As the thermal [21 A. Erck, L. Rainen, J. Whileyman, I. Chang, A.P. Kimbal and J.L. Bear, Proc. Soc. Exp. Biol. Med., 145 (1974) 1278.
decomposition is extremely fast above 210.5°C, it w a s [3] J. Kitchens and J.L. Bear, J. lnorg. Nuc!. Chem., 31 (1969)
148 M.M. Braga et al./Thermochimica Acta 296 (1997) 141-148
[4] J. Kitchens and J.L. Bear, J. Inorg. Nucl. Chem., 32 (1970) [11] G.A. Rempel, E Ledzins, H. Smith and G. Wilkinson, Inorg.
49. Synth., 13 (1972) 90.
[5] J. Kitchens and J.L. Bear, Thermochim, Acta, 1 (1970) 573. [12] L.L. Kochergina, V.V. Formichev, D.I. Konchatov, I.S. [6] G.A. Barclay, R.E Broadbent, J.V. Kingston and G.R. Shaplygin and K.I. Petrov, Russ. J. Inorg. Chem., 25 (1980)
Scollary, Thermochim. Acta, 10 (1974) 73. 354.
[7] V.N. Shafranskir and T.A. Mal'kova, J. Gen. Chem., USSR, [13] J.C. Machado, M.M. Braga, A.M.P.R. da Luz and G. 45 (1975) 1051. Duplatre, J. C. Soc. Faraday Trans. I, 76 (1980) 152. [8] R.A. Howard, A.M. Wynne, J.L. Bear and W.W. Wendlandt, [14] J.C. Machado, M.M. Braga and B.E Rodrigues, Thermochim.
Inorg. Nucl. Chem., 38 (1976) 1015. Acta, 68 (1990) 283.
[9] G. Faraglia, L. Volpini and S. Sitran, Thermochim. Acta, 132 [15] W.L. Brown, D. Dollimore and A.K. Galwey, in C.EH. Tipper (1988) 217. (Ed.), Reactions in the solid state, Comprehensive Chemical [10] EW.M. Jacobs and EC. Tompkins in W.E. Garner (Ed.), Kinetics, Elsevier, Amsterdam (1980).