ISSN 0104-6632 Printed in Brazil
www.abeq.org.br/bjche
Vol. 30, No. 04, pp. 771 - 779, October - December, 2013
Brazilian Journal
of Chemical
Engineering
OXYGEN AIR ENRICHMENT THROUGH
COMPOSITE MEMBRANE: APPLICATION TO
AN AERATED BIOFILM REACTOR
A. C. Cerqueira, R. Nobrega, G. L. Sant’Anna Jr.
*and M. Dezotti
Chemical Engineering Program, COPPE, Universidade Federal do Rio de Janeiro, Phone: + (55) (21) 25375151, P.O. Box 68502, CEP: 21945-970, Rio de Janeiro - RJ, Brazil.
E-mail: [email protected]
(Submitted: July 9, 2012 ; Revised: October 29, 2012 ; Accepted: January 20, 2013)
Abstract - A highly permeable composite hollow-fibre membrane developed for air separation was used in a membrane aerated biofilm reactor (MABR). The composite membrane consisted of a porous support layer covered with a thin dense film, which was responsible for oxygen enrichment of the permeate stream. Besides oxygen enrichment capability, dense membranes overcome major operational problems that occur when using porous membranes for oxygen transfer to biofilms. Air flow rate and oxygen partial pressure inside the fibres were the variables used to adjust the oxygen transfer rate. The membrane aerated biofilm reactor was operated with hydraulic retention times (HRT) ranging from 1 to 4 hours. High organic load removal rates, like 6.5 kg.m-3.d-1, were achieved due to oxygen transfer rates as high as 107 kg.m-3.d-1. High COD removals, with improved oxygen transfer efficiency, indicate that a MABR is a compact alternative to the conventional activated sludge process and that the selected membrane is suitable for further applications.
Keywords:Oxygen transfer; Aeration; MABR; Wastewater treatment; Biofilm.
INTRODUCTION
The growing demand for wastewater treatment encourages the development of alternative processes. Some of the main characteristics required of these alternative processes are a small footprint, ease of operation, low sludge generation and improved effi-ciency. Among the current technologies, the Membrane Bioreactor (MBR) and the Moving Bed Biofilm Reactor (MBBR) are alternatives that combine some of these required characteristics. MBR consists of suspended growth biological treatment coupled with solids separation by membranes, whereas the MBBR consists of active biofilms attached to high specific area media.
Membrane Aerated Biofilm Reactor (MABR) research has been an ongoing process, where biofilms are attached to gas permeable membranes. The oxygen is transferred to the biofilm responsible for
organic matter degradation through the membrane without bubbling, which increases efficiency and makes MABR particularly suitable for treating high oxygen demanding wastewaters. In MABRs the oxy-gen supply can be adequately controlled, contributing to reduce costs, since aeration or oxygen transfer and sludge disposal are considered to be the major costs involved in the operation of wastewater treatment plants (Yoon et al., 2004).
2012). Such studies demonstrate the potential and the versatility of MABR technology for environmental applications.
Most published works have investigated the utili-zation of microporous hollow-fibre modules in mem-brane aerated biofilm reactors operating with pure oxygen being transferred through the pores of hydro-phobic membranes (Brindle et al., 1997; Pankhania et al., 1999; Semmens at al., 2003). Dense membranes overcome the operating problems that occur when using porous membranes, such as low bubble point and oxygen transfer interruption due to wetted pores (Ahmed et al., 2004). Despite these advantages, dense membranes might present high resistance to oxygen transfer. Composite membranes may constitute an interesting alternative, since they can assure high oxygen transfer rates without the drawbacks of porous membranes; however, few works were published reporting the use of this type of membrane (Syron and Casey, 2008; Downing and Nerenberg, 2008a, 2008b). To our knowledge, no previous works combined the study of the gas transfer of this type of membrane (composite, dense, asymmetric and highly permeable to oxygen) with the biological
degradation performance of a membrane aerated biofilm reactor, operated for long periods of time.
The aim of this study was to investigate the oxygen transfer through a particularly highly perme-able hollow-fiber composite membrane, commercial-ized for air separation, as a component of a mem-brane aerated biofilm reactor. Oxygen enrichment of air and oxygen dissolution capacities of the module assembled for this study were evaluated prior to the 160-d period of MABR operation.
MATERIALS AND METHODS
Membrane Modules
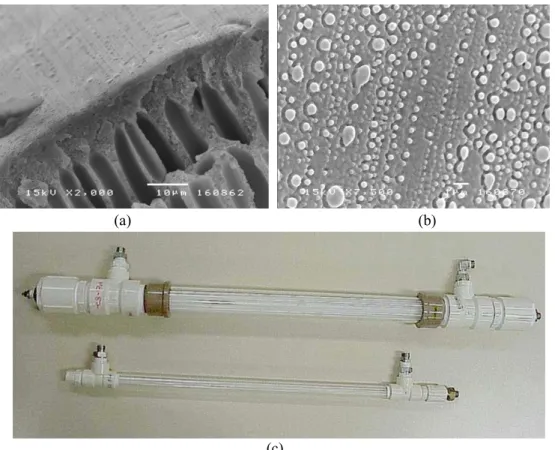
Innovative Membrane Systems (Norwood, MA, USA) supplied the fibers used for nitrogen produc-tion in gas permeators, which were employed in the present work. The thin Teflon surface layer and the polyethersulphone porous support observed in a JEOL JSM 5300 Scanning Electronic Microscope are shown in Figure 1(a), (b). The composite membrane has a hydrophobic characteristic.
(a) (b)
(c)
Figure 1: SEM images of the composite membrane – (a) cross-section, (b) surface and (c)
The MABR modules, whose characteristics are shown in Figure 1(c) and given in Table 1, were constructed from a transparent acrylic glass tube and commercial PVC Tees as shell side ports. The fibers were potted in a PVC male threaded adapter with epoxy resin.
The oxygen transfer through the membrane was investigated by operating the two modules as gas permeators and as gas/liquid contactor, prior to the operation of the bigger module as a bioreactor.
The ideal oxygen/nitrogen separation factor was determined in order to check the dense layer integrity. Pure oxygen and nitrogen permeabilities were as-sessed by plugging the inlet shell side and the outlet fiber side ports of the modules. The fibers were pressurized with pure gases and the permeated flowrate was measured through the shell side outlet port.
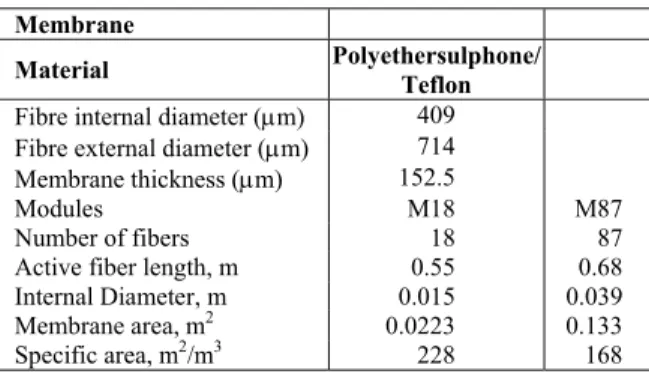
Table 1: Membrane and module characteristics.
Membrane
Material Polyethersulphone/ Teflon
Fibre internal diameter (μm) 409 Fibre external diameter (μm) 714 Membrane thickness (μm) 152.5
Modules M18 M87
Number of fibers 18 87
Active fiber length, m 0.55 0.68 Internal Diameter, m 0.015 0.039
Membrane area, m2 0.0223 0.133
Specific area, m2/m3 228 168
Gas Permeator and Gas Contactor
In a gas permeator, oxygen transfer through the membrane can be written as:
O2 G O2, F O2, P
J = K (P - P ) (1)
where KG is the overall mass transfer coefficient and PO2,F and PO2,P are the average oxygen partial pressures inside the fibers and in the permeate, respectively. The difference between the feed and the permeate partial pressure is the driving force for mass transfer.
The overall gas mass transfer coefficient can be estimated by a linear regression analysis of the experimental data. The overall mass transfer resis-tance, which is the sum of membrane resistance and gas boundary layer resistance, is the reciprocal of the overall mass transfer coefficient. The membrane is the main resistance to mass transfer in a gas permeator. In order to estimate the gas boundary
layer resistance, oxygen flux was evaluated by varying the pressure and gas velocity inside the fibres. Measuring feed and concentrate flow rate, the total pressure and oxygen concentration allowed calculation of the permeate flow rate and composi-tion through material balance.
In a gas-liquid contactor, oxygen transfer from the gas phase to the liquid phase through the mem-brane can be written as a function of the overall liquid mass transfer coefficient, KL, as follows:
O2 L O2, F O2, L
J = K (H. P - c ) (2)
L G G M L
1 H H H 1
K = K =k +k +k (3)
where CO2,L is the dissolved oxygen concentration in the liquid; H is the Henry’s Law constant and kG, kM and kL are the individual mass transfer coefficients in the gas boundary layer, in the membrane dense layer and in the liquid boundary layer, respectively. The liquid boundary layer is supposed to be the main resistance to mass transfer in gas-liquid contactors. Measuring the dissolved oxygen concentration in-crease in a well-mixed reservoir, with water pumped to the module in a closed loop, allowed determina-tion of the overall liquid mass transfer coefficient and the oxygen transfer rate (OTR) at different oxygen partial pressures inside the fibres and water velocities on the shell side, as suggested by Ahmed and Semmens (1992). Oxygen partial pressure in the feed varied from 0.26 to 1.06 bar. Water flow velocity on the module shell side varied from 0.008 to 0.1 m.s-1, corresponding to Reynolds numbers ranging from 120 to 850. The oxygen transfer rate to water, per membrane area (OTR/A), was the parame-ter used to evaluate and compare the oxygen dissolu-tion capacity with the oxygen flux through the membrane. The average oxygen partial pressure inside the fibers and OTR/A were used to estimate the overall gas mass transfer coefficient by linear regression analysis of the experimental data, using Equation (4).
O2, L
O2 G O2, F G O2, F O2, L
c
J K (P - ) K (P - P )
H
= = (4)
MABR Operation
Membrane Module Recycle
Pump
Treated Effluent
Feed
Pump FI O2
FI PI DO
Air Inlet
Gas Outlet
DPI
CV 03
Oxygen Inlet FI Synthetic
Wastewater
TI
CV
0
1
CV
0
2
FI
Membrane Module Recycle
Pump
Treated Effluent
Feed
Pump FI O2
FI PI DO
Air Inlet
Gas Outlet
DPI
CV 03
Oxygen Inlet FI Synthetic
Wastewater
TI
CV
0
1
CV
0
2
FI
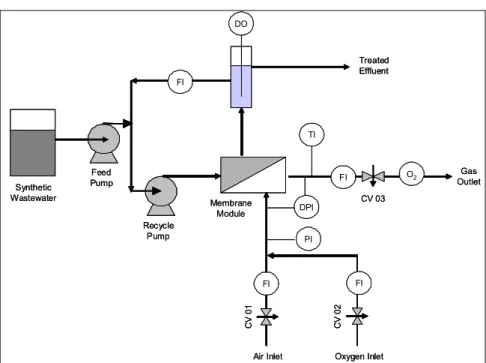
Figure 2: Schematic view of the experimental set-up used to evaluate COD
removal from synthetic sanitary wastewater during operation of the MABR.
(Milton Roy A751-393 SI); sensors to measure both liquid and gas flowrate (FI), pressure (PI) and tem-perature (TI); control valves (CV) to set the air and pure oxygen inlet pressure and flowrate; an oxygen analyzer (Servomex 1175, AE-101) to measure oxygen concentration in the gas outlet and in the liquid recycle loop.
The oxygen flux through the membrane was assessed by mass balance (inlet and outlet fibers). The oxygen flux and average partial pressure inside the fibers were used to estimate the overall gas mass transfer coefficient according to Equation (4).
Biofilm structure and, consequently, resistance to mass transfer are closely related to the hydrodynamic shear stress (Celmer et al., 2008). In low shear stress conditions, biofilms are less compact and more porous, presenting higher substrate diffusion. The recycle pump average flow rate was 8 L.h-1, which corresponds to an average velocity of 0.002 m.s-1 on the module shell side. Variation of the HRT in the range investigated was achieved by adjusting the feed pump flow rate.
The air flow rate and oxygen partial pressure inside the fibers were controlled to assure the re-quired amount of oxygen for process operation. The oxygen partial pressure was increased by increasing the total pressure or the oxygen mole fraction with pure oxygen.
Bioreactor operation started after inoculating the module with mixed liquor suspended solids from a sanitary wastewater activated sludge treatment plant.
Biofilm grew attached to the membrane surface after feeding the reactor with a synthetic sanitary waste-water, whose composition, based on the literature (Holler and Trosh, 2001), was (g.L-1): meat extract (16), peptone (11), urea (3), K2HPO4 (2.8), NaCl (0.7), CaCl2.2H2O (0.4), MgSO4.7H2O (0.2). These components were diluted with tap water to produce wastewaters with COD contents between 400 and 600 mg.L-1.
The conditions imposed on the biological reactor are indicated in Table 2. The MABR was operated under three hydraulic retention time regimes ranging between 4 and 1 h (conditions I to III). Organic load (OL) was intentionally increased to check the limits of bioreactor efficiency. The oxygen transfer flux (JO2) was increased accordingly by raising the total air pressure inside the fibers. After several days of operation under the highest organic load (condition III), JO2 was further increased (condition IV) by augmenting the oxygen partial pressure inside the fibers. The three biological operation conditions were repeated employing higher oxygen partial pressure inside the fibers (conditions V to VII) to guarantee that oxygen transfer was not limiting the biological process.
Analytical
Table 2: Operational conditions during MABR operation.
Condition Operation time (d)
HRT (h)
Organic load (kgCDO/m-3.d-1)
Total pressure inside the fibers (kPa)
Average oxygen mole fraction inside the fibers I 1 - 17 4.22 ± 0.09 3.35 ± 0.28 179 ± 2 0.205 ± 0.001 II 18 - 44 2.19 ± 0.03 4.17 ± 0.23 181 ± 2 0.200 ± 0.001 III 45 - 69 1.13 ± 0.01 8.7 ± 0.32 218 ± 11 0.204 ± 0.002 IV 70 - 87 1.11 ± 0.02 8.44 ± 0.36 201 ± 1 0.321 ± 0.007 V 88 - 100 3.96 ± 0.17 3.78 ± 0.16 155 ± 6 0.324 ± 0.01 VI 101 - 144 1.97 ± 0.02 4.4 ± 0.23 182 ± 4 0.352 ± 0.006 VII 145 - 160 1.01 ± 0.02 9.23 ± 0.67 222 ± 1 0.434 ± 0.015
RESULTS AND DISCUSSION
Membrane Characterization
As shown in Figure 1 the membrane structure consisted of a porous support and a dense surface layer. The thin surface layer was related to the high permeability while the surface roughness was a positive factor for biofilm attachment.
The results of pure gas permeability are shown in Figure 3 and Table 3. As expected, a linear relation-ship was observed between gas flux (JO2 or JN2) and transmembrane pressure (Δp).
JN2= 1.426E-06 ΔP JO2= 3.68E-06 ΔP
0.0E+00 1.0E-04 2.0E-04 3.0E-04 4.0E-04 5.0E-04 6.0E-04
0 20 40 60 80 100 120 140 160
ΔP (kPa)
J ( N m 3/m 2.s) Oxygen Nitrogen
JN2= 1.426E-06 ΔP JO2= 3.68E-06 ΔP
0.0E+00 1.0E-04 2.0E-04 3.0E-04 4.0E-04 5.0E-04 6.0E-04
0 20 40 60 80 100 120 140 160
ΔP (kPa)
J ( N m 3/m 2.s) Oxygen Nitrogen
JN2= 1.426E-06 ΔP JO2= 3.68E-06 ΔP
0.0E+00 1.0E-04 2.0E-04 3.0E-04 4.0E-04 5.0E-04 6.0E-04
0 20 40 60 80 100 120 140 160
ΔP (kPa)
J ( N m 3/m 2.s) Oxygen Nitrogen
Figure 3: Permeability of pure gases (O2 and N2) –
Flux (J) variation against transmembrane pressure (ΔP).
Table 3: Gas permeability results: linear equation
relating flux (J) and pressure drop (ΔP), correlation
coefficient of the linear regression and permeability value.
Equation Correlation coefficient (r2)
Permeability (Ncm3.cm-2.s-1.cmHg-1) JO2 = 4.91.10-4.ΔP 0.997 4.91.10-4
JN2 = 1.89.10-4. ΔP 0.993 1.89.10 -4
The membrane selected presented a high oxygen permeability, approximately 5 x 10⁵ times higher than the permeability of the composite membrane evaluated by Ahmed et al. (2004) and 16 times higher than the
permeability reported by Motlagh et al. (2008). The ideal separation factor of 2.6, informed by the supplier, was experimentally confirmed.
Oxygen Transfer
Comparison of oxygen transfer results was based on the values of the overall gas mass transfer coeffi-cient. During operation as a gas-liquid contactor, since oxygen and nitrogen permeabilities in the membrane were high and their solubility in water were low, even at low pressures, bubbles were observed on the external membrane surface.
Plotting oxygen flux (JO2) as a function of differ-ential pressure (ΔP), for the system operating as gas permeator, gas/liquid contactor and bioreactor (MABR), the global mass transfer coefficient was estimated by the slope of the line fitted to the experimental data, as shown in Figure 4. The total mass transfer resis-tance, which is the sum of membrane resistance with boundary layer resistance inside and outside the fiber, was estimated as the reciprocal of the global mass transfer coefficient.
Permeator
JO2= 3.45E-06 ΔP
Gas/Liquid contactor
OTR/A = 1.74E-08 ΔP
Bioreactor
JO2= 1.67E-07 ΔP
1E-07 1E-06 1E-05 1E-04
0 5 10 15 20 25 30
ΔPΟ2(kPa)
JO2 (N m 3/m 2.s ) Permeator
JO2= 3.45E-06 ΔP
Gas/Liquid contactor
OTR/A = 1.74E-08 ΔP
Bioreactor
JO2= 1.67E-07 ΔP
1E-07 1E-06 1E-05 1E-04
0 5 10 15 20 25 30
ΔPΟ2(kPa)
JO2 (N m 3/m 2.s ) Permeator
JO2= 3.45E-06 ΔP
Gas/Liquid contactor
OTR/A = 1.74E-08 ΔP
Bioreactor
JO2= 1.67E-07 ΔP
1E-07 1E-06 1E-05 1E-04
0 5 10 15 20 25 30
ΔPΟ2(kPa)
JO2 (N m 3/m 2.s ) Permeator
JO2= 3.45E-06 ΔP
Gas/Liquid contactor
OTR/A = 1.74E-08 ΔP
Bioreactor
JO2= 1.67E-07 ΔP
1E-07 1E-06 1E-05 1E-04
0 5 10 15 20 25 30
ΔPΟ2(kPa)
JO2 (N m 3/m 2.s )
Figure 4: Oxygen flux through the membrane: flux
The evaluation of oxygen transfer to clean water was performed under laminar conditions of air flow inside the fibers and of water flow on the shell side of the module. In comparison with the gas permeator operational condition (Figure 4), the addition of a liquid boundary layer, with water flowing outside the fibres, the global mass transfer coefficient decreased around 200 times. In the operation of the module as a gas/liquid contactor, the membrane resistance repre-sented 0.5% of the total resistance. Figure 5 shows the liquid mass transfer coefficient variation as a function of the Reynolds number on the shell side of the module for the oxygen partial pressure of 0.26 bar inside the fibres.
1.0E-05 1.5E-05 2.0E-05 2.5E-05 3.0E-05 3.5E-05 4.0E-05
0 200 400 600 800 1000
ReL KL
(m/
s
) vg = 0.3 m/s
vg = 0.2 m/s
vg = 0.1 m/s
1.0E-05 1.5E-05 2.0E-05 2.5E-05 3.0E-05 3.5E-05 4.0E-05
0 200 400 600 800 1000
ReL KL
(m/
s
) vg = 0.3 m/s
vg = 0.2 m/s
vg = 0.1 m/s
1.0E-05 1.5E-05 2.0E-05 2.5E-05 3.0E-05 3.5E-05 4.0E-05
0 200 400 600 800 1000
ReL KL
(m/
s
) vg = 0.3 m/s
vg = 0.2 m/s
vg = 0.1 m/s
Figure 5: Liquid mass transfer coefficient variation
as a function of the Reynolds number on the shell side of the module for different gas velocities inside the fibers (oxygen partial pressure inside the fibres = 0.26 bar)
The increase of the mass transfer coefficient with gas velocity (vG) inside the fibres and liquid velocity
on the shell side confirmed the relevance of gas and liquid boundary layers to mass transfer.
When biomass was attached to the membrane (biofilm), the oxygen flux was 10 fold higher in comparison to that observed in the operational condi-tion without biomass. In the operacondi-tion of the module as a MABR, membrane resistance represented only 5.5% of the total resistance.
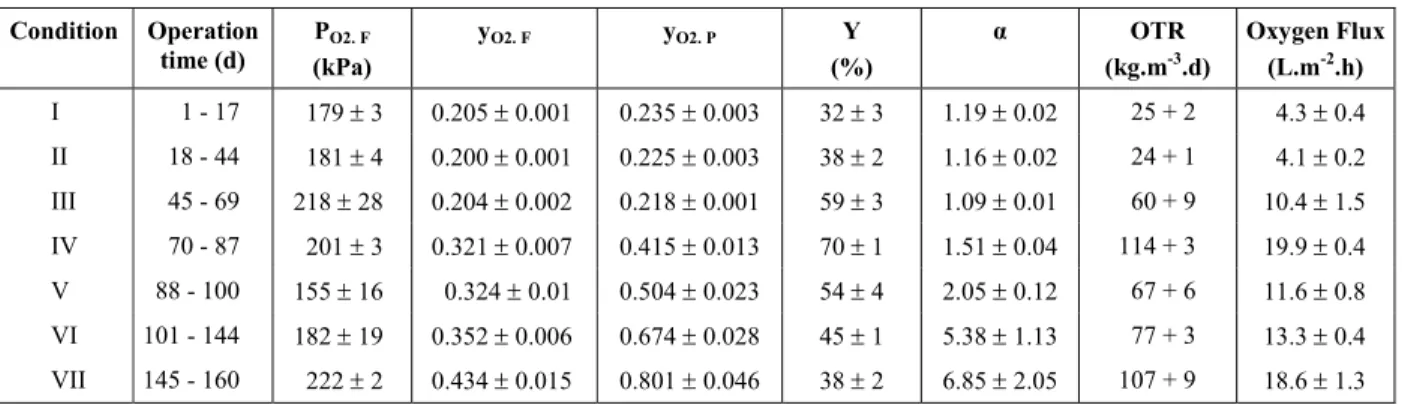
After biofilm growth it was possible to increase the internal air pressure without bubbling. Dissolved oxygen concentration values close to zero, when measured by the DO probe installed in the liquid loop, indicated that all the oxygen transferred through the membrane was consumed by the biofilm. Average results and 95% confidence intervals related to oxygen transfer in the MABR are presented in Table 4. PO2, F and yO2, F are the average oxygen partial pressure and the average oxygen mole fraction inside the fibers; yO2, P is the average oxygen mole fraction at the membrane/biofilm interface. The increase in the separation factor α, shown in Table 4, was attributed to the oxygen flux increase due to its consumption and to the nitrogen flux decrease because nitrogen is not consumed. It should be remarked that, when air is used instead of pure oxygen, there is a slight presence of small bubbles on the external membrane surface, probably formed by N2 accumulation. Higher yO2, F and higher gas velocity inside the fibers resulted in higher yO2, P (conditions VI and VII) and lower recovery (Y), which was considerably higher than the typical oxygen dissolution efficiency achieved by porous diffusers in aerobic treatment processes (WEF, 1994).
Table 4: MABR operational conditions and oxygen transfer performance.
Condition Operation time (d)
PO2. F
(kPa)
yO2. F yO2. P Y
(%)
α OTR
(kg.m-3.d)
Oxygen Flux
(L.m-2.h)
COD Removal
Figure 6 shows the module characteristics in the course of operation. The first picture shows bubbles growing on the membrane surface during the assess-ment of the capacity of oxygen dissolution in water. The second and the third photos show the biofilms formed after 7 and 15 days of operation. In the last picture, the membrane is not visible any more because of excessive biofilm growth after 60 days of opera-tion. Despite the pronounced accumulation of biomass on the membranes, MABR performance, expressed
as COD removal, was not hindered after 160 days of continuous operation, as further discussed.
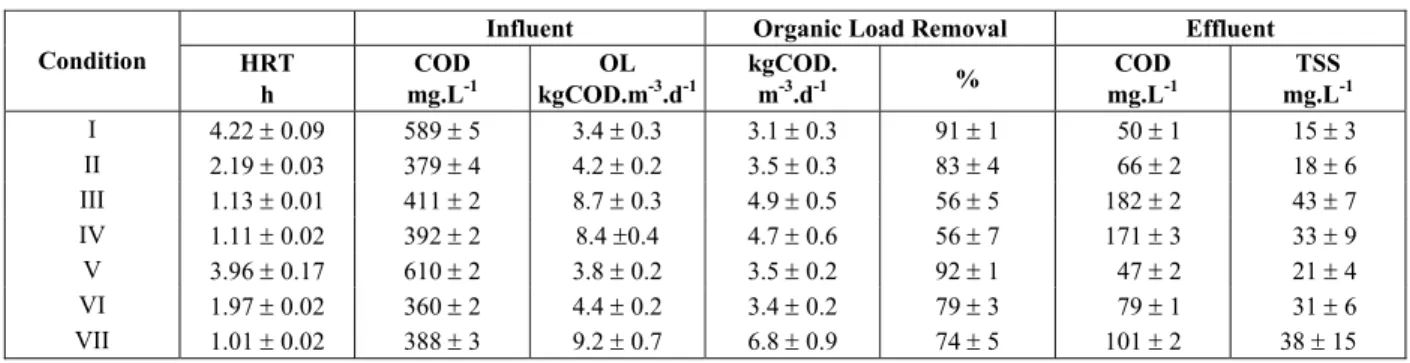
The MABR was submitted to variable operation conditions by combining the influent COD and HRT. Figure 7 shows long-term results of the MABR operation concerning the temporal variation of COD, HRT and organic load. Average results of organic load removal are presented in Table 5 for each experimental condition as well as effluent TSS. Throughout the 160 days of operation, organic load removal rates were higher than those reported by Semmens et al. (2003).
Figure 6: Biofilm accumulation on the surface of the MABR fibers - from left
to right, 0, 7, 15 and 60 days of operation.
(a) 0 100 200 300 400 500 600 700 800
1 8 15 22 29 36 43 50 57 64 71 78 85 92 99
10 6 11 3 12 0 12 7 13 4 14 1 14 8 15 5 Time (d) CO D ( m g /L ) 0 1 2 3 4 5 6 7 8 HR T ( h )
Influent Effluent HRT
I II III IV V VI VII
(a) 0 100 200 300 400 500 600 700 800
1 8 15 22 29 36 43 50 57 64 71 78 85 92 99
10 6 11 3 12 0 12 7 13 4 14 1 14 8 15 5 Time (d) CO D ( m g /L ) 0 1 2 3 4 5 6 7 8 HR T ( h )
Influent Effluent HRT
I II III IV V VI VII
(b) 0 2 4 6 8 10 12 14 16 18 20
1 8 15 22 29 36 43 50 57 64 71 78 85 92 99
10 6 11 3 12 0 12 7 13 4 14 1 14 8 15 5 Time (d) OL ( k g /m 3.d ) H R T ( h ) 0% 20% 40% 60% 80% 100% O L r e m o va l (% )
Influent OL HRT OL Removal Efficiency
I II III IV V VI VII (b)
0 2 4 6 8 10 12 14 16 18 20
1 8 15 22 29 36 43 50 57 64 71 78 85 92 99
10 6 11 3 12 0 12 7 13 4 14 1 14 8 15 5 Time (d) OL ( k g /m 3.d ) H R T ( h ) 0% 20% 40% 60% 80% 100% O L r e m o va l (% )
Influent OL HRT OL Removal Efficiency
I II III IV V VI VII
(a) (b)
Figure 7: MABR operation results: (a) influent and effluent COD; (b) organic load (OL) and removal
efficiency. Data obtained according to the operational conditions shown in Table 2.
Table 5: MABR operational conditions and COD removal performance.
Influent Organic Load Removal Effluent
Condition HRT h
COD mg.L-1
OL kgCOD.m-3.d-1
kgCOD.
m-3.d-1 %
COD mg.L-1
In conditions I to III, air was used as the oxygen source. In an attempt to maintain the organic load removal efficiency, the average total pressure inside the fibres and the oxygen mole fraction inside the fibres were changed during the MABR operation according to the data shown in Table 4.
Operation of the MABR with a HRT around 4 hours was quite stable (first 16 days, condition I). The average total COD removal was 91%. The total suspended solids concentration was always below 30 mg/L indicating that a final clarification was not needed. During the operation with a HRT close to 2 hours (condition II), the average organic load re-moval rate was 4.2 kgCOD.m-3.d-1, the average effi-ciency was 83% and the total suspended solids concentration averaged 18 mg/L. Following the decrease of the HRT to 1 hour, the influent organic load almost doubled as the influent COD concentra-tion was maintained around 400 mg/L. The average OL removal efficiency dropped to 56%. The average effluent COD and TSS concentrations increased to 182 mg/L and to 47 mg/L, respectively. Deteriora-tion of effluent quality suggested that oxygen transfer limitation was occurring. Thus, air was en-riched with pure oxygen, increasing the average feed oxygen mole fraction from 0.20 to 0.32. Although the oxygen flux was doubled, from around 10 to around 20 L.m-2.h-1 (Table 4), no improvement in effluent quality was observed. Bubbles were ob-served, likely due to the increase of nitrogen transfer through the membrane.
At that time (end of condition IV), it was not possible to inspect the fibres because of excessive solids accumulation inside the bioreactor. Unexpect-edly, the thick biofilm sloughed from the membrane surface on day 81. Because the removal efficiency did not change, the sloughed biofilm probably was not taking part in the organic load degradation.
The biological operating conditions I to III were repeated with higher OTR. Condition V corresponded to a HRT of approximately 4 hours and an average OTR of 67 kg.m-3.d-1, which was 2.7 times higher than the average OTR established for condition I. The COD removal efficiency was recovered in such con-ditions, achieving 92%. During condition VI, the HRT was fixed at 2 h but the OTR was three times higher than that established for condition II. The OTR increase promoted by a higher oxygen partial pressure inside the fibres in conditions V and VI did not affect either the effluent quality or the COD removal efficiency, suggesting that oxygen transfer was not limiting the biological activity.
Between days 145 and 160, corresponding to condition VII, the HRT was again lowered to 1 hour,
leading to an increase in the average influent organic load to 9.2 kg.m-3.d-1. Oxygen flux was the same as previously established for condition IV but with a higher oxygen concentration in the membrane/ biofilm interface. The improvement of the COD removal efficiency, from 56% in condition III and IV to 74% in condition VII, indicates that the biological process was limited by oxygen diffusion in the biofilm. Filtering the effluent, the COD removal efficiencies became 68 ± 7%, for condition IV, and 88 ± 2%, for condition VII.
CONCLUSIONS
The results provide evidence that the highly permeable membrane selected was able to enrich the air with oxygen that was transferred to the biofilm. Furthermore, membrane resistance was not signifi-cant in comparison to the liquid boundary layer and biofilm resistances to oxygen transfer. Oxygen transfer through the membrane covered with biofilm was enhanced 10-fold in comparison with the biofilm-free membrane.
Robustness of the MABR was confirmed during a long-term operational period under variable loading conditions. The considerably high values of organic load removal with hydraulic retention times in the range of 1 to 4 h, with improved oxygen transfer efficiency, confirmed that the MABR is a promising and compact alternative to the conventional activated sludge process and that the selected membrane is suitable for future process development.
ACKNOWLEDGEMENTS
The authors express their gratitude for the financial and technical support of White Martins/ Praxair Industrial Gases Co.
REFERENCES
Ahmed, T., Semmens, M. J., Use of sealed end hollow fibers for bubbleless membrane aeration: Experimental studies. J. Membr. Sci., 69, 1-10 (1992).
Ahmed, T., Semmens, M. J., Voss, M. A., Oxygen transfer characteristics of hollow-fiber composite membranes. Adv. Environ. Res., 8, 637-646 (2004). APHA, AWWA, WEF, Standard Methods for the
Brindle, K., Stephenson, T., Semmens, J. M., Enhanced biological treatment of high oxygen demanding wastewaters by a membrane bioreac-tor capable of bubbleless oxygen mass transfer. In: Proceedings of Water Environment Federation 70th Annual Conference and Exposition, Chicago, Illinois, USA, 63-72 (1997).
Celmer, D., Oleszkiewicz, J. A., Cicek, N., Impact of shear force on the biofilm structure and perform-ance of a membrane biofilm reactor for tertiary hydrogen-driven denitrification of municipal wastewater. Water Res., 42, 3057-3065 (2008). Chen, R. D., Semmens, M. J., LaPara, T. M.,
Biological reatment of a synthetic space mission wastewater using a aerated, membrane-coupled bioreactor (M2BR). J. Ind. Microbiol. Biotechnol., 35, 465-473 (2008).
Downing, L., Nerenberg, R., Effect of bulk liquid BOD concentration on activity and microbial community structure of a nitrifying membrane-aerated biofilm. Environ. Biotechnol., 81, 153-162 (2008a). Downing, L., Nerenberg, R., Total nitrogen removal
in a hybrid, membrane-aerated activated sludge process. Water Res., 42, 3697-3708 (2008b). Gong, Z., Yang, F., Liu, S., Bao, H., Shaowei, H.,
Furukawa, K., Feasibility of a membrane-aerated biofilm reactor to achieve single-stage autotrophic nitrogen removal based on Anammox. Chemos-phere, 69, 776-784 (2007).
Holler, S., Trösh, W., Treatment of urban wastewater in a membrane bioreactor at high organic loading rates. J. Biotechnol., 92, 95-101 (2001).
Misiak, K., Casey, E, Murphy, C. D., Factors influ-encing 4-fluorobenzoate degradation in biofilm cultures of Pseudomonas knackmussii B13. Water Res., 45, 3512-3520 (2011).
Motlagh, A. R. A., LaPara, T. M., Semmens, M. J., Ammonium removal in advective-flow membrane-aerated biofilm reactors (AF-MABRs). J. Membr. Sci., 319, 76-81 (2008).
Pankhania, M., Brindle, K., Stephenson, T., Membrane aeration bioreactors for wastewater treatment: Completely mixed and plug-flow operation. Chem. Eng. J., 73, 131-136 (1999).
Satoh, H., Ono, H., Rulin, B., Kamo, J., Okabe, S., Fukushi, K-I., Macroscale and microscale analyses of nitrification and denitrification in biofilms attached on membrane aerated biofilm reactors. Water Res., 38, 1633-1641 (2004).
Shanahan, J. W., Semmens, M. J., Influence of a nitrifying biofilm on local oxygen fluxes across a micro-porous flat sheet membrane. J. Membr. Sci., 277, 65-74 (2006).
Semmens, J. M., Dahm, K., Shanahan, J., Christianson, A., COD and nitrogen removal by biofilms growing on gas permeable membranes. Water Res., 37, 4343-4350 (2003).
Syron, E., Casey, E., Membrane-aerated biofilms for high rate biotreatment: Performance appraisal, engi-neering principles, scale-up, and development re-quirements. Environ. Sci. Technol., 42, 1833-1844 (2008).
Terada, A., Yamamoto, T., Igarashi, R., Tsuneda, S., Hirata, A., Feasibility of a membrane-aerated biofilm reactor to achieve controlable nitrification. Biochem. Eng. J., 28, 123-130 (2006).
Tinggang, L., Junxin, L., Bai, R., Wong, F. S., Membrane-aerated biofilm reactor for the treat-ment of acetonitrile wastewater. Environ. Sci. Technol., 42, 2099-2104 (2008).
Udert, K. M., Wächter, M., Complete nutrient recov-ery from source-separated urine by nitrification and distillation. Water Res., 46, 453-464 (2012). WEF, Water Environmental Federation, Aeration a
Wastewater Treatment Process. Manual of Practice No. FD-13, Alexandria, VA (1994).