Carlos Barreira Martinez
Professor Titular
Universidade Federal de Minas Gerais – UFMG Departamento de Hidráulica
Belo Horizonte – Minas Gerais – Brasil [email protected]
Aloysio Portugal Maia Saliba
Professor Adjunto
Universidade Federal de Minas Gerais – UFMG Departamento de Hidráulica
Belo Horizonte – Minas Gerais – Brasil [email protected]
Marcio Figueiredo de Resende
Engenheiro Civil
Potamos Engenharia e Hidrologia Ltda. Belo Horizonte – Minas Gerais – Brasil [email protected]
Eder Daniel Teixeira
Professor Adjunto
Universidade Federal do Rio Grande do Sul - UFRS Instituto de Pesquisas Hidráulicas (IPH)
Porto Alegre - Rio Grande do Sul - Brasil [email protected]
Marcelo Giulian Marques
Professor Titular
Universidade Federal do Rio Grande do Sul - UFRS Instituto de Pesquisas Hidráulicas (IPH)
Porto Alegre - Rio Grande do Sul – Brasil [email protected]
Surface drainage system for dry
docks in shipyards – Case study
of Estaleiro Rio Grande
(Technical Note)
Abstract
This study aims to present a methodology for the design of a surface drainage system for dry docks in shipyards, taking into account the rainfall intensity at the site, the damping capacity of the hydraulic structures (drainage channels) and the pumping capacity of the pumping system. A case study of a dry dock owned by Estaleiro Rio Grande, located at the state of Rio Grande do Sul, is presented. The results obtained indicate alternatives for channel and submersible pump sizing. These pumps would be used to control the dry dock looding after an intense rainfall event.
Keywords: shipyards, surface drainage, storm water drainage.
http://dx.doi.org/10.1590/0370-44672014690210
Civil Engineering
Engenharia Civil
1. Introduction
In the 1970s, Brazil had the second largest industrial park for merchant ships worldwide, losing only to Japan. Cur-rently, the world leadership in shipbuilding comprises Japan, China and South Korea, which are responsible for 80% of world’s production (IPEA, 2014).
The industrial park for ships consists of several manufacturing sectors and assembly sites. Shipyards are possibly the most important places among them,
because their coniguration allows the inal construction of boats that will be responsible for transporting thousands of tons of products.
Due to the type of work for which they are to be used, shipyards have speciic requirements regarding their operation. Several factors affect the eficiency of ship-yard operation, including the possibility of rainfall events that would lood the sembly yards. Small loods can halt the
as-sembly line, causing costs and undesirable delays throughout the production chain.
runoff into a tank, from which the low needs to be pumped out as the dry dock elevation is lower than sea level.
In this case the drainage channels are for two purposes, namely: (a) to collect storm water and guide it to a tank and (b) to store part of the inlowing water and pump it to an area outside the dry dock.
Since these are small catchment areas, data on intense rainfall are used to determine the lows into the channels. However, in the technical literature, the sizing criteria to be adopted for that structure are not identiied as regards
the return-period variable. Thus, an op-tion is to perform a sensitivity analysis, adopting return-periods of 20, 50 and 100 years.
This study is for the purpose of presenting a methodology to design the drainage system project of a shipyard. The following questions must be asked: a) What is the minimum geometrical cross section of the drainage channels, so that they will have the capacity to dampen an intense rainfall event; b) How much low must be pumped in order to, together with the action of the
drainage structures, keep the dry dock from looding.
Several references show informa-tion about drainage system sizing. The following can be mentioned: AZE-VEDO NETTO, J.M. and ALVAREZ, G.A. (1988), TUCCI, C.E.M. (1995), PORTO, R.M. (1999), TUCCI, C.E.M. (2002) BAPTISTA, M. and LARA, M. (2003), HOUGHTALEN, R.J. (2012). However, there are no studies (nationals or internationals) that present prem-ises and criteria for the development of drainage systems in shipyard dry docks.
2. Site characteristics
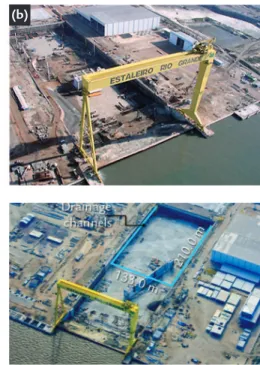
The Estaleiro Rio Grande dry dock is 350.0 m long, 130.0 m high and 13.8 m deep below sea level. Its walls are 17.1 m high, including 3.3 m of free board in relation to the sea level.
Figure 1 (a) presents a view of the dry dock, where one can see the large gantry crane in operating position, with
a drilling rig platform. Figure 1 (b) also shows a view of the dry dock. In this igure the size of the work can be seen, observing the space excavated as com-pared to a backhoe.
Figure 2 shows a schematic drawing of the Estaleiro Rio Grande shipyard dry dock, with the positioning of the drainage
channels, for the purpose of collecting/ holding storm water, installed at the bot-tom of the structure. The drainage system consists of 553.0 m long channels:
• Two channels 210.0 m long, side -ways to the dry dock;
• One channel 133.0 m long trans -versally to the dry dock.
(a) (b)
Figure 1
(a) general view of the
Estaleiro Rio Grande dry dock and (b) general view of the opening of the ditch to install the dry dock.
Ref.: CEGLINSKI, J.P. (2014).
Figure 2
Positioning of the
channels in relation to the dry dock.
Ref.: BERNARDES, J. (2014).
(1)
3. Materials and methods
The intensity-duration-frequency (idf) equation of the city of Rio Grande,
Rio Grande do Sul, was obtained from the paper presented by DAMÉ et al. (2006).
The adjustment obtained in this case is shown in Equation 1:
i
=
k
.
tr
0,23
2, 25
+
t
min(
)
in which,
i s the maximum intensity of rainfall
(mm/h) for a duration of t
min;
tr is the return-period of
precipita-tion (years);
t
min is the duration of the rainfall
event (minutes);
k is a parameter of the equation
obtained from the historical precipita-tion data.
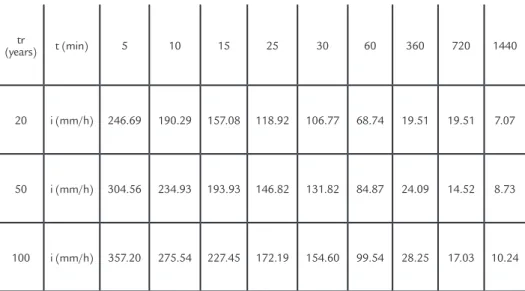
Table 1 presents the intensity val-ues for rainfall events with 20, 50 and
100 years return-periods, and several durations of precipitation.
Table 1 Maximum rainfall intensity for the city of Rio Grande.
tr
(years) t (min) 5 10 15 25 30 60 360 720 1440
20 i (mm/h) 246.69 190.29 157.08 118.92 106.77 68.74 19.51 19.51 7.07
50 i (mm/h) 304.56 234.93 193.93 146.82 131.82 84.87 24.09 14.52 8.73
100 i (mm/h) 357.20 275.54 227.45 172.19 154.60 99.54 28.25 17.03 10.24
Source: Adapted from Damé et al. (2006).
The channel system evaluated in this paper considered 35 durations of
the incident rainfall events, ranging from 5min to 175min (2h 55min),
uniformly distributed along each duration.
The storage volume of the drainage channels was determined from their total length and cross section, considering a rectangular section.
Initially, in order to determine the canal section, the sectors responsible for implementing the work were consulted. Based on the dimensions of the excava-tion equipment they recommended that
the minimum width of the canal would be 1.50 m. Likewise, the maximum depth should be in the order of 2.40 m. From these boundary conditions, three different channel heights were tested (1.00 m, 1.70 m and 2.40 m) with the same width (1.50 m) under the occur-rence of rainfall events of 20, 50 and 100 years of return-period.
Table 2 shows the sections re-searched and the respective accumula-tion volumes. The canal is a total of 553.0 m long. The channels filling proiles for recurrence periods of 20, 50 and 100 year were obtained from a water balance considering the maximum rainfall intensity, the damping capacity of the channels and pumped low.
Table 2 Dimensions adopted for the set of drainage channels based on back time.
(2)
tr (years) Canal width* (m) Canal height (m) Canal volume (m3)
20 1.50 1.00 829.5
50 1.50 1.70 1410.2
100 1.50 2.40 1990.8
* Width defined by using the Caterpillar Backhoe 336 D L
Pumping power:
Pumping power in each case was obtained from equation 2:
Pot
b=
9,81
Q H
total bIn which,
Potb is the pump power (kW);
Q is the pumping low (m3/s);
Htotal is the manometric height (m); ηb
is the pump yield (in this study adopted as 55%).
The manometric height of the pumps was calculated by the sum of geo-metric height, equal to 13.8 m, and the loss of total load in the circuit, estimated as 2/3 of the pumping height, i.e., 9.20 m. Thus the manometric height considered
was 22.0 m.
From the previously described con-ditions and ignoring channels damping, the calculated pumping power for each pumping low is shown in Table 3. These low values were chosen from a
prelimi-nary analysis to avoid excessive dry dock looding, which shouldn’t be greater than 75 mm (3 inches) in any case but preferably lower than 10 mm, and to avoid exces-sively large pumps, which would result in an excessive system cost.
Table 3
Power required by the pumps and pumped flow.
Pumped flow (m3/s) Power required by the pumps * (kW)
0.280 110
0.300 120
0.330 130
0.350 140
0.400 160
* This is the power required by the set of pumps. It indicates that the system may comprise two or more pumps, depending on the flow, manufacturer or operational strategy and maintenance.
The system operation assump-tions that pumps are turned on as soon as enough water height is available at the pumping intake, which would be designed and placed in such a way that it is reached from runoff almost at rainfall start. This means that power calculation considers full rainfall dura-tion and channel storage is empty at
rainfall beginning.
However, the drainage channels may behave as elements that dampen the inlows when they operate together with the submersible pumps during intense rainfall events.
This analysis was performed based on water balance simulation of the system. These simulations took into account
rain-fall events of 20, 50 and 100 years return-periods. It should be emphasized that, in all cases, the use of the pumping system was considered with the hypotheses of installing pumps as shown in Table 3.
The remaining volumes during the rainfall events in the channels will later be pumped until the system is completely drained.
4. Results
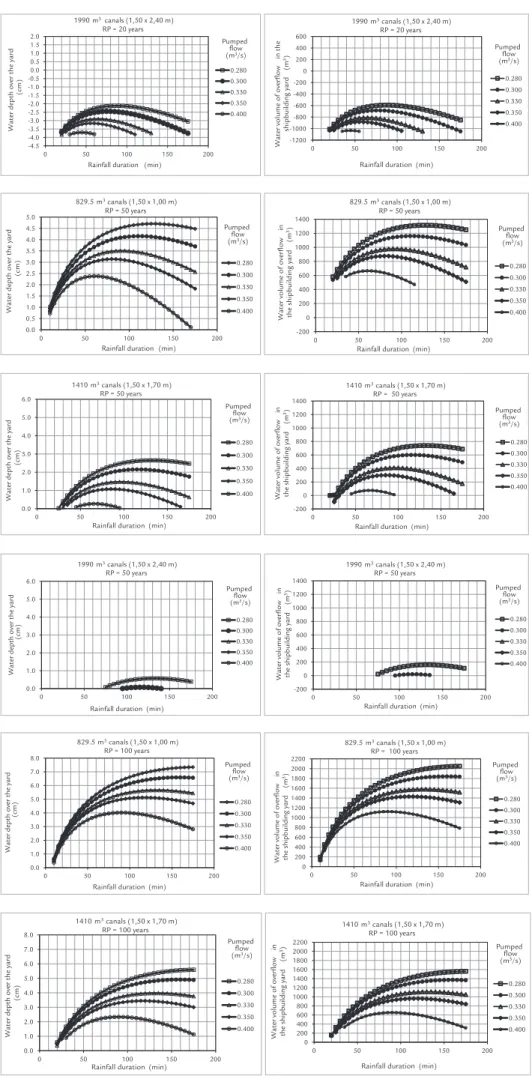
Figures 3 to 11 show the results of simulations for the drainage channels with a rectangular cross section and a base equal to 1.50 m (due to constructive issues and excavation equipment com-monly used in carrying out these large works) and heights equal to 1.00 m, 1.70 m and 2.40 m, corresponding to storage capacities equal to 829.5 m³, 1410.2 m³ and 1990.8 m³, respectively, for different return-periods (20, 50 and 100 years). In all cases, the results of water depths and volume that overlowed onto the dry dock loor are presented. The vertical
scales of these igures are the same to allow better visualization of the results.
The water depths and volumes that overlowed with positive values, shown in Figures 3 to 11, are the situations in which water overlows onto the dry dock. On the other hand, the negative values of water depth and volume in-dicate that the channels and pumping systems proposed have a capacity to absorb the lood event without looding the dry dock, i.e., the channels were not completely illed during the respective rainfall event. It should be noted that
the damping of the flood event was considered for each scenario studied. Besides, as a premise, it was considered that before the lood event, the channel was empty (all storage volume can be used for lood damping).
The results obtained indicate that the channels that are 1.70 m high (storage equal to 1410.2 m³) and 2.40 m (storage equal to 1990.8 m³) do not overlow in rainfall events with a return-period of up to 20 years, consid-ering the pumping hypotheses presented in Table 3.
Figure 3
Water depth and overflow volume for channels of 1.50 m x 1.00 m and rainfall events with a 20 years return-period.
Figure 4
Water depth and overflow volume for channels of 1.50 m x 1.70 m and rainfall events with a 20 years return-period.
0.0 0.2 0.4 0.6 0.8 1.0 1.2 1.4 1.6 1.8
0 50 100 150 200
0.280 0.300 0.330 0.350 0.400
829.5 m3canals (1,50 x 1,00 m) RP = 20 years
W ater de pth ov er the y ard (cm )
Rainfall duration (min)
Pumped flow (m3/s)
-1200 -1000 -800 -600 -400 -200 0 200 400 600
0 50 100 150 200
0.280 0.300 0.330 0.350 0.400
Rainfall duration (min)
W ater v ol ume of ov erf low in the shi pb ui ldi ng y ard (m
3) Pumped
flow (m3/s) 829.5 m3 canals (1,50 x 1,00 m)
RP = 20 years
-4.5 -4.0 -3.5 -3.0 -2.5 -2.0 -1.5 -1.0 -0.5 0.0 0.5 1.0 1.5 2.0
0 50 100 150 200
0.280 0.300 0.330 0.350 0.400
Rainfall duration (min)
W ater de pth ov er the y ard (cm) Pumped flow (m3/s) 1410 m3canals (1,50 x 1,70 m)
RP = 20 years
-1200 -1000 -800 -600 -400 -200 0 200 400 600
0 50 100 150 200
0.280 0.300 0.330 0.350 0.400
Rainfall duration (min)
Figure 5 Water depth and overflow volume for channels of 1.50 m x 2.40 m and rainfall events with a 20 years return-period.
Figure 6 Water depth and overflow volume for channels of 1.50 m x 1.00 m and rainfall events with a 50 years return-period.
Figure 7 Water depth and overflow volume for channels of 1.50 m x 1.70 m and rainfall events with a 50 years return-period.
Figure 8 Water depth and overflow volume for channels of 1.50 m x 2.40 m and rainfall events with a 50 years return-period.
Figure 9 Water depth and overflow volume for channels of 1.50 m x 1.00 m and rainfall events with a 100 years return-period.
Figure 10 Water depth and overflow volume for channels of 1.50 m x 1.70 m and rainfall events with a 100 years return-period.
-1200 -1000 -800 -600 -400 -200 0 200 400 600
0 50 100 150 200
0.280 0.300 0.330 0.350 0.400
Rainfall duration (min)
W ater v ol ume of ov erf low in t he shi pb ui ldi ng y ard (m 3) Pumped flow (m3/s)
1990 m3canals (1,50 x 2,40 m) RP = 20 years
-4.5 -4.0 -3.5 -3.0 -2.5 -2.0 -1.5 -1.0 -0.5 0.0 0.5 1.0 1.5 2.0
0 50 100 150 200
0.280 0.300 0.330 0.350 0.400
1990 m3 canals (1,50 x 2,40 m) RP = 20 years
Pumped flow (m3/s)
W at er dept h ov er t he yar d (cm )
Rainfall duration (min)
0.0 0.5 1.0 1.5 2.0 2.5 3.0 3.5 4.0 4.5 5.0
0 50 100 150 200 0.280 0.300 0.330 0.350 0.400 829.5 m3canals (1,50 x 1,00 m)
RP = 50 years
Pumped flow (m3/s)
W ater de pth ov er the y ard (cm )
Rainfall duration (min)
-200 0 200 400 600 800 1000 1200 1400
0 50 100 150 200 0.280 0.300 0.330 0.350 0.400
Rainfall duration (min)
W ater v ol um e of ov erf low in the shi pb ui ldi ng y ard (m
3) Pumped
flow (m3/s)
829.5 m3canals (1,50 x 1,00 m)
RP = 50 years
-200 0 200 400 600 800 1000 1200 1400
0 50 100 150 200
0.280 0.300 0.330 0.350 0.400
Rainfall duration (min)
W ater v ol ume of ov erf low in the shi pb ui ldi ng y ard (m
3) Pumped flow
(m3/s) 1410 m3canals (1,50 x 1,70 m)
RP = 50 years
0.0 1.0 2.0 3.0 4.0 5.0 6.0
0 50 100 150 200
0.280
0.300
0.330
0.350
0.400
Rainfall duration (min)
W ater de pth ov er the y ard (cm ) Pumped flow (m3/s) 1410 m3canals (1,50 x 1,70 m)
RP = 50 years
-200 0 200 400 600 800 1000 1200 1400
0 50 100 150 200
0.280 0.300 0.330 0.350 0.400
Rainfall duration (min)
W ater v ol ume of ov erf low in the shi pb ui ldi ng y ard (m 3) Pumped flow (m3/s)
1990 m3canals (1,50 x 2,40 m)
RP = 50 years
0.0 1.0 2.0 3.0 4.0 5.0 6.0
0 50 100 150 200
0.280 0.300 0.330 0.350 0.400
1990 m3canals (1,50 x 2,40 m)
RP = 50 years
Pumped flow (m3/s)
W ater de pth ov er the y ard (cm )
Rainfall duration (min)
0.0 1.0 2.0 3.0 4.0 5.0 6.0 7.0 8.0
0 50 100 150 200
0.280 0.300 0.330 0.350 0.400
829.5 m3canals (1,50 x 1,00 m)
RP = 100 years
Pumped flow (m3/s)
W ater de pth ov er t h e yard (cm )
Rainfall duration (min)
0 200 400 600 800 1000 1200 1400 1600 1800 2000 2200
0 50 100 150 200
0.280 0.300 0.330 0.350 0.400
Rainfall duration (min)
W ater v ol ume of ov erf low in the shi pb ui ldi ng y ard (m 3) Pumped flow (m3/s)
829.5 m3canals (1,50 x 1,00 m) RP = 100 years
0.0 1.0 2.0 3.0 4.0 5.0 6.0 7.0 8.0
0 50 100 150 200
0.280 0.300 0.330 0.350 0.400
Rainfall duration (min)
W ater de pth ov er the y ard (cm ) Pumped flow (m3/s)
1410 m3canals (1,50 x 1,70 m)
RP = 100 years
0 200 400 600 800 1000 1200 1400 1600 1800 2000 2200
0 50 100 150 200
0.280 0.300 0.330 0.350 0.400
Rainfall duration (min)
W ater v ol ume of ov erf low in the shi pb ui ldi ng y ard (m
3) Pumped flow
(m3/s) 1410 m3canals (1,50 x 1,70 m)
The results shown in Figures 3 to 11 are summarized in Tables 4 to 6 for a pumped low of 0.28 m³/s and 7 to 9 for pumped low of 0.40 m³/s.
The analysis of Tables 4 to 6 shows that none of the channels have a water depth of less than 10 mm over the dry dock for a pumped flow of
0.28 m³/s and considering a 100-year return-period. This 10 mm reference was taken as equivalent to half the height of a roller wheel of a small cart, typical of tool benches and small welding machines. Besides, this water surface is not enough to cover small tools, such as screw drivers and wrenches, and
dam-age them.
On the other hand, Tables 7 and 9 show that storage of 1990.8 m³ (1.5 m x 2.4 m channel section) was needed for a pumped low of 0.40 m³/s so that the water depth over the dry dock would not be higher than 10 mm from a rainfall event of 100 years return-period.
Pumped flow = 0.28 m³/s
rp(years) Water depths(cm) Volumes overflown (m³)
20 1.7 477
50 4.7 1314
100 7.3 2051
TH – There is not
Figure 11
Water depth and overflow volume for channels of 1.50 m x 2.40 m and rainfall events with a 100 years return-period.
Table 4
1.50 m x 1.00 m (V=829.5 m³) channel.
Table 5
1.50 m x 1.70 m (V=1410.2 m³) channel.
Pumped flow = 0.28 m³/s
rp (years) Water depths (cm) Volumes of overflow (m³)
20 TH TH
50 2.6 740
100 5.6 1561
TH – There is not
Pumped flow = 0.28 m³/s
rp (years) Water depths (cm) Volumes of overflow (m³)
20 NH NH
50 0.6 160
100 3.5 981
TH – There is not
Table 6
1.50 m x 2.40 m (V=1990 m³) canal.
Pumped flow = 0.40 m³/s
rp (years) Water depths (cm) Volumes of overflow (m³)
20 0.1 16
50 2.4 664
100 4.0 1122
TH – There is not
Table 7
1.50 m x 1.00 m (V=829.5 m³) canal.
0.0 1.0 2.0 3.0 4.0 5.0 6.0 7.0 8.0
0 50 100 150 200
0.280 0.300 0.330 0.350 0.400
1990 m3canals (1,50 x 2,40 m) RP = 100 years
Pumped flow (m3/s)
W
ater
de
pth
ov
er
t
h
e
yard
(cm
)
Rainfall duration (min)
0 200 400 600 800 1000 1200 1400 1600 1800 2000 2200
0 50 100 150 200
0.280 0.300 0.330 0.350 0.400
Rainfall duration (min)
W
ater
v
ol
ume
of
ov
erf
low
in
the
shi
pb
ui
ldi
ng
y
ard
(m
3) Pumped flow
(m3/s) 1990 m3canals (1,50 x 2,40 m)
Pumped flow = 0.40 m³/s
rp (years) Water depths (cm) Volumes of overflow (m³)
20 NH NH
50 NH NH
100 NH NH
TH – There is not
Table 9 1.50 m x 2.40 m (V=1990m³) canal.
5. Discussions
The analyses performed indicate that, for the same pumping system, the channel dimensions should be about 60 % increased while the annual risk of overlow is reduced about 5 times when rainfall events sized with a 100-year return-period are used, compared to the same system sized for rainfall events with a 20-year return-period.
On a 20-year horizon, estimated as these facilities lifetime, the probability of occurrence of overlow of a lume sized
for a 20 year return-period for events is 64%, 3.5 times greater compared to the probability of failure of the structure sized for 100 year return-period events (18 %).
Thus, it is recommended for struc-tures of the size of the Estaleiro Rio Grande dry dock:
• To size the channels and pumps system for rainfall events with a 100 year return-period;
• To adopt channels with a mean depth of 2.40 m and a width of 1.50 m;
• To use submersible pumps to drain storm water, prepared to pump up to 0.40 m³/s.
The authors also recommend that the maximum water depth accepted within the dry dock should not exceed 10 mm.
Finally, in general, it is suggested to use a parallel pump array to allow modulating low when less intense rainfall events occur, and thus reduce the number of pumping starts and extend the useful life of the pumps.
6. Conclusions and recommendations
The decision regarding the size of the pumping system and drainage/storage channels of a dry dock must be ruled by a set of premises and basic criteria that should be spelled out at the beginning of the project.
When developing an engineering solution, it is necessary to consider the hypothetical cost of paralyzing the activi-ties of a dry dock, because this might cost more than implementing the respective drainage system (including installing the
channels and pumping devices).
The incremental costs inherent to reducing the probability of occurrence of overlows may become very low, depend-ing on the magnitude of the costs of stop-ping and repairing the damage caused.
7. References
AZEVEDO NETTO, J. M., ALVAREZ, G. A. Manual de Hidráulica. (7. ed.) São
Paulo: Edgard Blücher, 1988. v. 1. 335 p.
BAPTISTA, M., LARA, M. Fundamentos de Engenharia Hidráulica. (2. ed.) Belo
Horizonte: Editora da UFMG, 2003. 437 p.
BERNARDES, J. Dique seco. 2014. 1 fotograia, color. Rio Grande, 2014. Disponível em: <www.agenciapreview.com/detalheImagem.asp?cod_foto=11104>. Acesso em 30 jan. 2014.
IPEA (Instituto de Pesquisa Econômica Aplicada). Ressurgimento da indústria naval no Brasil (2000-2013). Brasília, 2014. 480 p.
CEGLINSKI, J.P. Dique seco. 2014. 1 fotograia, color. Rio Grande, 2014. Disponível em: <www.portoriogrande.com.br/site/imprensa_midia_galerias.php>. Acesso em: 30 jan. 2014.
DAMÉ, R. C. F. et al. Comparação entre curvas intensidade-duração-frequência de Pumped flow = 0.40 m³/s
rp (years) Water depths (cm) Volumes of overflow (m³)
20 NH NH
50 0.3 74
100 2.3 652
TH – There is not
Received: 06 November 2014 - Accepted: 02 March 2016.
ocorrência de precipitação obtidas a partir de dados pluviográicos com aquelas es-timadas por técnicas de desagregação de chuva diária. Revista Brasileira de
Agro-ciência, Pelotas, v. 12, n. 4, p. 505-509, out./dez. 2006.
HOUGHTALEN, R.J., HWANG, NED H.C., AKAN, A.O. Fundamentals of
Hydraulic Engineering Systems. (4. ed.) U.S.A.: Ed. Pearson, 2010. 494 p.
PORTO, R.M. Hidráulica Básica. (2. ed.) São Paulo: Editora EESC-USP, 1999. 519 p.
TUCCI, C.E.M. (Org.). Hidrologia: ciência e aplicação. (3. ed.) Porto Alegre: Editora
da UFRGS/ ABRH, 2002. 943 p.
TUCCI, C.E.M. (Org.). Drenagem urbana. Porto Alegre: Editora da UFRGS/ABRH,