*e-mail: [email protected]
1. Introduction
Duplex (DSS) and superduplex stainless steels (SDSS) are materials used extensively in petrochemical industries due to elevated mechanical strength and high pitting corrosion resistance1. These characteristics are attributed to microstructural features, such as; grain reinement, approximately equal parts of austenite (γ) and ferrite (δ), and also to the alloying elements Cr, Mo and N dissolved in these phases2. However, during welding, heat treatment and hot forming operations, deleterious phase precipitation may compromise the use of these materials in severe service conditions.
The most dangerous and also the most studied intermetallic compound in austenitic-ferritic stainless steels is the sigma phase (σ), which can be formed by slow continuous cooling3,4 or by isothermal treatments5. According to published Temperature-Time-Transformation (TTT) diagrams1,6, the higher kinetics of precipitation occurs in the 800 – 950 °C range. Ferrite former elements, such as Cr, Mo and Si, increase the susceptibility of sigma phase formation in DSS and SDSS. Secondary austenite (γ2) can also be formed during thermal treatments. The precipitation can occur at ferrite/ferrite grain boundaries, as chromium nitrides particles, in association to sigma phase as divorced eutectoid (δ→γ2+σ), or even due to the growing of primary austenite7,8.
Besides γ2 and σ, the chi phase (χ) may also be formed in Mo containing steels heated in the 700 – 900 °C range9,10.
Although all these phases may cause the decrease of mechanical properties and corrosion resistance, σ may be considered the most dangerous. The kinetics of precipitation of deleterious compounds is a function of the chemical composition11 and grain size5.
For the reasons explained above, it is very important to characterize DSS and SDSS by electrochemical techniques to determinate the degree of sensitization and hence the susceptibility of deleterious phases precipitation. Nowadays one of the most employed techniques is the double loop electrochemical polarization reactivation test (DL-EPR). The development and optimization of a procedure based around this technique for assessing sensitization degree in DSS and SDSS is therefore of great interest. Generally for DSS, the electrolyte used is sulphuric acid (H2SO4), with the increase of KSCN and NaCl additions. Lopez et al.12,13 analyzed the inluence of σ phase precipitation on corrosion resistance in a DSS UNSS31803 sample aged at 675 °C and 900 °C by DL-EPR testing using a 2.00 M H2SO4 + 0.01 M KSCN + 0.50 M NaCl solution at 30 °C. These authors considered the material susceptible to intergranular corrosion when the degree of sensitization (DOS=Ir/Ia) was greater than 0.0512,13.
However, other researches14,15 were performed using different concentrations of HCl, taking into account the temperature effect. For instance, Amadou et al.14, evaluated the sensitization of UNS S31250 duplex stainless steels
Inluence of Deleterious Phases Precipitation in the Corrosion Resistance Measured by
Double Loop Electrochemical Polarization Reactivation Test in Superduplex Stainless Steel
Juan Manuel Pardala*, Sérgio Souto Maior Tavaresa, Guttemberg Chagas de Souzaa,
Maria da Penha Cindra Fonsecaa, Eduardo Ariel Ponziob, Marcelo Camargo Severo de Macedoc
aProgramas de Pós-Graduação em Engenharia Mecânica (PGMEC) e Montagem Industrial,
Universidade Federal Fluminense – UFF, Rua Passo da Pátria, 156, CEP 24210-240, Niterói, RJ, Brazil
bPrograma de Pós-Graduação em Química, Departamento de Físico-Química, Universidade
Federal Fluminense – UFF, Rua Outeiro de São João Batista, s/n, CEP 24020-141, Niterói, RJ, Brazil
cPrograma de Pós-Graduação em Engenharia Mecânica, Departamento de Engenharia Mecânica,
Universidade Federal do Espírito Santo – UFES, Rua Av. Fernando Ferrari, s/n, CEP 29060-970, Vitoria, ES, Brazil
Received: April 3, 2015; Revised: June 4, 2015
This work investigates the inluence of deleterious phases precipitation on the corrosion resistance of two wrought superduplex stainless steels UNS S32750 with similar composition, but different grain sizes. Isothermal treatments were carried out to introduce different amounts of deleterious phases, such as chi (χ), sigma (σ) and secondary austenite (γ2). The specimens were tested by double loop electrochemical potentiodynamic reactivation test (DL-EPR). The kinetics of precipitation in the two steels was different due to the difference of the grain sizes. The results show a correlation between the sensitization degrees, measured by DL-EPR, with the amount of deleterious phases precipitated.
(DSS) by using a solution with 33% H2SO4 + 0.3% HCl, at room temperature. These tests were performed at a potential scan rate of 2.5 mV s-1. Recently, Deng et al.15, demonstrated that the modiied DL-EPR measurement, using a solution of 33% H2SO4 + 0.1% HCl at 20 °C and scan rate of 2.5 mV s-1, could successfully characterize the interactions between precipitation, chromium depletion and intergranular corrosion with high sensitivity and reproducibility of lean DSS 2101. Hong et al.16 indicates that the optimum DL-EPR condition to evaluate sensitization degree (DOS) of SDSS UNS S32750 is in a 2 M H2SO4 + 1.5 M HCl solution with a scanning rate of 1.5 mV s–1 at a temperature of 30 °C.
Other researches were performed by continuous cooling in order to simulated heat affected zone in weld joints. Yang et al.17 studied the microstructure and corrosion behavior by DL-EPR in the simulated heat affected zone of 2205 DSS by using a thermo-mechanical simulator. Pardal et al.3 analyzed the DOS behaviour in specimens of 2505 SDSS obtained by different continuous cooling treatments. Both researches were performed using the same solution proposed by Lopez et al.12,13 using a scan rate of 1 mV s–1.
The purposes of this work were, in the irst instance, to determinate the best temperature at which the premature deleterious phases precipitation can be detected, by using the DL-EPR technique with a 2.00 M H2SO4 + 0.01 M KSCN + 0.50 M NaCl solution with a sweep rate of 1.0 mV.s–1; secondly, to determine a correlation of deleterious phases precipitation by DL-EPR testing and optical microscopy analysis in specimens that were isothermally heat treated. Also of interest was the comparative analysis of two SDSS with similar chemical compositions, but different grain sizes.
2. Experimental
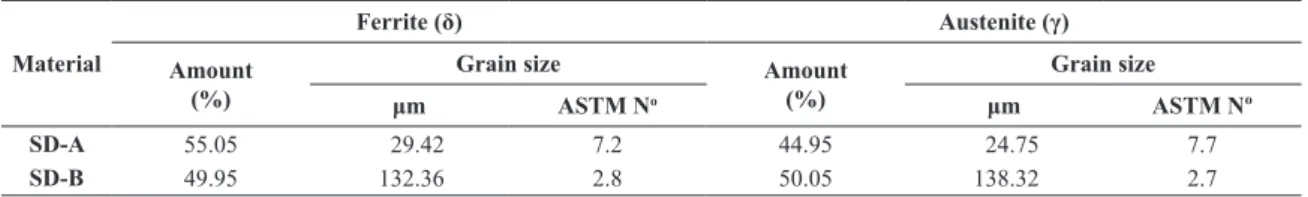
The compositions of the two materials studied are shown in Table 1. SD-A and SD-B have similar chemical compositions, both itting the UNS S32750 speciication. Austenitic and ferritic volumetric fraction and grain sizes of each material are shown in Table 2. The volume fractions of phases were measured by image analysis of the specimens prepared with Beraha’s reagent (100 ml H2O + 20 ml HCl + 0.3 - 0.6 g potassium metabissulite), and grain sizes were determined by electron backscattered scanning diffraction (EBSD), as reported in a previous work5. SD-A and SD-B
have different grain sizes because they were processed by different ways. The SD-A (ine grained) was cut from a hot rolled and solution treated sheet with 9.5 mm thickness. The SD-B specimen was cut from a forged and solution treated bar with 203 mm of diameter. The hot forging resulted in a much coarser grain size of ferrite and austenite than the hot rolling process.
The specimens were cut, 15 × 10 × 5 mm, and machined from the as received materials. After this, the specimens were isothermally treated at 800 °C, 850 °C, 900 °C and 950 °C for 5, 15, 30, 45 and 60 minutes followed by water cooling.
The deleterious phase quantiication was performed by image analysis of the specimens prepared with electrolytic etching in 15% KOH solution (3V, 12 s). The images were obtained in a light optical microscope with 240X, 475X and 950X magniications. The quantiications were performed with Image Tools software18 analyzing 20 ields per condition.
The DL-EPR tests were performed to evaluate the degree of sensitization due to the precipitation of deleterious phases. These tests were conducted in 2.00 M H2SO4 + 0.01 M KSCN + 0.50 M NaCl solution at room temperature, 40 °C and 60 °C. As reported, this electrolyte had been previously used to study the effects of sigma phase precipitation in duplex stainless steels12,13. The tests were conducted in a three electrode cell with working electrode, saturated calomel electrode (SCE) as a reference, and Pt foil as a counter electrode. Working electrodes were constructed with each SDSS sample embedded in epoxy resin with cooper wire as an electric contact. The working electrodes were ground sequentially with 100, 220, 320 and 400 emery papers, degreased with alcohol and cleaned in water. After this, the edges of the samples were protected to avoid crevices. The test was initiated after the open circuit potential (EOC) had been achieved, in approximately 30 minutes. The potential was varied in the anodic direction with a sweep rate of 1.0 mV.s–1 until 0.3 V
SCE (in relation with SCE) for all the conditions analyzed. Then, the scan was reversed, maintaining the same sweeping rate in the cathodic direction until it reached the EOC value again. The degree of sensitization (DOS) was evaluated by two methodologies. The irst one was by the Ir/Ia ratio, where Ia is the maximal activation peak current of the anodic scan and Ir is the maximal reactivation peak current observed in the reversed scan. The second method proposed was by the Qr/Qa charges ratio, where Qa is the integrated current
Table 1. Chemical compositions of the materials studied.
Material %wt. (%Fe = balance)
Cr Ni Mo Mn Si N Cu W C P S
SD-A 24.57 6.68 3.75 0.83 0.34 0.28 0.25 --- 0.02 0.026 0.000
SD-B 24.80 6.75 3.79 0.78 0.54 0.27 0.10 0.04 0.019 0.026 0.001
Table 2. Percentages of phases and grain sizes in materials SDA and SDB as received.
Material
Ferrite (δ) Austenite (γ)
Amount (%)
Grain size Amount
(%)
Grain size
μm ASTM No μm ASTM Nº
SD-A 55.05 29.42 7.2 44.95 24.75 7.7
under the peak over the time in the anodic scan and Qr is the integrated current under the peak over the time observed in the reversed scan19. The second method was proposed, in this work, because of the appearance of several peaks in the activation and reactivation scans. After the tests, some specimens were observed in the light optical microscope (LOM). For a better characterization, the samples were slightly polished with alumina 0.1 μm in aqueous suspension before examination.
The DL-EPR test was also performed using a portable cell in order to develop it for ield application. A small cell was ixed to the specimen surface by cyanoacrylate-based adhesive. After this, hot-melt thermoplastic adhesive was used for reinforcement of the base cell. Finally, after pouring the solution into the cell, a platinum wire counter electrode was carefully screwed around the saturated calomel electrode (SCE) and immersed in the electrolytic cell. Figure 1 shows schematically the cell ixed on the surface of the specimen and the disposition of electrodes for this ield analysis.
3. Results
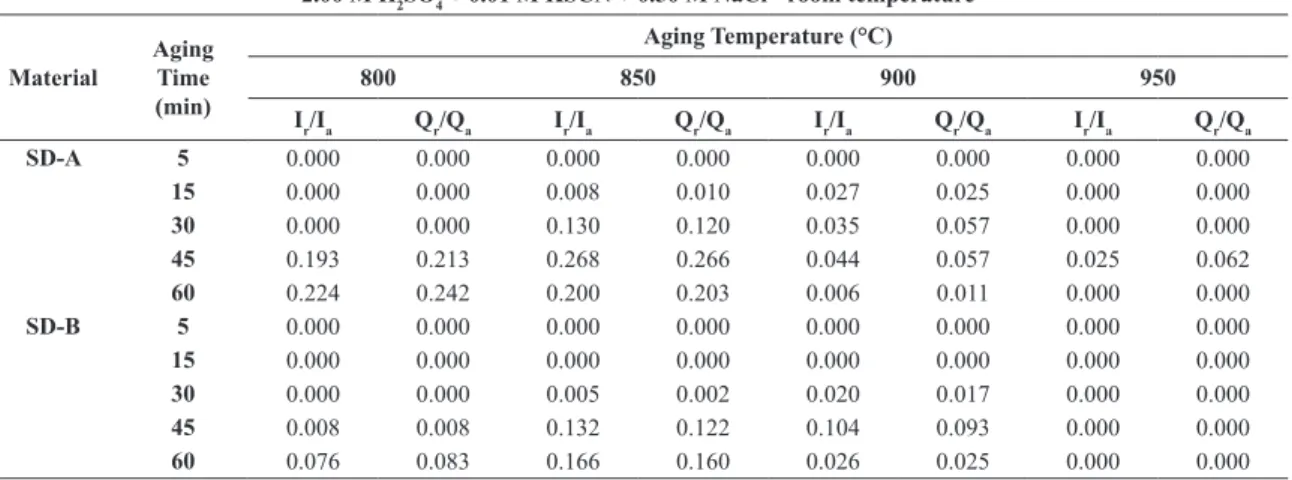
DL-EPR tests were performed on the as received materials at room temperature (25 °C), and did not show reactivation peaks. The Ir/Ia and Qr/Qa values obtained for different conditions of the isothermal treatment are shown in Figures 2 and 3 respectively, with similar behaviour in the SD-A and SD-B steels. In these igures, the dashed line indicates the limit of Ir/Ia equal to 0.05, as proposed by Lopez et al.12,13 for DSS tested at 30 °C. In the ine grained SD-A steel, higher reactivation peaks were observed in the specimens aged at 800 °C and 850 °C. In SD-B steel the higher peaks were observed in the specimens aged at 800, 850 and 900 °C, and the intensities were lower than in the SD-A specimens. It can be also be observed that the aging time necessary to reach the limit of Ir/Ia = 0.05 is lower in the SD-A specimens than in SD-B steel specimens. In specimens of the SD-A aged at 850 °C this time was approximately 20 minutes, while in the SD-B specimens aged at 850 and 900 °C this time was approximately 36 minutes. The explanation is that the decrease of grain size enhances the kinetics of precipitation of deleterious phases, i.e. increases the sensitization susceptibility of the alloy. Table 3 summarizes the results of Ir/Ia and Qr/Qa from Figures 2 and 3.
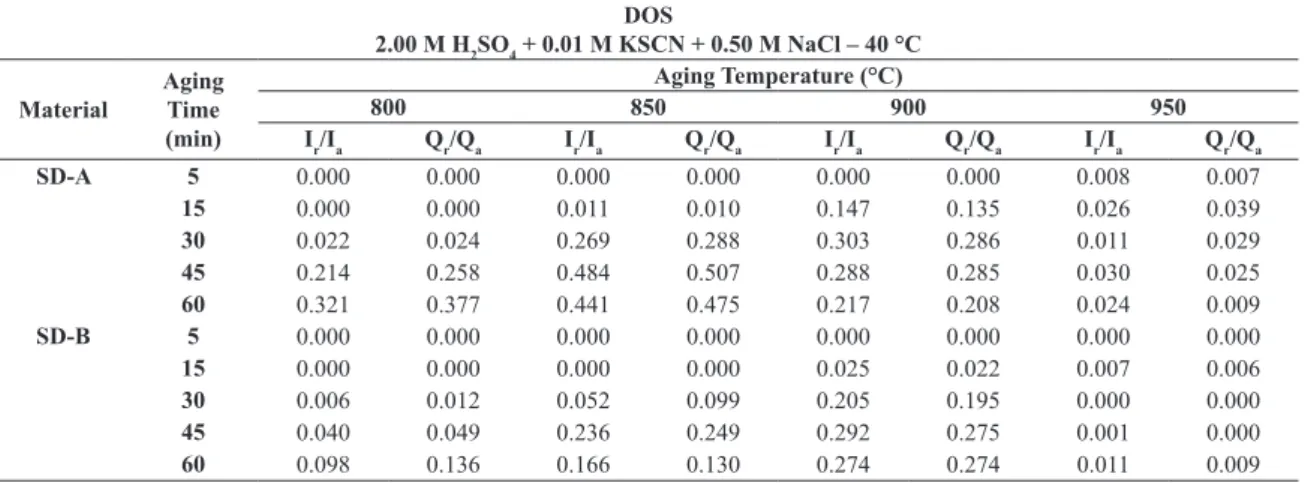
The DL-EPR test was originally developed to evaluate the intergranular corrosion resistance of austenitic stainless steels (ASS) of type AISI 304, using a solution of 0.5 M H2SO4 + 0.01 M KSCN at room temperature13. For more corrosion resistant materials, more aggressive test solutions and/or higher temperatures must be employed, although the DOS may also be inluenced by the sweep rate used. A second set of experiments were performed at 60 °C, however, in these tests reactivation peaks were detected in the as received samples of both materials (Figure 4), which means that the electrolyte was too aggressive. After several experiments it was found that 40 °C was the most suitable temperature for testing the material under these conditions, because the DL-EPR curves showed no reactivation peaks in the as received condition (solution treatment) for both materials. Furthermore, tests performed at several heat treatment conditions showed a higher sensitivity to the
Figure 1. Cell for portable and ield analysis: 1 – Potentiostat -
galvanostat; 2 – Saturated calomel electrode (SCE); 3 – Counter
electrode; 4 – Cell ixed on the surface of the specimen.
Figure 2. Ir/Ia and Qr/Qa versus aging time for SD-A in 2.00 M H2SO4
+ 0.01 M KSCN + 0.50 M NaCl solution test at room temperature.
Figure 3. Ir/Ia and Qr/Qa versus aging time for SD-B in 2.00 M H2SO4 + 0.01 M KSCN + 0.50 M NaCl solution test at room temperature.
Figure 4. DL-EPR curves of un-aged SD-A and SD-B tested at
60 °C in 2.00 M H
precipitation of deleterious phases than tests performed at room temperature, as shown in Figures 5 and 6. In this test condition the behaviour of the Ir/Ia and Qr/Qa ratios were very similar, as summarized in Table 4. For this reason only the Qr/Qa ratio versus deleterious phases precipitated are represented in Figures 7 and 8 and Table 5 for SD-A and SD-B. Additionally, as already observed in the tests at room temperature, the tests at 40 °C showed that the increase of Ir/Ia and Qr/Qa was faster in SD-A than in SD-B, due to its smaller grain size.
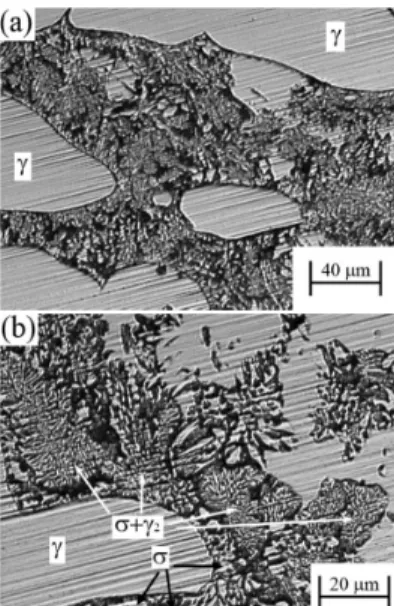
Figures 9 and 10 show the microstructures of SD-A aged at 850 °C for 60 minutes and SD-B aged at 850 °C for 45 minutes, respectively. The microstructures were revealed by DL-EPR tests at room temperature and 40 °C. In Figures 9a, 10a and b the arrows indicate the formation of the deleterious phases sigma (σ) and secondary austenite (γ2), which resulted from the eutectoid decomposition of ferrite (δ). The arrows in Figure 9b point the cavities formed in the eutectoid σ + γ2 structures during the DL-EPR test.
As shown in a recent work7, depending on the conditions of the isothermal treatment, the σ phase may be formed from the δ as a result of lamellar eutectoid decomposition, or independently, as large plates. Figure 11 shows the microstructure of SD-B aged at 900 °C for 45 minutes, observed after the DL-EPR test at room temperature. In these images it is possible to observe the formation of σ phase from the decomposition of ferrite into lamellar eutectoid, resulting in numerous sites of low resistance to corrosion.
In the specimens of SD-A and SD-B treated at 850 and 900 °C for long periods of time was observed a reduction in the Ir/Ia and Qr/Qa values measured by DL-EPR. This phenomenon maybe associated to the formation of thicker σ lamellae, as well as the formation and independent γ2 particles precipitation
7. Besides, the high temperature and long aging time also promotes the Cr and Mo diffusion, reducing the amount of chromium and molybdenum depleted boundaries, resulting in a lower value of Ir/Ia and Qr/Qa. This healing process was reported by Angelini et al.20.
A clear example of desensitization process is shown by specimens aged at 950 °C, Figures 7 and 8. At this temperature,
Table 3. Ir/Ia and Qr/Qa values obtained for SD-A and SD-B in 2.00 M H2SO4 + 0.01 M KSCN + 0.50 M NaCl solution test at room
temperature.
DOS
2.00 M H2SO4 + 0.01 M KSCN + 0.50 M NaCl - room temperature
Material Aging Time
(min)
Aging Temperature (°C)
800 850 900 950
Ir/Ia Qr/Qa Ir/Ia Qr/Qa Ir/Ia Qr/Qa Ir/Ia Qr/Qa
SD-A 5 0.000 0.000 0.000 0.000 0.000 0.000 0.000 0.000
15 0.000 0.000 0.008 0.010 0.027 0.025 0.000 0.000
30 0.000 0.000 0.130 0.120 0.035 0.057 0.000 0.000
45 0.193 0.213 0.268 0.266 0.044 0.057 0.025 0.062
60 0.224 0.242 0.200 0.203 0.006 0.011 0.000 0.000
SD-B 5 0.000 0.000 0.000 0.000 0.000 0.000 0.000 0.000
15 0.000 0.000 0.000 0.000 0.000 0.000 0.000 0.000
30 0.000 0.000 0.005 0.002 0.020 0.017 0.000 0.000
45 0.008 0.008 0.132 0.122 0.104 0.093 0.000 0.000
60 0.076 0.083 0.166 0.160 0.026 0.025 0.000 0.000
Figure 5. Ir/Ia and Qr/Qa versus aging time for SD-A in 2.00 M H2SO4 + 0.01 M KSCN + 0.50 M NaCl solution test at 40 °C.
Figure 6. Ir/Ia and Qr/Qa versus aging time for SD-A in 2.00 M H2SO4 + 0.01 M KSCN + 0.50 M NaCl solution test at 40 °C.
to observe the γ2 plates precipitated independently, as well as large σ plates indicated by arrows. Another arrows point shows regions with low corrosion resistance.
Several reactivation curves showed the presence of two or more peaks and for that reason, measurements of Qr/Qa ratios were performed to verify some inluences in the Ir/Ia, where maximum Ir and Ia values were adopted. As shown,
for the different conditions studied, the obtained results were very similar. According to Číhal et al.21, the presence of more than one peak is related to different concentrations of chromium depleted zones. Goodwin et al.22 attributed the second reactivation peak to the sigma phase precipitation in a DSS. In this sense, Wu & Tsai23 mentioned that in Ni Alloy 600 these peaks are related to pitting corrosion, intergranular
Table 4. Ir/Ia and Qr/Qa values obtained for SD-A and SD-B in 2.00 M H2SO4 + 0.01 M KSCN + 0.50 M NaCl solution test at 40 °C.
DOS
2.00 M H2SO4 + 0.01 M KSCN + 0.50 M NaCl – 40 °C
Material Aging Time
(min)
Aging Temperature (°C)
800 850 900 950
I
r/Ia Qr/Qa Ir/Ia Qr/Qa Ir/Ia Qr/Qa Ir/Ia Qr/Qa
SD-A 5 0.000 0.000 0.000 0.000 0.000 0.000 0.008 0.007
15 0.000 0.000 0.011 0.010 0.147 0.135 0.026 0.039
30 0.022 0.024 0.269 0.288 0.303 0.286 0.011 0.029
45 0.214 0.258 0.484 0.507 0.288 0.285 0.030 0.025
60 0.321 0.377 0.441 0.475 0.217 0.208 0.024 0.009
SD-B 5 0.000 0.000 0.000 0.000 0.000 0.000 0.000 0.000
15 0.000 0.000 0.000 0.000 0.025 0.022 0.007 0.006
30 0.006 0.012 0.052 0.099 0.205 0.195 0.000 0.000
45 0.040 0.049 0.236 0.249 0.292 0.275 0.001 0.000
60 0.098 0.136 0.166 0.130 0.274 0.274 0.011 0.009
Figure 7. Qr/Qa versus deleterious phases for SD-A in 2.00 M H2SO4
+ 0.01 M KSCN + 0.50 M NaCl solution test at 40 °C.
Figure 8. Qr/Qa versus deleterious phases for SD-B in 2.00 M H2SO4
+ 0.01 M KSCN + 0.50 M NaCl solution test at 40 °C.
Table 5. Deleterious phases precipitated (DP) percentage and Qr/Qa values obtained for SD-A and SD-B in 2.00 M H2SO4 + 0.01 M KSCN
+ 0.50 M NaCl solution test at 40 °C.
DP and DOS
2.00 M H2SO4 + 0.01 M KSCN + 0.50 M NaCl – 40 °C
Material Aging Time
(min)
Aging Temperature (°C)
800 850 900 950
DP Qr/Qa DP Qr/Qa DP Qr/Qa DP Qr/Qa
SD-A 5 4.11 0.000 8.69 0.000 11.91 0.000 11.77 0.007
15 9.09 0.000 12.06 0.010 16.42 0.135 17.38 0.039
30 11.31 0.024 24.30 0.288 29.18 0.286 23.51 0.029
45 18.14 0.258 33.02 0.507 31.97 0.285 26.51 0.025
60 25.99 0.377 38.03 0.475 35.22 0.208 27.52 0.009
SD-B 5 0.00 0.000 0.00 0.000 1.00 0.000 5.41 0.000
15 0.83 0.000 3.47 0.000 4.62 0.022 8.70 0.006
30 1.52 0.012 6.47 0.099 20.41 0.195 16.88 0.000
45 5.49 0.049 16.59 0.249 33.82 0.275 28.86 0.000
corrosion and matrix corrosion with the decreasing potential. In this context, Figure 13 shows the DL-EPR cycles where the highest Ir/Ia and Qr/Qa ratios were obtained, indicating two reactivation peaks at 800 and 850 °C in SD-A and SD-B. The specimens of SD-A and SD-B treated at 800 and 850 °C showed that reactivation curves as two distinct peaks, but this phenomenon tends to disappear in specimens aged at 900 °C. In specimens aged at 950 °C the two reactivation peaks were not so clearly observed, only a small hump could be noted.
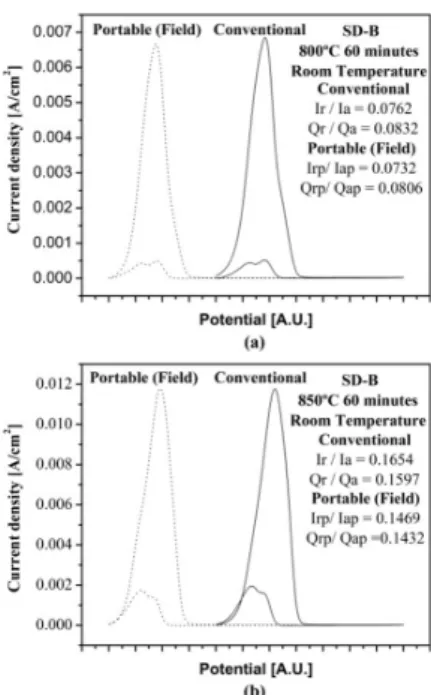
DL-EPRs were also tested in a portable cell, as shown in Figure 1, envisaging its use as a ield and non-destructive analysis. Two test conditions were performed, in specimens of SD-B aged at 800 °C and 850 °C for 60 minutes. The results were very close to those obtained in the conventional cell, as shows in Figure 14.
Figure 9. Microstructures observed after DL-EPR tests in SD-A
aged at 850 °C for 60 min.
Figure 10. Microstructures observed after DL-EPR tests in SD-B
aged at 850 °C for 45 min.
Figure 11. SD-B aged at 900 °C for 45 minutes, after DL-EPR test
at room temperature.
Figure 12. SD-A aged at 950 °C for 45 minutes, after DL-EPR test
at room temperature.
Figure 13. DL-EPR cycles of (a) SD-A and (b) SD-B with Ir/Ia
and Qr/Qa ratios. 2.00 M H2SO4 + 0.01 M KSCN + 0.50 M NaCl
4. Conclusions
In the present study the sensitization of two superduplex steels with similar composition (UNS S32750) but different grain sizes (SD-A-ine grained and SD-B-coarse grained)
was studied by means of DL-EPR tests and microscopy. The main conclusions are:
The DL-EPR test for both steels analyzed was optimized by the use of an electrolyte of 2.00 M H2SO4 + 0.01 M KSCN + 0.5 M NaCl solution at 40 °C.
Specimens treated at 850 °C and 900 °C for long periods of time showed a decrease of the degree of sensitization. This process of desensitization can be explained by two parallel mechanisms. The irst one is related to the formation of thick lamellar of σ and independent γ2 particles precipitation which has higher corrosion resistance than formed by divorced lamellar eutectoid decomposition. The other one is attributed to Cr and Mo diffusion known as healing. These processes were even more evident in specimens aged at 950 °C, whose Qr/Qa values remained below the critical value of 0.05.
The Ir/Ia and Qr/Qa ratios presented similar behaviour in all conditions studied.
Two reactivation peaks were observed in specimens aged at 800 and 850 °C. These features in the peak reactivation can be attributed to deleterious phases precipitated and/or changes in their morphology that promoted different concentration of chromium depleted zones.
DL-EPR tests can be used as a portable test for ield analysis. Due to the dificulty of achieving the test temperature of 40 °C, it is advisable to use a more aggressive electrolyte to obtain results with greater sensitivity.
Acknowledgements
The authors acknowledge of the Brazilian research agencies (CAPES, FAPERJ and CNPq) for inancial support.
Figure 14. Comparison between DL-EPR cycles obtained in a
conventional cell and in a portable cell for different aging time for SD-B: (a) 800 °C/60 min.; (b) 850 °C/60 min. 2.00 M H2SO4 +
0.01 M KSCN + 0.50 M NaCl solution test at room temperature.
References
1. Gunn RN. Duplex stainless steels: microstructure, properties and applications. Cambridge: Abington Publishing; 2003.
2. Muthupandi V, Bala Srinivasan P, Seshadri SK and Sundaresan S. Effect of weld metal chemistry and heat input on the structure and properties of duplex stainless steel welds. Materials Science and Engineering A. 2003; 358(1-2):9-16. http://dx.doi. org/10.1016/S0921-5093(03)00077-7.
3. Pardal JM, Tavares SSM, Cindra Fonseca MP, Silva MR and Ferreira MLR. Study of deleterious phase precipitation under continuous cooling of superduplex stainless steel UNS S32750. Materials Science and Technology. 2012; 28(3):295-302. http:// dx.doi.org/10.1179/1743284711Y.0000000040.
4. Chen TH and Yang JR. Effects of solution treatment and continuous
cooling on σ-phase precipitation in a 2205 duplex stainless steel.
Materials Science and Engineering A. 2001; 311(1-2):28-41. http://dx.doi.org/10.1016/S0921-5093(01)00911-X. 5. Pardal JM, Tavares SSM, Fonseca MC, Souza JA, Côrte RRA
and Abreu HFG. Influence of the grain size on deleterious phase precipitation in superduplex stainless steel UNSS32750. Materials Characterization. 2009; 60(3):165-172. http://dx.doi. org/10.1016/j.matchar.2008.08.007.
6. Sieurin H and Sandström R. Sigma phase precipitation in duplex stainless steel 2205. Materials Science and Engineering A. 2007; 444(1-2):271-276. http://dx.doi.org/10.1016/j.msea.2006.08.107. 7. Pardal JM, Tavares SSM, Fonseca MPC, Souza JA, Vieira
LM and Abreu HFG. Deleterious phases precipitation on
superduplex stainless steel UNS S32750: Characterization by light optical and scanning electron microscopy. Materials Research. 2010; 13(3):401-407. http://dx.doi.org/10.1590/ S1516-14392010000300020.
8. Ramirez AJ, Lippold JC and Brandi SD. The relationship between chromium nitride and secondary austenite precipitation in duplex stainless steels. Metallurgical and Materials Transactions. A, Physical Metallurgy and Materials Science. 2003; 34(8):1575-1597. http://dx.doi.org/10.1007/s11661-003-0304-9. 9. Escriba DM, Materna-Morris E, Plaut RL and Padilha AF.
Chi-phase precipitation in a duplex stainless steel. Materials Characterization. 2009; 60(11):1214-1219. http://dx.doi. org/10.1016/j.matchar.2009.04.013.
10. Voronenko BI. Austenitic-ferritic stainless steels: a state of the art review. Metal Science and Heat Treatment. 1997; 39(10):428-437. http://dx.doi.org/10.1007/BF02484228. 11. Maehara Y, Ohmori Y, Murayama J, Fujino N and Kunitake
T. Effects of alloying elements on σ-phase precipitation in δ-γ
duplex phase stainless steels. Metal Science. 1983; 17(11):541-548. http://dx.doi.org/10.1179/030634583790420457. 12. Lopez N, Cid M, Puiggali M, Azkarate I and Pelayo A. Application
of double loop electrochemical potentiodynamic reactivation test to austenitic and duplex stainless steels. Materials Science and Engineering A. 1997; 229(1-2):123-128. http://dx.doi. org/10.1016/S0921-5093(97)00008-7.
13. Lopez N, Cid M and Puiggali M. Influence of σ-phase on
stainless steel. Corrosion Science. 1999; 41(8):1615-1631. http://dx.doi.org/10.1016/S0010-938X(99)00009-8. 14. Amadou T, Sidhom H and Braham C. Double loop electrochemical
potentiokinetic reactivation test optimization in checking of duplex stainless steel intergranular corrosion susceptibility. Metallurgical and Materials Transactions. A, Physical Metallurgy and Materials Science. 2004; 35(11):3499-3513. http://dx.doi. org/10.1007/s11661-004-0187-4.
15. Deng B, Jiang Y, Xu J, Sun T, Gao J, Zhang L, et al. Application
of the modiied electrochemical potentiodynamic reactivation
method to detect susceptibility to intergranular corrosion of a newly developed lean duplex stainless steel LDX2101. Corrosion Science. 2010; 52(3):969-977. http://dx.doi.org/10.1016/j. corsci.2009.11.020.
16. Hong J, Han D, Tan H, Li J, Jiang Y, Deng B, et al. Evaluation of aged duplex stainless steel UNS S32750 susceptibility to intergranular corrosion by optimized double loop electrochemical potentiokinetic reactivation method. Corrosion Science. 2013; 68:249-255. http://dx.doi.org/10.1016/j.corsci.2012.11.024. 17. Yang Y, Yan B, Li J and Wang J. The effect of large heat input
on the microstructure and corrosion behavior of simulated heat affected zone in 2205 duplex stainless steel. Corrosion Science. 2011; 53(11):3756-3763. http://dx.doi.org/10.1016/j. corsci.2011.07.022.
18. University of Texas Health Science Center - UTHSCSA. Department of Dental Diagnostic Science. Image Tool Version 3.0. San Antonio, Texas. Available from: <http://compdent. uthscsa.edu/dig/itdesc.html>. Access in: 12/12/2014. 19. British Standards Institution - BSI. BS EN ISO 12732: corrosion
of metals and alloys: electrochemical potentiokinetic reactivation
measurement using the double loop method (based on Čihal’s
method). London; 2008.
20. Angelini E, De Benedetti B and Rosalbino F. Microstructural evolution and localized corrosion resistance of an aged superduplex stainless steel. Corrosion Science. 1999; 55(6):1351-1367.
21. Číhal V, Lasek S, Blahetová M, Kalabisová E and Krhutová Z.
Trends in the Electrochemical Polarization Potentiodynamic Reactivation Method – EPR. Chemical and Biochemical Engineering Quarterly. 2007; 21:47-54.
22. Goodwin SJ, Quayle B and Noble FW. Polarization behavior of austenitic and duplex stainless steels in the double loop reactivation test. Corrosion. 1987; 43(12):743-747. http:// dx.doi.org/10.5006/1.3583863.