Evaluation of the Low Corrosion Resistant Phase Formed During
the Sigma Phase Precipitation in Duplex Stainless Steels
Darlene Yuko Kobayashi
a, Stephan Wolynec*
baCentro Tecnológico da Marinha em São Paulo, 05598-900 São Paulo - SP, Brazil bDepartamento de Engenharia Metalúrgica e de Materiais, Escola Politécnica da
Universidade de São Paulo, 05508-900 São Paulo - SP, Brazil
Received: March 19, 1999; Revised: July 5, 1999
The duplex stainless steels, having a volumetric fraction of 50% ferrite and 50% austenite, conciliate high corrosion resistance with good mechanical properties. But, in many circumstances different phase transformations may occur, such as that responsible for sigma phase precipitation, which make the steel susceptible to localized corrosion. During the sigma phase precipitation a new austenitic phase is formed with a very low corrosion resistance. In the present research the composition of this new austenitic phase was evaluated in four duplex stainless steels, with different Mo, N and Cu contents. After the solution anneal at 1050 °C, samples of these steels were aged at 850 °C during 1 h and 5 h for sigma phase precipitation. Using the ferritoscope and an image analyzer it was possible to determine the volumetric fractions of ferrite and sigma phase, respectively, while those of austenite and the new austenitic phase were determined by difference to 100% volume. Finally, by using mass balance it was possible to determine theoretically the composition of the new austenitic phase. This phase is poor in Cr and Mo free, which explains its poor corrosion resistance.
Keywords: duplex stainless steels, sigma phase, selective corrosion, localized corrosion
1. Introduction
The duplex stainless steels are Fe-Cr-Ni alloys present-ing an approximate volumetric fraction of 50% ferrite (α) and 50% austenite (γ) in their microstructure. Their main feature is that they compromise the favorable corrosion resistance of the austenitic stainless steels with good me-chanical properties.
Notwithstanding these advantages, duplex stainless steels are susceptible to the precipitation of additional phases that affect both the corrosion and the mechanical properties. These phases may be formed during the solidi-fication of the alloy or in the subsequent heat treatments or plastic deformation processes, or even due to the aging processes during its use, causing a marked effect upon the workability and the useful life of the material. One of the possible phases to be formed is the sigma phase, a hard and brittle intermetallic compound, rich in Cr and Mo, which is formed from the ferrite.
The sigma phase in stainless steels is an intermetallic compound, non-magnetic1,2, with a complex tetragonal structure, and when present has deleterious effects upon both the mechanical and the corrosion properties3.
Bain and Griffth1 first detected this phase in 1927, during their systematic investigation of Fe-Cr-Ni alloys. They found, in certain composition ranges, the presence of a hard and brittle phase, which was responsible for the sample fracture during the hardness testing.
In most of the duplex stainless steels this phase contains Fe, Cr and Mo, and it is formed between 600 °C and 950 °C, its precipitation being faster between 700 °C and 900 °C. The embrittlement of some alloys due to the sigma phase precipitation may occur in very short times, of the order of 3 min2,4.
Brandi and Padilha5 and Maehara et al.6 found during the sigma phase precipitation in duplex stainless steels that as the amount of sigma phase increases the amount of ferrite decreases, until its total consumption. From this it was concluded that the sigma phase is formed from the ferrite. The proposed mechanism for this formation5,6 is the eucte-toid decomposition of ferrite according to the reaction:
ferrite → sigma + austenite (1)
There is a consensus between several researchers4-9 that the sigma phase nucleation takes place at the austenite/fer-rite interface and then grows towards the feraustenite/fer-rite.
Brandi and Padilha5 and Barbosa et al.7 found that initially the sigma phase precipitates as a film, forming a halo at the austenite/ferrite interface. At temperatures of the order of 700 °C to 800 °C, this film becomes thicker until an austenite formation at the growing front occurs, allowing the cooperation for the lamellar euctetoid growth. For higher temperatures the setting of a cooperative growth is more difficult, because this would imply in the consump-tion of the thermodynamic potential to form the sigma/austenite interface. Moreover, at higher tempera-tures the atoms can diffuse to larger distances, which would favor the formation of a massive sigma phase, that is, of a divorced euctetoid7.
The sigma phase growth from ferrite instead of austenite occurs because the sigma phase is rich in ferritizing elements and the diffusion in ferrite is faster than in austenite5.
The harmful effect of sigma phase upon corrosion re-sistance of duplex stainless steels was reported in several works10-22. This effect has been evaluated through different tests, such as general corrosion tests12, pitting potential tests12,14,15,17,19, crevice corrosion tests17, intergranular cor-rosion tests16,18-20 and stress corrosion tests15. Moreover, this effect has been of great concern in welding of duplex stainless steels, because during this process the sigma phase is formed in the heat affected zones (HAZ)13,21,22. Leaks in pipelines produced with this type of steel were reported to occur in these zones21.
According to Truman and Pirt11 this effect is a conse-quence of chromium and molybdenum content decrease in the matrix phases, because the sigma phase is considerably richer in these elements than either the ferrite or austenite. Adhe et al.19 proposed that this decrease is confined to regions adjacent to sigma phase. Wilms et al.17, on the other hand, observed that the localized corrosion starts next to the sigma phase in the newly formed secondary austenite.
Although the sigma phase has been considered ex-tremely harmful to the corrosion resistance of the duplex stainless steels, the available information about its magni-tude and extent is limited. Thus, it was decided to undertake a detailed investigation of the influence that the presence of this phase in four different duplex stainless steels has upon their microstructure and the chemical composition of phases, and on how these parameters are related to the corrosion of these materials in a 3.5% NaCl solution.
2. Materials and Methods
In present research the following duplex stainless steels were investigated: 3RE60 (UNS S31500), AV2205 (UNS S31803), UR50 (UNS S32404) and UR45N. The testing samples were removed from 3 mm to 6 mm thick rolled sheets. The chemical composition of these steels, supplied by the manufacturer, is given in Table 1.
All materials were submitted to solution anneal at 1050 °C for 30 min, followed by cooling in water. After this they were submitted to a heat treatment at 850 °C for 1 h and 5 h, with the purpose to precipitate the sigma phase. The corrosion resistance of these steels was evaluated by cyclic potentiodynamic polarization curves in order to meas-ure their pitting potential and to identify the possible nuclea-tion sites of the pits. These tests were performed at room temperature in a 3,5% NaCl aqueous solution, with a scanning rate of 1 mV/s started 5 min after the immersion of the sample inside the solution. In the testing cell, with a 700-mL capacity, a graphite counter electrode and a saturated calomel reference electrode (SCE) were used. The testing samples were submit-ted to two different surface finishes, namely:
• abrasion with silicon carbide paper to the grade 600 for pitting corrosion determination, and
• polishing with diamond paste to the grade 1 µm for preferential corrosion sites determination with the scanning electron microscope (SEM).
At the SEM both the primary and the secondary electron images were determined. The first, which are more sensi-tive to the nature of the existing elements, were used to identify the different phases in the samples, while the latter, which are more sensitive to the topography of the surface, were used to observe the corrosion morphology.
The individual phases were analyzed with an energy dispersion system (EDS) coupled to the SEM, displaying an analytical beam diameter of about 5 µm. This implies that the analysis of phases with sizes smaller than this value is unreliable.
The volumetric percentage of α phase was measured with a ferritoscope. Since there are only two phases in the investigated alloys, the volumetric percentage of γ phase was determined by difference between 100% and the volu-metric percentage of the α phase.
After the heat treatment the alloys presented three phases: ferrite (α), sigma (σ) and austenite (γ). The γ phase
Table 1. Chemical composition of investigated alloys (in wt.%).
Alloys Cr Ni Mo N Cu Mn Si C P S
UR45N 22.52 5.77 2.81 0.144 0.08 1.78 0.47 0.02 0.028 0.009
UR50 22.35 6.10 2.78 0.083 1.06 1.33 0.61 0.025 0.030 0.008
AV2205 21.93 5.65 3.17 0.188 0.13 1.48 0.48 0.03 0.020 0.008
can be divided in two: the one that was originally present in the alloy, that will be named as initial austenite (γin), and
the austenite provided by the euctetoid decomposition of ferrite [Eq. (1)], that will be named as new austenite (γnew).
In order to make easier the data handling, the α phase in the solution annealed alloy will be named as initial ferrite (αin)
and after the heat treatment as final ferrite (αfinal).
The amount of each of the above phases was obtained as follows:
• final ferrite (αfinal): measured with the ferritoscope; • sigma (σ): measured with an image analyzer
(quan-titative metallography);
• austenite (γin and γnew): the amount of γin is that of the
austenite in the solution annealed alloy; the amount of γnew was calculated using the following
relation-ship:
%γin + %γnew + %αfinal + %σ = 100% (2)
where %γin, %γnew, %αfinal and %σ are the volumetric
percentages of the respective phases. In the above equation all terms are known with the exception of %γnew, so that:
%γnew = 100% - (%γin + %αfinal + %σ) (3)
3. Results
3.1. Microstructure of the alloys
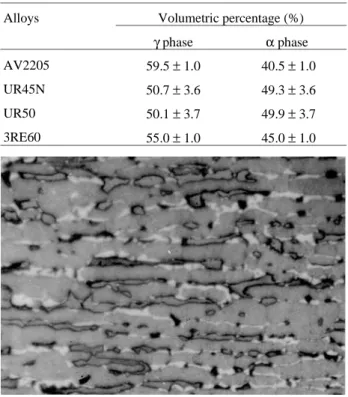
The Fig. 1 is a micrograph of the AV2205 alloy, after solution anneal at 1050 °C during 30 min. This micrograph is typical of all the other investigated alloys, where the clearer phase is the austenite and the darker phase is the ferrite. It is observed that both austenite and ferrite form lamellar like microstructure, which was confirmed by examining the other two orthogonal planes to that shown in Fig. 1.
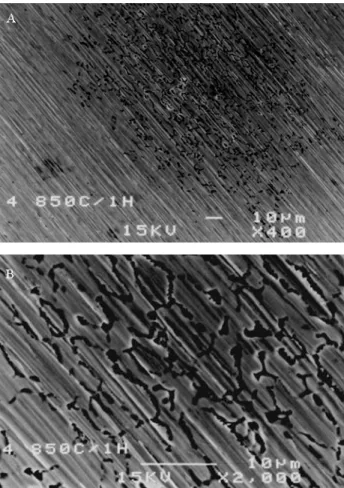
The Fig. 2 shows the microstructure of the same alloy after the heat treatment at 850 °C during 1 h; on it the
austenite is the largest continuous gray phase, the ferrite is the dispersed gray phase and the sigma is the white phase. It is noticed that:
• the sigma phase has predominantly a massive struc-ture, it nucleates at the austenite/ferrite interface and grows inside the ferrite, occupying its space;
• the new austenite (γnew), originated from the
eucte-toid decomposition, is not identified at the mi-crograph.
The increase of the heat treatment time to 5 h increases the sigma phase content, but does not alter the general feature of the microstructure.
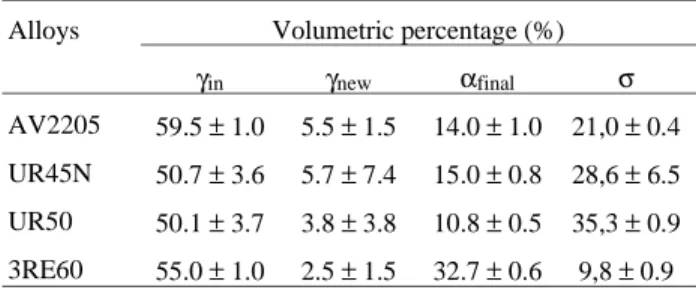
The volumetric percentages of all phases, determined by the described methods, are given in Tables 2 to 4. It is verified that in the solution annealed alloys the austenite and ferrite contents are close do 50%, and that after the sigma phase precipitation there is a decrease of ferrite content and the formation of a small amount of γnew.
3.2. Chemical composition
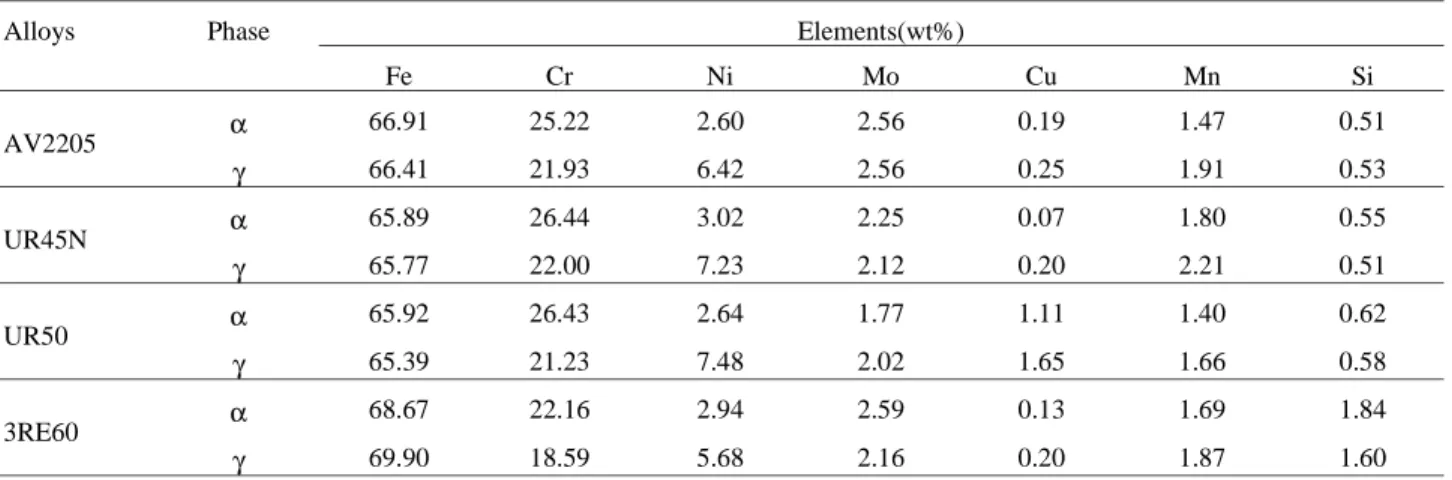
After the volumetric percentage measurement, the chemical composition of different phases was determi-ned with the EDS technique. The results are given in Tables 5 to 7. The sigma phase was only analyzed in the alloy heat treated at 850 °C during 5 h due to its larger
Figure 1. Microstructure of the AV2205 alloy solution annealed at
1050 °C for 30 min. Clear: austenite; dark: ferrite. 811X.
Figure 2. Microstructure of the AV2205 alloy after heat treatment at
850 °C for 1 h. White: sigma phase; continuous gray: austenite; dispersed gray: ferrite. 811X.
Table 2. The volumetric percentages of γ and α phases in the solution annealed alloys.
Alloys Volumetric percentage (%)
γ phase α phase
AV2205 59.5 ± 1.0 40.5 ± 1.0
UR45N 50.7 ± 3.6 49.3 ± 3.6
UR50 50.1 ± 3.7 49.9 ± 3.7
volumetric fraction and consequently smaller measuring error.
3.3. Determination of chemical composition of the new austenite
Since the new austenite (γnew) was not microscopically
detected, it may be admitted that it has precipitated adjacent to the already existing austenite, while the sigma has grown as a separate phase inside the ferrite.
The austenite precipitated in higher temperatures may be admitted then as a film between the sigma phase and the
original austenite. This explains why its composition is impossible to determine, because the EDS analytical beam has a diameter of about 5 µm, which is about half of the original austenite lamella width. Thus, any attempt to ana-lyze this new phase will give the composition of the original austenite.
The chemical composition of the new austenite was then calculated theoretically, using the mass balance. This was possible because the volumetric percentages of all phases are known, as well as their chemical compositions with the exception of that of new austenite. The steps followed in order to perform the calculations are exempli-fied for the alloy AV2205 heat treated at 850 °C for 1 h. The Table 8 displays for this alloy the amount of existing phases under real conditions and, in order to make easier the reasoning, under the supposition that the alloy is 100% ferritic.
In order to determine the composition of the new austenite, it was assumed that the mass of the initial ferrite was 30 g and its volume and the mass of the remaining phases were calculated as follows:
Vα in=
Mα in
Dα (4)
where Vαin is the volume of the initial ferrite, Mαin is the
mass of the initial ferrite and D is the density of ferrite. Since* D = 7.9 g/cm3, it follows:
Vαin= 30
7.9= 3.797 cm
3
The mass of the final ferrite Mαfinal will be then:
Mα final = Vα final Dα = 0.346 Vαin Dα
Mα final = 0.346x 3.797 x 7.9= 10.4 g Table 3. The volumetric percentages of γin, γnew, αfinal and σ phases in
the alloys heat-treated for 1 h.
Alloys Volumetric percentage (%)
γin γnew αfinal σ
AV2205 59.5 ± 1.0 5.5 ± 1.5 14.0 ± 1.0 21,0 ± 0.4
UR45N 50.7 ± 3.6 5.7 ± 7.4 15.0 ± 0.8 28,6 ± 6.5
UR50 50.1 ± 3.7 3.8 ± 3.8 10.8 ± 0.5 35,3 ± 0.9
3RE60 55.0 ± 1.0 2.5 ± 1.5 32.7 ± 0.6 9,8 ± 0.9
Table 4. The volumetric percentages of γin, γnew, αfinal and σ phases in
the alloys heat-treated for 5 h.
Alloys Volumetric percentage (%)
γin γnew αfinal σ
AV2205 59.5 ± 1.0 5.8 ± 1.6 2.5 ± 0.7 32.2 ± 1.1
UR45N 50.7 ± 3.6 2.7 ± 3.6 8.3 ± 0.3 38.3 ± 0.2
UR50 50.1 ± 3.7 1.8 ± 3.7 3.0 ± 0.3 45.1 ± 0.4
3RE60 55.0 ± 1.0 4.4 ± 1.2 27.7 ± 0.5 12.9 ± 0.5
Table 5. The chemical composition of γ and α phases in the solution annealed alloys.
Alloys Phase Elements (wt %)
Fe Cr Ni Mo Cu Mn Si
AV2205 α 64.10 25.52 4.05 4.10 0.10 1.54 0.59
γ 66.18 22.14 6.41 2.65 0.32 1.81 0.50
UR45N α 64.06 26.02 4.08 3.48 0.09 1.75 0.51
γ 66.38 21.71 6.91 2.21 0.08 2.19 0.52
UR50 α 62.85 26.26 4.37 3.52 0.97 1.37 0.67
γ 65.19 21.44 7.29 2.16 1.67 1.60 0.65
3RE60 α 67.98 21.51 3.46 3.44 0.06 1.70 1.84
γ 69.74 18.67 5.70 2.14 0.24 1.95 1.56
The mass of the new austenite Mγnew is given by:
Mγ new= Vγ new Dγ new= 0.136Vα in Dγ new
Assuming that Dγnew = Dα it follows:
Mγ new= 0.136x 3.797 x 7.9 = 4.1g
Finally, the mass of the sigma phase Mσ can be deter-mined by difference, that is:
Mσ = 30.0−10.4− 4.1 = 15.5 g
With the above mass values and the chemical composi-tions given in Tables 5, 6 and 7 it is possible to calculate the mass of each chemical element in the initial ferrite, in the final ferrite and in the sigma phase. With these values the mass of each element in the new austenite can be
Table 6. Chemical composition of α and γ phases in the alloys heat-treated at 850 °C for 1 h.
Alloys Phase Elements(wt%)
Fe Cr Ni Mo Cu Mn Si
AV2205 α 66.91 25.22 2.60 2.56 0.19 1.47 0.51
γ 66.41 21.93 6.42 2.56 0.25 1.91 0.53
UR45N α 65.89 26.44 3.02 2.25 0.07 1.80 0.55
γ 65.77 22.00 7.23 2.12 0.20 2.21 0.51
UR50 α 65.92 26.43 2.64 1.77 1.11 1.40 0.62
γ 65.39 21.23 7.48 2.02 1.65 1.66 0.58
3RE60 α 68.67 22.16 2.94 2.59 0.13 1.69 1.84
γ 69.90 18.59 5.68 2.16 0.20 1.87 1.60
Table 7. Chemical composition of α, γ and σ phases in the alloys heat-treated at 850 °C for 5 h.
Alloys Phase Elements (wt%)
Fe Cr Ni Mo Cu Mn Si
AV2205 α 68.43 25.18 2.46 1.76 0.24 1.43 0.51
γ 66.35 22.03 6.37 2.64 0.35 1.81 0.46
σ 57.24 31.16 2.41 6.93 0.04 1.52 0.71
UR45N α 68.88 25.48 2.24 1.24 0.24 1.44 0.50
γ 66.44 21.67 7.03 2.11 0.12 2.18 0.46
σ 57.01 30.92 2.80 6.60 0.11 1.99 0.58
UR50 α 68.47 25.88 2.21 1.13 0.87 0.87 0.57
γ 65.09 21.45 7.29 2.24 1.57 1.71 0.65
σ 56.39 31.80 2.82 6.26 0.84 1.47 0.84
3RE60 α 69.20 22.67 2.60 2.16 0.15 1.43 1.79
γ 70.17 18.48 5.61 2.20 0.16 1.82 1.66
σ 57.77 22.47 2.82 12.64 0.12 1.73 2.46
Table 8. The volumetric percentage of the existing phases in alloy AV2205 heat-treated at 850 °C for 1 h, under real conditions and under the supposition
that the alloy is 100% ferritic.
Initial ferrite (Vαin)
Final ferrite (Vαfinal)
Sigma (Vσ)
New austenite (Vγnew)
vol % 40.5 ± 1.0 14.0 ± 1.0 21.0 ± 0.4 5.5 ± 1.5
calculated by undertaking a mass balance, as exemplified below for the iron element:
M Fe γnew
= M Fe α in−(
M Fe α final+
M Fe σ)
where MFe is the mass of iron in g.
After the mass of each element was calculated, it was possible to determine the wt% chemical composition of the new austenite for all alloys, as presented in Tables 9 and 10.
It was found that the new austenite has a very low or almost absent content of Cr and it has no Mo at all. In the
3RE60 alloy this phase has the largest Cr content, when compared to the other alloys, but it is much lower than that detected in the initial austenite.
3.4. Pitting potential
The pitting potentials were determined from polariza-tion curves. They are given in Table 11; the pitting potential was considered as the one at which there is a sharp increase in the current density value.
Under the solution anneal conditions the AV2205, UR45N and UR50 alloys did show a high pitting potential, which implies a high corrosion resistance to this type of attack; the 3RE60 alloy, however, has a much lower pitting potential, implying in a lower resistance to this type of corrosion.
After the heat treatment at 850 °C there was a pro-nounced decrease in pitting potential values, as a direct consequence of the sigma phase precipitation. This may be better visualized in Fig. 3, in which the pitting potential of all alloys is plotted as a function of volumetric percentage of sigma phase.
3.5. Corrosion morphology examination
The Figs. 4 to 7 show the samples’ surface after the potentiodynamic polarization tests. The AV2205, UR45N and UR50 solution annealed alloys displayed the same type of behavior, with very small pits, not larger than 30 µm, as that shown in Fig. 4 (secondary electrons image). Using the image formed with primary electrons it was possible to determine the pitting nucleation sites, as shown in Fig. 5, where two pitting nuclei are localized inside the austenite. In the solution annealed alloys the pits were found in three different locations: austenite, ferrite and the interface austenite/ferrite; the Table 12 gives for the three above
Table 9. The chemical composition of the new austenite for alloys
heat-treated at 850 °C for 1 h.
Elements Chemical composition (wt%)
AV2205 UR45N UR50 3RE60
Fe 80.51 86.95 81.57 80.68
Cr 3.85 0.31 - 7.53
Ni 13.49 12.21 16.90 10.41
Mo - - -
-Mn 1.75 0.38 0.25 1.39
Si 0.29 0.13 -
-Cu 0.11 0.039 1.27
-Table 10. The chemical composition of the new austenite for alloys heat
treated at 850 °C for 5 h.
Elements Chemical composition (wt%)
AV2205 UR45N UR50 3RE60
Fe 86.31 84.13 82.34 77.77
Cr - - - 9.82
Ni 11.91 15.72 12.82 9.27
Mo - - -
-Mn 1.46 - 3.39 2.86
Si - 0.015 - 0.29
Cu 0.32 - 1.45
-Table 11. The pitting potentials of alloys solution annealed and
heat-treated at 850 °C for 1 h and 5 h.
Alloys Pitting potential (mV.SCE)
solution anneal 850 °C/1 h 850 °C/5 h
AV2205 1034 ± 40 495 ± 40 329 ± 26
UR45N 1018 ± 61 418 ± 48 307 ± 37
UR50 1045 ± 29 311 ± 48 210 ± 82
3RE60 514 ± 142 303 ± 63 310 ± 29
Figure 3. The pitting potential variation with the sigma phase volumetric
alloys the nucleation percentage in each one of these loca-tions.
As can be noticed on Fig. 6 (secondary electrons image) at the 3RE60 alloy the pits are much larger. Using the primary electrons image (Fig. 7) it is observed that the localized corrosion takes place exclusively over the austenite, showing a great facility for nucleation, with several corrosion nuclei over the same austenitic lamella.
The typical aspect of the corroded surface of all alloys after the sigma phase precipitation is shown in Fig. 8. It is noticed that there is a very large facility for nucleation of localized corrosion because the corroded area is very large when compared with that of solution annealed condition. Moreover, it is also observed that the corrosion follows preferential paths. An analysis of the primary electrons images, shown in Fig. 9, indicates that the corrosion fol-lowed exclusively two paths: the sigma/austenite interface and the austenite/ferrite interface. Most of the corrosion followed the first path.
4. Discussion
The experimental results did show that the presence of sigma phase is very detrimental to the corrosion resistance of duplex stainless steels, as can be realized by the pitting potential results and by the aspect of the corroded surfaces. It was found also that the corrosion was preferentially of the localized type at the austenite/sigma interface. In order to understand the reasons for this behavior it is essential to
Figure 6. Localized corrosion on solution annealed 3RE60 alloy after the
cyclic potentiodynamic polarization test. SEM - secondary electrons image. 3000X.
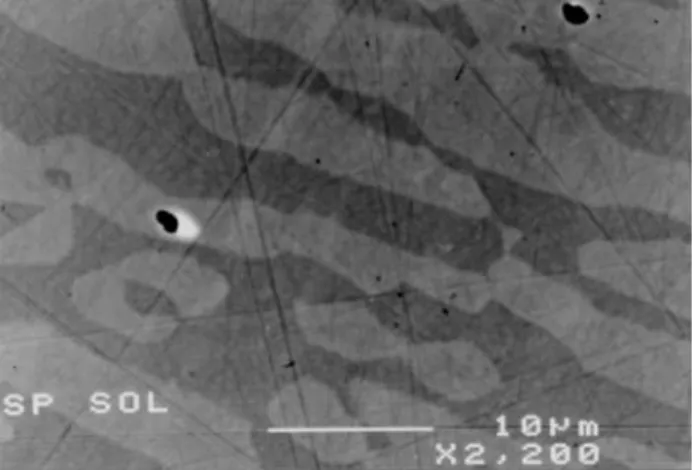
Figure 5. Corrosion pits (black spots) nucleated on austenite of the
solution annealed AV2205 alloy after the cyclic potentiodynamic polari-zation test. SEM - primary electrons image. 2200X.
Figure 4. Corrosion pit formed on solution annealed AV2205 alloy after
the cyclic potentiodynamic polarization test. SEM - secondary electrons image. 3000X.
Table 12. The pitting percentage in three different locations, for the four
solution annealed alloys.
Alloys Pits (%)
Ferrite (α) Austenite (γ) Interface (α/γ)
AV2205 11 44 44
UR45N 19 45 36
UR50 14 23 63
3RE60 - 100 sporadic
Figure 7. Localized corrosion (black spots) on austenite of the solution
have a good knowledge of the sigma phase precipitation mechanism.
As was already mentioned, the sigma phase precipita-tion is determined by an euctetoid reacprecipita-tion in which the ferrite is transformed into sigma and ferrite [Eq. (1)]. Ac-cording to Barbosa et al.7 up to 800 °C the euctetoid is
lamellar, while above this temperature, around 900 °C, the sigma phase precipitates in a massive form, leading to a structure named as “divorced euctetoid”. In present inves-tigation the latter was the predominant type of sigma phase precipitation.
When a lamellar structure is formed, the growth of the sigma and the austenite phases is cooperative. This happens because during the growth of austenite, which contains less Cr and Mo than the sigma phase, these elements are ex-pelled to the side so as to assist the sigma phase growth, and at the same time the sigma phase expels Ni so as to assist the austenite growth. In this way the austenite and the sigma phases are formed side by side, creating the lamellar struc-ture. As the temperature increases, the distance through which these elements diffuse becomes larger and, conse-quently, the lamellae also become larger. In sufficiently high temperatures, due to a lower thermodynamic potential, there will be a larger difficulty to form new surfaces, and since the diffusion distance is also large, there is no forma-tion of lamellae. Instead the “divorced” structure is formed, that is, there is no cooperative growth and the phases are separated into massive forms.
In this way, after the sigma phase precipitation the structure of the four alloys has four phases with different corrosion resistance, three of them having high Cr and Mo content (the sigma phase, the ferrite and the initial austenite) and the fourth, the new austenite, being essen-tially a Fe-Ni alloy. Since the corrosion resistance is strongly dependent on Cr and Mo content, it becomes clear w hy the l o cali zed corrosi on takes place at the austenite/sigma interface, which is the place where the low corrosion resistant new austenite is located.
Although the corrosion resistance evaluation was un-dertaken with a technique that determines the pitting cor-rosion resistance, the corcor-rosion morphology observed on alloys with the sigma phase and on solution annealed alloy 3RE60 is not typical of pitting corrosion. It is rather repre-sentative of a selective corrosion of a non-corrosion resis-tant phase, set up by its chemical composition.
5. Conclusions
The precipitation of sigma phase in duplex stainless steels makes them highly susceptible to localized corrosion at the interface between the sigma phase and the austenite. The performed calculations indicate that during the euctetoid decomposition of ferrite a divorced austenite lamella is formed at the sigma/austenite interface, which is Mo free and whose Cr content is very low. There will be no difficulty then to breakdown the passive film of this la-mella, allowing a selective corrosion of this phase to pro-ceed easily.
Figure 9. Localized corrosion along the sigma/austenite interface
(con-tinuous black strips) on the heat-treated AV2205 alloy at 850 °C/1 h after the cyclic potentiodynamic test. SEM - primary electrons image. 3000X.
References
1. Bain, E.C.; Griffiths, W.E. Am. Inst. Min. Metall.
Eng., v. 75, p. 166-211, 1927.
2. Hall, E.O.; Algie, S.H. Metallurgical Reviews, v. 11, p. 61-88, 1966.
3. Gordon, G.M. Stress Corrosion Cracking and
Hydro-gen Embrittlement of Iron Base Alloys, ed. Staehle, R.
W. NACE, Houston, TX, USA, p. 893-945, 1977. 4. DeBold, T.A. J. Metals, n. 3, p. 12-15, 1989. 5. Brandi, S.D.; Padilha, A.F. Proceedings of 2nd
Brazil-ian Seminar on Stainless Steels - INOX 90. ABM, São
Paulo, SP, Brazil, p. 135-152, 1990 (in Portuguese). 6. Maehara, Y.; Koike, M.; Jujiro, N.; Kunitake, T.
Trans. Iron Steel Japan, v. 23, n. 3, p. 240-246, 1983.
7. Barbosa, C.A.; Mori, F.Y.; Souza, M.H.C.; Falleiros, I.G.S. Metalurgia-ABM, v. 32, n. 227, p. 669-673, 1976 (in Portuguese).
8. Norström, L.A.; Petterson, S.; Nordini, S. Zeitsch.
Werkstoff Tech., v. 12, p. 229-234, 1981.
9. Maehara, Y.; Ohmori, Y.; Murayama, J.; Jujino, N.; Kunitake, T. Metal Science, v. 17, n. 11, p. 541-547, 1983.
10. Hideaki, M.; Kudo, T.; Koso, M.; Miura, M.; Moroishi, T. Duplex Stainless Steel, ed. Lula, R.A. ASM, Metals Park, OH, USA, p. 95-112, 1983. 11. Truman, J.E.; Pirt, K.R. Duplex Stainless Steel, ed.
Lula, R.A. ASM, Metals Park, OH, USA, p. 113-142, 1983.
12. Potgieter, J.H. Br. Corrosion J., v. 27, n. 3, p. 219-232, 1992.
13. Francis, R. Br. Corrosion J., v. 27, n. 4, p. 319-320, 1992.
14. Nilsson, J.O.; Wilson A. Mater. Sci. Technol., v. 9, n. 7, p. 545-554, 1993.
15. Kuroda, T.; Matsuda, F. Trans. JWRI, v. 23, n. 2, p. 205-211, 1994.
16. Ravindranath, K.; Malhotra, S.N. Corrosion, v. 50, n. 4, p. 318-328, 1994.
17. Wilms, M.E.; Gadjil, V.J.; Krougman, J.M.; Ijsseling, F.P. Corros. Sci., v. 36, n. 5, p. 871-881, 1994. 18. Ravindranath, K.; Malhotra, S.N. Corros. Sci., v. 37,
n. 1, p. 121-132, 1995.
19. Adhe, K.N.; Kain, V.; Madangopal, K.; Gadiyar, H.S.
J. Materials Engineering and Performance, v. 5, n. 4,
p. 500-506, 1996.
20. Lopez, N.; Cid, M.; Puiggali, M.; Azkarate, I.; Pelayo, A. Materials Science and Engineering A, v. A229, n. 1-2, p. 123-128, 1997.
21. Egan, F. Stainless Steel World, v. 9, n. 10, p. 61-63, 65, 1997.
22. Gunn, R.N. TWI Journal, v. 7, n. 1, p. 5-45, 1998. 23. Metals Handbook, 9 ed., ASM, Metals Park, OH,