The Inluence of Crystallographic Texture and Niobium Stabilisation on the Corrosion
Resistance of Ferritic Stainless Steel
Miguel Angel Narvaes Ardilaa, Wilian Silva Labiaparia, José Daniel Biasoli de Melloa*
Received: August 29, 2016; Revised: December 16, 2016; Accepted: February 13, 2017
The objective of this work is to investigate the inluence of the crystallographic texture on the corrosion resistance of 16% Cr ferritic stainless steel. Samples of ASTM S43000 ferritic stainless steel, both niobium-stabilised and non-stabilised, were used. The samples were subjected to crystallographic characterisation (EBSD) and analysed using an inverse pole igure (IPF) and a crystalline orientation distribution function (CODF). The samples also underwent anodic potentiodynamic polarisation tests (deaeration by high-purity argon gas) in 3.56% NaCl and 1N H2SO4 solutions, and the surface was
examined by SEM after the tests. The results showed a clear inluence of the crystallographic texture on the corrosion resistance. The niobium decreases the amount of the preferred orientation and thus the inluence of the texture on the corrosion resistance, although the corrosion resistance of the stainless steel is increased as niobium carbides are formed.
Keywords: Potentiodynamic polarisation, corrosion, crystallographic texture, stabilising elements, ferritic stainless steel, niobium
* e-mail: [email protected]
1. Introduction
The global production of stainless steel in 2012 reached approximately 38.1 million tons, which is almost twice as much as ten years ago1. This fact justiies the need to obtain
more information about this material, and its increasing production calls for the need to investigate more economical solutions. The demand for stainless steel continues to grow, and this includes the demand for improvements in the material. This evolution can only succeed if the phenomena (corrosion, abrasion, etc) afecting the properties of stainless steel and the interrelations between said phenomena are well-understood. The main feature of stainless steel is its high corrosion resistance, although it is not completely resistant to corrosion. Thus, it is quite important to obtain a wider knowledge about corrosion in stainless steel and the interactions (synergy) of diferent phenomena, for example, tribological phenomena. As a result, improvements in stainless steel research can help spur further studies.
Previous studies reported that after the hot and the cold rolling process stainless steel showed preferential crystallographic textures2-8. In particular, Raabe and Lücke,4
showed that ferritic steels, non-stabilised or stabilised with Nb or Ti, had a texture gradient through the thickness of the samples. It was observed that the magnitude of the Goss shear texture varied with the position through the thickness.
In the same way, the texture oriented along {111} <112> is afected by recrystallization in Cr17Nb alloys5. It is believed
that this orientation, {111} <112>, occurs favourably during
the recrystallization as a result of nucleation associated with particles of M23C6, Nb(CN), TiC or TiN, and that this
texture is favourable to deep drawing4. A more recent study
showed that, for the ferritic steel AISI 430 with diferent Nb content, new crystallographic texture component appear and these are attributed to the formation of coarse-grains when niobium content varies9.
By relating these textures to the main characteristic of stainless steel, that is, the corrosion resistance, one realizes that a high packing density of the crystallographic planes and orientations provides a better resistance against chemical attack and an improved passivation resistance and repassivation characteristics10. Some early studies11-12 analysed the inluence
of structural texture of carbon, low-alloyed and high alloyed steel rods in the anisotropy of corrosion resistance and showed a strong dependence by the orientation of metal ibres, and recent studies reinforce this fact: the inluence of ibre orientations on corrosion13,14. More recently, it has
been concluded that the orientations <111> and <110> show a better corrosion and pitting resistance because of their high atomic density, and conversely, one expects to ind worse corrosion and pitting resistance associated with orientations showing a lower atomic density10-16. It was also concluded17
that the crystallographic texture is the main cause of the anisotropy of electrochemical corrosion in hot rolled rods. This was attributed to diferent rates of dissolution of the crystals oriented with the {100} and {110} planes parallel to the surfaces of the samples cut out in the directions perpendicular to the axis of the rods and along this axis.
Since ferritic stainless steel is a more economical choice than austenitic and duplex steels, this work investigates the
inluence of the crystallographic texture on the corrosion resistance of hot rolled ferritic stainless steel ASTM S43000, both non-stabilised and stabilised with niobium.
2. Materials and Methods
Two ferritic stainless steels were selected for this work: S43000 with and without niobium stabilisation (430A without Nb which presents lower cost than most austenitic stainless steels and is mainly used to the cutlery sector and 430E with Nb, which is mainly employed in the cutlery and stamping sectors).
All the stainless steel specimens were tested after industrial hot rolling and annealing (Table 1).
Table 1. Industrial hot rolling and annealing conditions.
Specimen 430E 430A
Final hot rolling temperature (ºC) 1000 ± 50 950 ± 50 Annealing soaking temperature (ºC) 780 ± 20 930 ± 20
Annealing time 8 h 30 s
Their chemical composition, which was evaluated by diferent techniques (infrared absorption, thermo conductivity, X-ray luorescence spectrometry and optical emission spectrometry) is presented in Table 2.
Table 2. Chemical compositions of the specimens in weight percent, via X-ray luorescence spectrometry.
Element Steel
P430E P430A
C 0.025 0.049
Mn 0.206 0.319
Si 0.459 0.360
P 0.036 0.039
S 0.001 0.001
Cr 16.187 16.100
Ni 0.193 0.274
Mo 0.035 0.020
V 0.039 0.037
Nb 0.416 0.014
W 0.017 0.009
N 0.020 0.053
The sample dimensions were 25 mm × 25 mm. Three diferent thicknesses were taken for each of the samples (the original thickness was 4 mm) to obtain the preferential crystallographic textures as they difered through the sample thickness (Figure 1). The thicknesses were: a) 100% of the original thickness (4.0 mm), b) 50% of the original thickness (2.0 mm), and c) 90% of the original thickness 3.6 mm. The 2.0 and 3.6 mm samples were produced through conventional machining of the original sample (4.0 mm).
Figure 1. Schematic showing the diferent thicknesses and the corrosion test surface location of the samples in reference to the original thickness of the plate.
In order to know if the conventional machining afected the sub supericial microstructure of 3.6mm and 2mm samples, cross-sectioned samples were observed after conventional machining. It was possible to determine that the microstructure was altered to a depth of less than 40 μm. In order to remove the layer altered by the machining, after machining, the samples were sanded (sandpaper # 220). By measuring 10 samples before and after sanding it was possible to determine that this process removed about 55.5 ± 4 μm i.e. more than the depth afected by the machining process, thus ensuring that the machining did not inluence the results of the present work.
The samples had their surface sanded with #120, #220, #320 and #600 sandpaper. The crystallographic texture analyses were performed on a conventional “Electron Back
Scattered Difraction” (EBSD) attached to an SEM, with LaB6 ilaments (PHILIPS, XL-30). The data obtained by
EBSD were analysed using the software OIM Analysis®.
The samples for this analysis were polished, in addition to being sanded, by a DP-Plancom polishing cloth immersed in a solution of 9.3 and 1 μm diamond abrasives on a Struers Abramin-Bcom polishing machine. The inal stage consisted of polishing using colloidal silica for approximately 2700 seconds in a Minimet 1000B polishing machine. The data were obtained for the longitudinal section through the thickness for the two stainless steel samples with 16% Cr, using an accelerated beam of 20 kV and a step range between 1 and 2 μm.
A qualitative description was obtained through an inverse pole igure (IPF), whereas a crystalline orientation distribution function (CODF) was used to provide a quantitative description. The textures produced by CODF will be grouped into ibre textures and shear textures. Fibre and shear textures are common in operations such as rolling and drawing and are produced by the axially symmetric deformation. These textures generally have rotational symmetry, and are parallel or almost parallel to the axis of deformation, these textures are called ibre textures18-20. On the opposite, the shear textures
are perpendicular to the axis of rotation.
An SP150 potentiostat manufactured by BioLogic was used for the potentiodynamic polarisation experiments. Data acquisition and data processing were accomplished using the software EC Lab®V10.18 and EC Lab Express®V5.4. The
a reference electrode. Two diferent solutions were used: a solution composed of distilled water and NaCl at 3.56% by weight and 1N H2SO4 in distilled water. All parameters and
methodologies applied in the tests were based on ASTM G5-94 standards21: the ratio of the potential variation (E) of
50 mV per 5 min (0.167 mV/s), deaeration with highly pure argon at a low rate of 150 cm3/min during the entire test,
and a 45 min deaeration before the potential was applied. The tests were started at a potential 50 mV lower than the stabilised open circuit potential (OCP).
After the potentiodynamic tests, the samples were analysed by SEM as previously described.
3. Results and Discussion
3.1. Characterisation of the crystallographic
texture
The inverse pole igures obtained for the EBSD texture analyses are given in Figure 2. It can be seen that the 430A samples show a larger texture gradient through their thickness compared to the 430E samples. On the surface, the preferential orientations are <101> and <111>, whereas in the centre, they are <001> and <111>. It was also inferred that the 430E steel has larger grains that the 430A steel.
Figure 2. Inverse pole igure. (a) P430A and (b) P430E.
Figure 3 shows the distribution of mean grain size through the thickness of the steel samples 430A and 430E. The 430A steel has a smaller grain size average through the thickness compared to steel 430E. Furthermore, the 430A steel has a minimum variation of grain size while 430E steel has a greater variation. These diferences could be explained by the Nb addition in steel 430E. Niobium additions afect the uniform grain growth after recrystallization and hamper the grain reinement9.
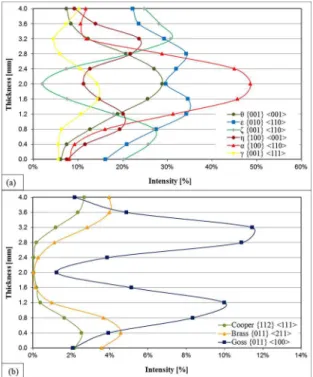
For a quantitative description of the crystalline orientations, a crystalline orientation distribution function (CODF) was used. The quantiication of the preferential textures are presented in Figure 4 for the 430A samples and in Figure 5 for the 430E samples. In some thicknesses the sum of the
Figure 3. Distribution of mean grain size through the thickness of the samples.
diferent components adds up to more than 100%; this is because some textures are very close to each other and the software takes them into account twice; this is a recurring problem with this technique19.
Figure 4. Texture intensity through the thickness of the 430A steel. (a) Fibre texture and (b) shear texture.
Comparing Figure 4 and 5, it can be seen that the 430A and 430E steels have similar textures in all thicknesses (4 mm, 3.6 mm and 2 mm), i.e., the predominant ibre and shear textures are the same for the two steels and the intensities of these textures are very close (5% of maximum variation). It is also observed that in the centre of the plate (2 mm) there are no relevant shear textures, all have intensities lower than 1%.
(4 mm) and the bulk of the plate. For both materials the ibre textures was little afected by the position. Moreover, at the centre of the plate, no signiicant shear textures were observed, and the α ibre {100}<110> was predominant with about 50% intensity. As a consequence, we may suppose that variation in properties is governed by the presence of Goss texture with greater intensity at 3.6 mm.
3.2. Inluence of the crystallographic texture on
the corrosion resistance
To verify the inluence of the crystallographic texture on corrosion of hot rolled ferritic stainless steel ASTM S43000, both non-stabilised and stabilised with niobium, the samples (4 mm, 3.6 mm and 2 mm samples taken from the same plate of each steel) were subjected to anodic potentiodynamic polarization tests.
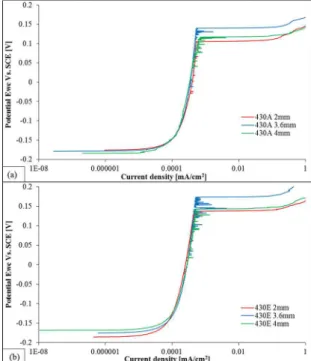
Typical results of the anodic potentiodynamic polarization curves measured through the thickness for the 430A and 430E samples in a 3.56% NaCl solution showed that the largest corrosion resistance is associated with the position corresponding to 3,6 mm (Figure 6). For clarity, the pitting potentials were evaluated and are given in Figure 7.
Figure 5. Texture intensity through the thickness of the 430E steel. (a) Fibre texture and (b) shear texture.
stainless steels5-6,8. In addition, in the surface (4 mm) and
3.6 mm of thickness, the ibre textures ζ {001} <110>5-6,8
and ε {010} <110> was predominant for both materials with similar intensities (between 22% and 27% of intensity). The principal shear texture in 3.6 mm was Goss {011} <100> with intensity 4.9% for the 430A and 5.5% for the 430E. It can also be observed that the shear texture brass {011} <211> is more intense closer to the surface (4 mm). This is due to the recrystallisation taking place preferentially on the metal surface and can be explained by the plastic deformation generated during this phenomenon. This deformation is inluenced by the presence of alloying elements such as niobium4-5,9, and explain the slightly high intensity of the brass texture on the steel 430E (5%) compared on the steel 430A (4%). The copper shear texture {112} <111> was presented in similar intensity on the surface (4 mm) and 3.6 mm, with approximately 2.50% for the 430A and 3.35% for the 430E. The ibre ε {010} <110> was presented in the centre of the samples (2 mm) but showed half intensity when compared to the ibre α {100} <110> also presented in this thickness.
The Goss texture also prevails in the 430A steel, but its highest intensity lies at the thickness of 3.2 mm (65% from the centre to the surface), although at 3.6 mm of the thickness, the values are also remarkable, which agrees with previously reported results4,8. The diference in the intensity
through the thickness may be caused by the stabilisation with niobium4-5,9 and also by the grain size9.
Summarizing, the shear texture Goss {011} <100> is the most important texture variation between the surface
Figure 6. Characteristics anodic potentiodynamic polarisation curves through the thickness in 3.56% aqueous NaCl. (a) P430A and (b) P430E.
The variation of grain size through the thickness (Sn)
varied only 0.02 for each steel (430A and 430E). According to Gollapudi28 this variation has little inluence when Sn
varies between 0 and 0.2. In addition, the grain size variation between the thicknesses was 4 μm (4x10³nm) maximum.
According to the literature28-30 these grain sizes have similar
electrochemical behaviour. On the other hand, it is reasonable to suppose that the diference in grain sizes, between 430A and 430E steels, would have an inluence on the result of potentiodynamic polarization; Aghuy et al30 showed that grain
size does not have a signiicant inluence on the potential of pitting in stainless steel using the same electrolytic solution as in the present study (3.5% NaCl). These authors also stated that grain reinement decreases the frequency of occurrence of metastable pits (phase prior to pitting), that is, it decreases the probability of pitting apparition. Another study31 using the same medium (NaCl) showed that the grain
size does not appear to inluence the pitting potential in pure Al. Accordingly, it is believed that the diference in grain size between 430A and 430E steels had no inluence on the result of pitting potential in the present study.
By observing the EBSD texture analysis (Figure 4, Figure 5 and Figure 6), one realises that the orientation of the ibre textures <110> (α, ζ and ε ibres) was predominant for both steels (430A and 430E) through the thickness, whereas the shear texture (Goss) with orientation <100> appears predominantly at 3.6 mm. It is reasonable to suppose that the presence of the orientation <100> in the shear texture is at the origin of the improvement of the pitting resistance in ferritic steels which has higher atomic density intrinsic of the FCC systems (ferrite)15,32-33. Previous studies15,34 showed
that the lower susceptibility to pits generation is related with increasing atomic density planes of the FCC system, this susceptibility decreasing in the following order: 110 > 100 > 111. The crystallographic planes with a high number of nearest neighbour atoms requires a higher total energy for the breaking of the bonds and the subsequent dissolution of atoms35.
A comparison between the behaviour on the surface (4 mm) and at the centre (2 mm) of the samples allows one to notice a slight diference in the pitting potential (approximately 15 mV). The surface (4 mm) seems to have a better pitting resistance. By comparing the orientations in both regions, one observes that in addition to the ibre textures oriented along <110>, the surface also exhibits a Brass shear texture (oriented along <211>), which, as previously stated, arises from the recrystallization in ferritic steels. The orientation <211> in the brass shear texture could provide some corrosion resistance, which is supported by this orientation also being found at 3.6 mm and having the second highest intensity after the Goss shear texture. In addition to this, it can be inferred that the ibres with a direction {100} and orientation <110> (α ibre), which are more intense at the centre of the sample,
Figure 7. Inluence of slab thickness on the pitting potential.
will preferentially form Nb carbide instead of Cr carbides thus decreasing the Cr depletion in the matrix22. Higher Cr
free content in stainless steel beneits the formation of more stable passive ilms on the steel surface, which prevents the penetration of chloride ions and sulphate ions. Consequently, Cr enhances the pitting corrosion resistance and uniform corrosion resistance23. Moreover, Nb contributes to the
corrosion resistance when it is added to the alloy24-27, the
additions of this element on ferritic stainless steels changes the characteristics of the surface ilm of oxide semiconductor caused by Nb5+ incorporation into the passive layer, this fact
shifts the current to a more noble, and resulting in increased pitting corrosion resistance24,27.
The pitting potential increases at 3.6 mm and decreases at the centre of the sample (2 mm), i.e., the corrosion resistance is reduced at the centre. Figure 7 shows the inluence of the crystallographic texture on the pitting potential, because the crystallographic texture changes throughout the thickness of steel in the same way as the pitting potential, and demonstrating that the pitting phenomenon has an slightly anisotropic behaviour11-15. This anisotropic behaviour occurs because carbon segregation22 is more intense in the centre
of the slab in non-stabilised steel. As the P430E steel is niobium-stabilised, this efect was not observed. In both steel types, the efect of the crystallographic texture alone can be clearly identiied.
In addition, the distribution of grain size (Table 3) had almost no efect on pitting.
Table 3. The approximate grain size and the standard deviation in a weighted grain size distribution (Sn) for the 430A and 430E steels.
Steel Thickness (mm) Grain Size (µm) Sn
430A
4.0 16.58 0.10
3.6 17.37 0.08
2.0 20.65 0.09
430E
4.0 37.10 0.11
3.6 40.60 0.10
tend to lower the pitting corrosion resistance because this location has the lowest pitting potentials for each of the steels.
Figure 8 presents typical results of the anodic potentiodynamic polarisation through the thickness, in a solution of 1N H2SO4
for both steel types 430A and 430E. In this environment, the steels have an active-passive behaviour, whereas in the 3.56% NaCl solution (Figure 6) the steels were completely passive. There is no large diference through the thickness for both steel types.
The evolution with thickness is quite similar to that seen for the pitting potential (Figure 7), i.e., the best corrosion behaviour occurs at 3.6 mm, where the lowest current density was found. As previously stated, at 3.6 mm, the orientation <100> of the Goss shear texture is the main diference compared to the other positions, i.e., the orientation <100> that occurs in the shear texture has a positive inluence on imin. On the other hand, the minimum
passive current was presented by the 430A steel that is not stabilized. This result contradicts a previous study for a steel with the Nb addition in an H2SO4 environment which
suggested for potentiodynamic and potentiostatic studies a higher Nb content decreases the passive current density within the corrosive environment36. It is believed that this
behaviour is not related to the crystallographic textures or alloying elements and that it is produced by the variation of grain size. More reined grains can help the uniform passive layer grow, due to the higher free energy associated with grain boundaries25,37-38. In addition grain size distribution (Sn) has also efects: the passive layer may vary from being
very uniform and compact at some locations to being very non-uniform at other locations if the grain size distribution (Sn) is large
25.
Table 4 presents a summary of the variation of texture through the thickness and its inluence on the corrosion for 430A and 430E steels by comparing the higher intensity textures with the pitting potential and minimum passive current (imin).
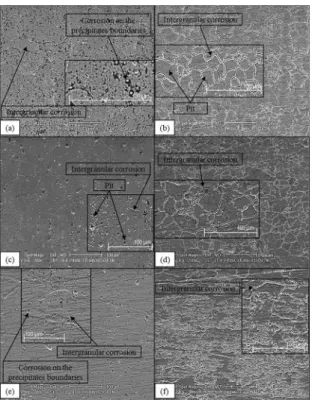
Figure 10 shows typical surfaces after the anodic potentiodynamic polarisation tests in 1N H2SO4. It is clear
that, in the 430E steel samples, the severity of corrosion allowed a clean visualisation of niobium carbides, whereas in the 430A steel samples, intergranular corrosion is more prevalent, which agrees well with previous results regarding corrosion phenomena in 430E and 430A steels.
Niobium carbide precipitates were observed throughout the surface of the 430E steel samples as white spots. At 4 mm and 2 mm, a weak granular corrosion was identiied (Figure 10 (a) and (e)), as well as a larger corrosion at the borders of the carbide, a phenomenon that was not visible at 3.6 mm (Figure 10 (c)). At this position, in addition to a small amount of intergranular corrosion, the slight presence of pits was observed, but it cannot be concluded that the corrosion is signiicant there. In the 430A steel samples, the intergranular corrosion was remarkable through the thickness, although on the surface (at 4 mm), some pits could be observed inside the grains (Figure 10 (b)). Compared to centre of the samples, i.e., at 2 mm (Figure 10 (f)), a large amount of intergranular corrosion was observed, as well as a generalised degradation on the surface that can be considered generalised corrosion.
Figure 8. Typical anodic potentiodynamic polarisation curves along the thickness in 1N H2SO4. (a) P430A and (b) P430E.
The average result of the minimum passivation current (imin) in 1N H2SO4 was calculated and the results are showed in the Figure 9.
Table 4. Summary of the texture variation through the thickness for the P430A and P430E steels samples and their pitting, corrosion and passivation behaviour.
Position Steel Texture (higher intensity) Corrosive character
Fibber Shear Pitting Pot. [mV] imin [mA/cm
2] 10-3
4.0 mm
430A ζ {001} <110> 25% Brass {011} <211> 4% 118 ± 11 1.011 ± 0.010 ε {010} <110> 22%
430E ζ {001} <110> 27% Brass {011} <211> 5% 152 ± 9 1.171 ± 0.034 ε {010} <110> 22%
3.6 mm
430A ζ {001} <110> 28% Goss {011} <100> 5% 141 ± 1 0.940 ± 0.018 ε {010} <110> 24%
430E ζ {001} <110> 27% Goss {011} <100> 6% 186 ± 9 1.124 ± 0.014 ε {010} <110> 22%
2.0 mm 430A α {100} <110> 49% Intensity lower to 1% 106 ± 13 1.009 ± 0.014 430E α {100} <110> 52% Intensity lower to 1% 148 ± 10 1.180 ± 0.015
Figure 10. SEM micrographs of the steels tested through the thickness in 1N H2SO4. (a) P430E 4 mm; (b) P430A 4 mm; (c) P430E 3.6 mm; (d) P430A 3.6 mm; (e) P430E 2 mm; (f) P430A 2 mm.
4. Concluding Remarks
The local corrosion (pitting) exhibits an anisotropic behaviour in ferritic stainless steel and is inluenced by the crystallographic texture, particularly with respect to the pitting potential. This anisotropic behaviour has shown that the presence of the Goss shear texture (oriented along <100>) has a positive inluence on the corrosion resistance, whereas the ibre α {100} <110> has a negative inluence on the pitting potential. The pitting potential through the thickness showed a trend in the region of the highest Goss
texture intensity (orientation <100>), where it was worse near the centre of the sample. These results would be questionable if only the P430A steel (unstabilised) was used.
Nb stabilisation in stainless steel helps to protect against intergranular corrosion, as the grain borders becomes less reactive. This becomes more evident when comparing the P430A and P430E steels, the second one being more resistant to intergranular corrosion because of the Nb stabilisation. This element reduces the presence of preferential orientations, and thus the inluence of the texture on the corrosion resistance. However, it increases the corrosion resistance in stainless steel by giving rise to niobium carbides.
5. Acknowledgements
The authors are very grateful to Companhia Brasileira de Mineração e Metalurgia S.A., CNPq and Capes/Proex for inancial support.
6. References
1. International Stainless Steel Forum (ISSF). Stainless Steel in
Figures. 2013. Brussels: ISSF Statistical Report; 2013.
2. Hutchinson B. Deformation microstructures and textures in steels. PhilosophicalTransactions of the Royal Society A.
1999;357:1471-1485.
3. Ravi Kumar B, Singh AK, Das S, Bhattacharya DK. Cold rolling texture in AISI 304 stainless steel. Materials Science
and Engineering: A. 2004;364(1-2):132-139.
4. Raabe D, Lücke K. Inluence of particles on recrystallization textures of ferritic stainless steels. Steel Research International.
1992;63(10):457-464.
5. Raabe D, Lücke K. Textures of ferritic stainless steels. Material
Science and Technology. 1993;9(4):302-312.
6. Huh MY, Lee JH, Park SH, Engler O, Raabe D. Efect of through-thickness macro and micro-texture gradients on ridging of 17%Cr ferritic stainless steel sheet. Steel Research
7. Raabe D, Reher F, Hölscher M, Lücke K. Textures of strip cast Fe16%Cr. Scripta Metallurgica et Materialia. 1993;29(1):113-116.
8. Raabe D, Lücke K. Texture and microstructure of hot rolled steel. Scripta Metallurgica et Materialia. 1992;26(8):1221-1226.
9. Siqueira RP, Sandim HRZ, Oliveira TR, Raabe D. Composition and orientation efects on the inal recrystallization texture of coarse-grained Nb-containing AISI 430 ferritic stainless steels.
Materials Science and Engineering A. 2011;528(9):3513-3519.
10. Chouthai SS, Elayaperumal K. Texture Dependence of Corrosion of Mild Steel after Cold Rolling. Corrosion Journal.
1976;11(1):40-43.
11. Vladimirov LP. Anisotropy of corrosion properties of alloy steel. Materials Science. 1967;2(3):210-211.
12. Vladimirov LP, Kargina EI. Anisotropy of corrosion properties of carbon, low-alloy, and high-alloy steels. Materials Science.
1972;5(1):42-43.
13. Ravi Kumar B, Singh R, Mahato B, De P, Bandyopadhyay N, Bhattacharya DK. Efect of texture on corrosion behavior of AISI 304L stainless steel. Materials Characterization.
2005;54(2):141-147.
14. Venegas V, Caleyo F, Vázquez LE, Baudin T, Hallen JM. On the Inluence of Crystallographic Texture on Pitting Corrosion in Pipeline Steels. International Journal of Electrochemical
Science. 2015;10:3539-3552.
15. Shahryari A, Szpunar JA, Omanovic S. The inluence of crystallographic orientation distribution on 316LVM stainless steel pitting behavior. Corrosion Science. 2009;51(3):677-682.
16. Bakhtiari A, Berenjani I. Texture, microhardness and corrosion resistance of 316L stainless steel. Metallurgical and Materials
Engineering. 2015;21(1):1-5.
17. Shkatulyak NM, Tkachuk OM. A role played by the crystallographic texture in the process of corrosion of hot-rolled rods made of carbon steel. Materials Science. 2012;48(2):153-161.
18. Suwas S, Ray RK. Representation of Texture. In: Suwas S, Ray
RK. Crystallographic Texture of Materials. London:
Springer-Verlag; 2014. p. 11-38.
19. Schwartz AJ, Kumar M, Adams BL, Field DP, eds. Electron Backscatter Difraction in Materials Science. New York: Springer; 2000.
20. De Angelis R, Snyder T, House J, Hosford W. Quantitative description of iber textures in cubic metals. Advances in X-Ray
Analysis. 2000;42:510-520.
21. ASTM International. ASTM G5-94. Standard Reference Test Method for Making Potentiostatic and Potentiodynamic Anodic
Polarization Measurements. West Conshohocken: ASTM
International; 2004.
22. Huang XZ, Wang D, Yang YT. Efect of Precipitation on Intergranular Corrosion Resistance of 430 Ferritic Stainless Steel. Journal of Iron and Steel Research, International.
2015;22(11):1062-1068.
23. Ma L, Hu S, Shen J, Han J, Zhu Z. Efects of Cr Content on the Microstructure and Properties of 26Cr–3.5Mo–2Ni and
29Cr–3.5Mo–2Ni Super Ferritic Stainless Steels. Journal of
Materials Science & Technology. 2016;32(6):552-560.
24. Sousa CAC, Kuri SE. Relationship between niobium content and pitting corrosion resistance in ferritic stainless steels.
Materials Letters. 1995;25(1-2):57-60.
25. Koga GY, Nogueira RP, Roche V, Yavari AR, Melle AK, Gallego J, et al. Corrosion properties of Fe–Cr–Nb–B amorphous alloys and coatings. Surface and Coatings Technology.
2014;254:238-243.
26. Kiminami CS, Souza CAC, Bonavina LF, de Andrade Lima LRP, Suriñach S, Baró MD, et al. Partial crystallization and corrosion resistance of amorphous Fe-Cr-M-B (M = Mo, Nb) alloys. Journal of Non-Crystalline Solids.
2010;356(44-49):2651-2657.
27. Hamdy AS, El-Shenawy E, El-Bitar T. The corrosion behavior of niobium bearing cold deformed austenitic stainless steels in 3.5% NaCl solution. Materials Letters. 2007;61(13):2827-2832.
28. Gollapudi S. Grain size distribution efects on the corrosion behaviour of materials. Corrosion Science. 2012;62:90-94.
29. Li SX, He YN, Yu SR, Zhang PY. Evaluation of the efect of grain size on chromium carbide precipitation and intergranular corrosion of 316L stainless steel. Corrosion Science. 2013;66:211-216.
30. Abbasi Aghuy A, Zakeri M, Moayed MH, Mazinani M. Efect of grain size on pitting corrosion of 304L austenitic stainless steel. Corrosion Science. 2015;94:368-376.
31. Ralston KD, Fabijanic D, Birbilis N. Efect of grain size on corrosion of high purity aluminium. Electrochimica Acta.
2011;56(4):1729-1736.
32. Park SY, Kim JH, Lee MH, Jeong YH. Efects o the microstructure and alloying elements on the iodine-induced stress-corrosion cracking behavior of nuclear fuel claddings. Journal of Nuclear
Materials. 2008;376(1):98-107.
33. Davis BW, Moran PJ, Natishan PM. Metastable pitting behavior of aluminum single crystals. Corrosion Science.
2000;42(12):2187-2192.
34. Kruger J. Inluence of Crystallographic Orientation on the Pitting of Iron in Distilled Water. Journal of The Electrochemical
Society. 1959;106(8):736.
35. Guo WY, Sun J, Wu JS. Efect of deformation on corrosion behavior of Ti-23Nb–0.7Ta–2Zr–O alloy. Materials Characterization.
2009;60(3):173-177.
36. Nam ND, Kim JG. Efect of niobium on the corrosion behaviour of low alloy steel in sulfuric acid solution. Corrosion Science.
2010;52(10):3377-3384.
37. Lee S, White HS. Dissolution of the Native Oxide Film on Polycrystalline and Single-Crystal Aluminum in NaCl Solutions.
Journal of The Electrochemical Society. 2004;151(8):B479-B483.
38. Ralston KD, Birbilis N, Davies CHJ. Revealing the relationship between grain size and corrosion rate of metals. Scripta