Characterization of
Sn
Doped
ZnS
Thin Films Synthesized by CBD
Ayan Mukherjeea, Partha Mitraa*
Received: August 31, 2016; Revised: November 10, 2016; Accepted: January 02, 2017.
Zinc sulphide (ZnS) thin ilm were prepared using chemical bath deposition (CBD) process and
tin (Sn) doping was successfully carried out in ZnS. Structural, morphological and microstructural characterization was carried out using XRD, TEM, FESEM and EDX. XRD and SAED pattern conirms presence of hexagonal phase. Reitveld analysis using MAUD software was used for particle size estimation. A constantly decreasing trend in particle size was observed with increasing tin incorporation in ZnS ilm which was due to enhanced microstrain resulting for tin incorporation. The particle size of
prepared hexagonal wurtzite ZnS was around 14-18 nm with average size of ~16.5 nm. The bandgap of
the ilm increases from ~ 3.69 eV for ZnS to ~ 3.90 eV for 5% Sn doped ZnS ilm which might be due to
more ordered hexagonal structure as a result of tin incorporation. Band gap tenability property makes
Sn doped ZnS suitable for application in diferent optoelectronics devices. PL study shows variation
of intensity with excitation wavelength and a red shift is noticed for increasing excitation wavelength.
Keywords: CBD, Sn:ZnS thin ilm, XRD, TEM, Particle size, Optical band gap
* e-mail: mitrapartha1@redifmail.com
1. Introduction
Zinc sulide ZnS is one of the direct II–VI semiconductor
compounds with large band gap energy of ~3.65 eV at room temperature1.The material crystallizes in both cubic and hexagonal forms and is a material of reference to test several theoretical models in condensed matter physics2. Sometimes it shows mixed phase crystal structure. While cubic ZnS has been reported to have a wide direct bandgap of ~3.6 eV at 300K, hexagonal ZnS has been reported to have a bandgap of ~ 3.91 eV3. The material has huge potential application in both bulk and thin ilm form in various photovoltaic and optoelectronic devices4.It is used as key material for solar control coating, optoelectronic devices, electroluminescence devices, sensors and others5. ZnS is a prospective material to be used in solar cell as passivation layer for better photovoltaic properties6. Due to its high refractive index (n ~ 2.3), it can be used as an antirelective coating7. ZnS is alsoan important
phosphor host lattice material used in electroluminescent devices (ELD). This is because of its large band gap that is enough to emit visible light without absorption and the eicient transport of high energy electrons8.Various physical
and chemical techniques have been used by researchers to deposit ZnS thin ilms. While physical deposition methods
such as sputtering, metal organic chemical vapor deposition (MOCVD), molecular beam epitaxy (MBE) and atomic layer epitaxy (ALE) demand the use of either vacuum
conditions and/or complex equipment, chemical techniques are simpler and cost efective. Thus they have become more popular in recent times. Various chemical techniques that has been used includes electrodeposition9, spray pyrolysis10-11, sol-gel1, spin coating5 and chemical bath deposition12-15 etc. The technique of CBD (also known as chemical solution deposition) is simple, inexpensive and can be adaptable to large area processing with low fabrication cost. Also doping with metal ions at low temperatures can be conveniently carried out at this technique. Doping of ZnS with group II
metal ions has been made to achieve improved electrical and optical properties. Copper doping has been reported to strongly inluence resistivity and band gap16-17. Increase of
Cu2+ concentration has been reported to result in quenching of luminescence due to formation of CuS18. Doping with
Mn has been reported to give highly transparent ZnS ilm
along with quantum size efect19. Quantum coninement
was also reported Mn doped ZnS thin ilms prepared by
spin coating5. Strong luminescence band at energy 2.07 eV has been reported for Mn doped ZnS prepared by wet
chemical technique20. Doping of transition metal ions of copper and manganese has been reported to show intense, stable and tunable emission covering the blue to red end of visible spectrum21. As ZnS radiates luminescence with a wavelength 420-480 nm, copper and manganese has been doped to order to receive radiation in the visible region. Although inluence of Cu and Mn on physical properties of ZnS has been reported by several researchers, inluence
of tin incorporation in ZnS thin ilm is almost nonexisting.
For tin doped ZnS nanoparticles with thiourea as capping
agent, quantum coninement efect leading to blue shift in band gap has been reported18. Detail information regarding efect of tin incorporation on microstructure of ZnS is not available. This was the key motivation behind this work. In the present study we report the synthesis of ZnS and Sn
doped ZnS thin ilms by CBD and their microstructural and
optical properties.
2. Experimental
ZnS and Sn doped ZnS thin ilm was deposited on well
treated microscope glass slide substrates as substrate treatment plays an important role in deposition of thin ilm by CBD process. The substrate cleaning steps involved overnight keeping in chromic acid followed by rinsing in distil water and ultrasonic cleaning in equivolume acetone and alcohol for about 20 minutes. The glass substrates were lightly rubbed before immersion for better adherence and dipped vertically in the bath solution. All the chemicals and reagents used to prepare the reacting bath were of analytical reagent grade. 80 ml 0.2 M zinc acetate [Zn(CH
3COO)2.2H2O] and 160 ml 0.2 M thiourea [(NH
2)2CS] was added and stirred properly at room temperature. Then 0.66 M tri-sodium citrate as complexing agent was mixed properly in the solution. After that, ammonia solution was added to make the pH 11 of the bath. The substrates were immersed in the bath solution for 24 hours and a white colored ilm with a faint shadow of blue appears over the surface of the substrate. To obtained
Sn doped ZnS thin ilm, 0.1 M tin chloride (SnCl
2, 2H2O) was added in proper ratio with the solution. In this process
ZnS, 2.5% Sn: ZnS and 5% Sn: ZnS thin ilms were prepared.
Attempts to prepare ilms with more than 5% resulted in instability of the acetate bath resulting in non-uniform ilms with pinholes. Film thickness measured using gravimetric weight diference method22-23 was approximately ~1300 nm
for ZnS and ~1400 nm for 5% Sn: ZnS.
The phase identiication and crystalline properties of undoped and doped samples were studied by X-ray difraction (XRD) method employing a Bruker (D8 advance) x-ray difractometer with Ni-iltered CuKα radiation (λ=1.5418 Å). Reitveld
analysis was done to obtain microstructural information by using MAUD 2.33 software, which is specially designed to simultaneously reine both the structural and microstructural parameters through a least squares method24-25.The Transmission electron microscopy (TEM) investigation was carried out using Tecnai F30 G2, FEI, Hillsboro, Oregon microscope operating at 200 kV accelerating voltage. SAED pattern was analyzed to get detail information about structure and TEM was used for particle size estimation. The sample was separated from the substrate carefully and dispersed in ethanol by ultrasonication process. Then they were mounted on a carbon coated copper grid, dried, and used for TEM measurements. Energy dispersive X-ray (EDX) analyses were
carried out to qualitatively measure the sample stoichiometry of ilms. The optical absorption measurements were carried out using a Schimatzu dual beam UV-Vis spectrophotometer (Model No: UV-1800). The spectrum was recorded by using a similar glass slide as reference and hence the absorption due to the ilm only was obtained. The band gap of the ilms was calculated from the absorption edge of the spectrum.
3. Results and discussions
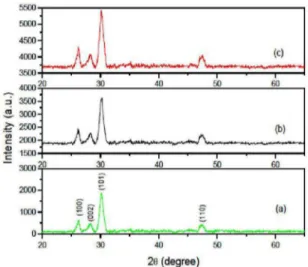
The X-ray difraction patterns of undoped ZnS and Sn
doped ZnS ilms are shown in Figure 1. The difraction pattern
for undoped ZnS is shown in Figure 1 (a). Figure 1 (b) and 1
(c) shows the difractograms for 2% and 5% Sn: ZnS ilms
respectively. The materials were scanned in the range 20-70o. Intensity in arbitrary units is plotted against 2θ in Figure 1. It is seen from Figure 1 (a) that peaks appears at 26.42o, 28.38o, 30.35º and 47.65o respectively. The difractogram of the sample reveals that all the peaks are in good agreement with the Joint committee on powder difraction standard (JCPDS) data belonging to hexagonal ZnS structure (Card
No. 36-1450). The corresponding relecting planes are (100), (002), (101) and (110) respectively. The (101) peak appears with maximum intensity at 30.35o. The major peak along with the other peaks is shifted slightly towards lower angles for tin doped ilms. The peak positions for 5% Sn: ZnS ilms
are 26.32o, 28.3o, 30.20o and 47.50o respectively. This might be due to the replacement of smaller Zn2+ ions (0.74 Å) by
the bigger Sn2+ ions (0.99 Å). Apart from ZnS characteristic peaks, no extra peaks due to tin their complex oxides could be detected. This observation suggests that the ilms are single phase and tin ion might have substituted Zn site without
changing the hexagonal structure. In hexagonal wurtzite structure (100) plane appears with maximum intensity and (101) is the second highest intensity peak (JCPDS 36-1450). In our case (101) plane appears with maximum intensity indicating preferred orientation along (101). However the relative intensity of the major difraction peak corresponding to hexagonal wurtzite structure (101 difraction plane) increases with respect to the other peaks with increasing tin incorporation. In other words, the ratio I100 / I101 increases with increasing tin incorporation indicating the structure gets more ordered. For pure ZnS ilm, the ratio is ~0.32
and it increases to ~0.79 for 5% Sn: ZnS. Such enhanced ordering of structure possibly also facilitates ilm growth rate and enhanced thickness due to tin doping.
The Rietveld output ZnS is shown in Figure 2. Figure 2
The indexed selected area electron difraction (SAED) pattern of undoped ZnS is shown in Figure 3 (a). The observed
difraction planes are (100), (002), (101), (110) and (112) respectively. These are accordance with the result obtained from XRD data and conirm the presence of hexagonal phase. The d value of ~3.32 Å in the HRTEM image (Figure 3b) for observed lattice fringe (region 1) for the irst difraction ring corresponding to (100) plane compares well with JCPDS data. The region 2 shows two planes (100) and (101) overlap each other. The particle size obtained from the TEM image is around 12-20 nm as shown in Figure 3(c). A histogram is plotted (Figure 3(d)) to get the idea about the distribution of particle size. Most of the particles are distributed in the range 14-18 nm. Average value of the particle size is about 16.5 nm which compares well with x-ray value of ~12.51 nm.
Figure 1: X-ray difraction pattern of (a) ZnS, (b) 2.5% Sn: ZnS
and (c) 5% Sn: ZnS.
of lattice parameters obtained from Rietveld reinement are a = b = 3.872 ± 0.000757 Å and c = 6.290 ± 0.00317 Å. The corresponding values for 2.5% Sn: ZnS are 3.895 ± 0.00082 Å
and 6.263 ± 0.00281 Å respectively while they are 3.943 ± 0.001Å and 6.269 ± 0.0033 Å respectively for 5% Sn: ZnS. The average value of particle size estimated from Rietveld reinement using MAUD software are ~12.51 nm, ~11.92 nm and ~10.61 nm for ZnS, 2.5% Sn: ZnS and 5% Sn: ZnS sample respectively. Thus a reduction of particle size was observed due to tin doping. The microstrain (ε)in the ilms increased due to tin incorporation. The value of average microstrain enhanced from ~2.787×10‒3 for ZnS to ~2.971×10‒3 for 5%
Sn: ZnS.The decrease in average particle size might be due
tothe enhancement of strain in the ilm. Similar efects of decrease of particle size with increasing strain have been reported for Cd doping in ZnO thin ilm 27. As explained in
some literature, such increase in strain energy may lead to enhanced polycrystallinity22,28 i.e. reduction of particle size.
Figure 2: Reitveld output of ZnS [experimental (dotted) and itted
(continuous)].
Figure 3. (a) Selected area electron difraction (SAED) image of ZnS; (b) HRTEM image showing inter-planar distances d
100 and d101
of hexagonal ZnS; (c) TEM image showing nanometer size particles
of ZnS; and (d) histogram of particle size distribution.
FESEM micrographs of ZnS and 5% Sn: ZnS is shown
is Figures 4(a) and 4(b) respectively. Uniform and good surface morphology can be concluded from FESEM images. Agglomeration of small crystallites is found to be present in certain regions on the ilm surface indicating that the particles formed cluster over the glass substrate during chemical bath deposition process. There are also some holes between the particles indicating porosity of the obtained ilms. No signiicant change in surface morphology is observed due to tin doping.
Although no compositional analysis was attempted in the present study, the incorporation of Sn in the ilms was veriied
by the EDAX result. Figure 5 shows the energy dispersive X-ray spectrum of 5% Sn: ZnS ilm. The spectrum reveals
the presence of Zn, S and Sn elements in the deposited ilm.
which appears possibly from zinc acetate and/or thiourea used during bath preparation.
Figure 5: EDX pattern of 5% Sn: ZnS.
Figure 4: FESEM image of (a) ZnS and (b) 5% Sn: ZnS.
Figure 6 shows optical absorbance spectrum [absorbance (A) as a function of wavelength (λ)] for ZnS and Sn doped ZnS
ilms. The absorbance coeicient increases with increasing Sn
doping for the entire wavelength range. Increase of absorbance implies decrease of transmittance which might be due to enhanced thickness due to Sn incorporation. This might be
attributed to increase of ilm thickness due to tin enrichment. Although no systematic thickness measurement was carried out in our work, a rough and ready gravimetric technique (measuring the weight change of the substrate due to ilm deposition and dividing this by area of ilm deposition and known density of the material) shows increase of thickness with tin enrichment (~1300 nm for pure ZnS to ~1400 nm for
highest tin content ilm).Band gap energy (Eg) was derived from the mathematical treatment of the data obtained from the absorbance vs. wavelength spectrum for direct band gap
ZnS29 using Tauc’s relationship30:
where ν is the photon frequency, A is a function of index
of refraction and hole/electron efective masses and h is the Planck’s constant. Absorption coeicient (α) was evaluated
Figure 6: Absorbance versus photon wavelength for (a) ZnS, (b)
2.5% Sn: ZnS and (c) 5% Sn: ZnS.
from the relation A = 2.303αt and using the measured values of thicknesses (t) for ZnS and Sn doped ZnS ilms. Figure 7
shows the plot of (αhv)2 as a function of photon energy hv. Extrapolation of the line to the base line, where the value of (αhv)2 is zero, gives band gap E
g. The sharp absorption edge corresponding to the band gap conirms the good quality of the ilms. The band gap energy increases from ~3.69 eV for
ZnS to ~ 3.90 eV for 5% Sn: ZnS indicating a blue shift.
Incidentally the band gap of tin sulphide is much lower than that of zinc sulphide and thus incorporation of tin should have caused red shift in band gap. Thus it appears that a particle size reduction of ~15% only cannot lead to such enhancement in band gap. Since the particle sizes observed are much higher than the ZnS Bohr exciton radius, quantum coninement
efect is obviously not the reason behind such a blue shift. The only other possible reason might be enhancement of relative intensity of the major difraction peak corresponding to hexagonal wurtzite structure (100 plane). Such enhancement of relative intensity implies more ordered structure and a band gap closer to bulk value3. Nasr et al3 observed such ordering due to pH variation of the reactants. In our case, we get it as a result of enhanced tin incorporation. Thus the enhancement in band gap may be ascribed enhancement of structure ordering resulting from enhancement of relative intensity of the major difraction peak of hexagonal wurtzite structure. In hexagonal wurtzite structure, the band gap can even reach a very high value of ~4.4 eV31.
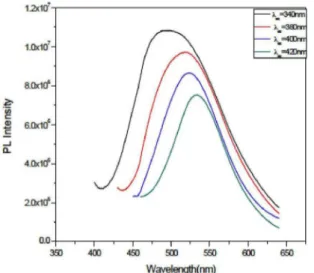
Dependence of photoluminescence (PL) spectra of ZnS
ilms on the excitation wavelength (λex) has been investigated. Figure 8 shows the PL intensity spectrum is plotted against wavelength for diferent excitation wavelength (340-420 nm). A redshift has been observed with increase of excitation wavelength which may be due to diferent contribution of excitonic emissions and their phonon replicas32. The intensity of the peaks decreases with excitation wavelength. ( h ) A h( Eg)
2
-and (110) hexagonal planes. The major peak along with the other peaks is shifted slightly towards lower angles for tin doped ilms. This observation along with EDX observation conirms the replacement of zinc ion by tin ions in the ZnS
lattice. Sn doping increases the fundamental absorption edge.
The band gap energy increases from ~ 3.69 eV for ZnS to ~ 3.90 eV for 5% Sn: ZnS. Such enhancement of bandgap
might be due to enhancement of relative intensity of the major difraction peak (100) corresponding to hexagonal wurtzite structure consequently leasing to a more ordered structure. The materials are therefore useful for conigurations that involve bandgap engineering.
5. Acknowledgement
Theauthors acknowledge the instrumental support from DST (Govt. of India) under departmental FIST programme (Grant No. SR/FST/PS-II-001/2011). The authors also acknowledge Dr. M. Fu, School of Materials Science and Engineering, North West Polytechnical University, Xi’an, Shannxi, China for recording the TEM images.
6. References
1. Ozutok F, Erturk E, Bilgin V. Growth, Electrical, and Optical Study of ZnS:Mn Thin Films. Acta Physica Polonica A.
2012;121(1):221-223. DOI: 10.12693/APhysPolA.121.221 2. Rawlins TGR, Woodward RJ. Sputtered zinc sulphide ilms
on silicon. Journal of Materials Science.1972;7(3):257-264.
DOI: 10.1007/BF00555626
3. Nasr TB, Kamoun N, Kanzari M, Bennaceur R. Efect of pH on the properties of ZnS thin ilms grown by chemical bath
deposition. Thin Solid Films. 2006;500(1-2):4-8. DOI: 10.1016/j.
tsf.2005.11.030
4. Shinde MS, Ahirrao PB, Patil IJ, Patil RS. Studies on nanocrystalline ZnS thin ilms prepared by modiied chemical
bath deposition method. Indian Journal of Pure & Applied
Physics. 2011;49(11):765-768.
5. Thi TM, Hien NT, Thu DX, Trung VQ. Thin ilms containing Mn-doped ZnS nanocrystals synthesised by chemical method and study of some of their optical properties. Journal of Experimental Nanoscience. 2012;8(5):694-702. DOI:
10.1080/17458080.2011.599045
6. Hachiya S, Shen Q, Toyada T. Efect of ZnS coatings on the enhancement of the photovoltaic properties of PbS quantum dot-sensitized solar cells. Journal ofApplied Physics.
2012;111(10):104315. DOI: 10.1063/1.4720468
7. Tec-Yam S, Rojas J, Rejón V, Oliva AI. High quality antirelective ZnS thin ilms prepared by chemical bath deposition. Materials Chemistry and Physics.2012;136(2-3):386-393. DOI: 10.1016/j. matchemphys.2012.06.063
8. Pawar MJ, Nimkar SD, Nandurkar PP, Tale AS, Deshmukh SB, Chaure SS. Efect of Sn2+ Doping on Optical Properties
of Thiourea Capped ZnS Nanoparticles. Chalcogenide Letters.
2010;7(2):139-143.
Figure 7: Plot of (αhv)2 versus hv for (a) ZnS, (b) 2.5% Sn: ZnS
and (c) 5% Sn: ZnS.
Figure 8: PL spectrum of ZnS ilm for diferent excitation wavelengths.
4. Conclusion
The primary aim of the present investigation was to explore the possibility of doping ZnS with tin by CBD
method. Sn doped ZnS ilms with diferent percentage of Sn
content (2.5% and 5%) could be successfully synthesized through this technique for the irst time to the best of our knowledge. The ilms had good adherence to the substrate. Apart from being an inexpensive and simple technique, the method uses milder reaction conditions than those employed by most chemical methods proposed in the literature. Particle size evaluated using Reitveld technique using MAUD software a constantly decreasing trend with increasing tin incorporation. The average particle size of ~12.51 nm for ZnSevaluated by X-ray technique is on the
9. Baranski AS, Bennet MS, Fawcett WR. The physical properties of CdS thin ilms electrodeposited from aqueous diethylene glycol
solutions. Journal of Applied Physics. 1983;54(11):6390-6394.
DOI: 10.1063/1.331916
10. Turan E, Zor M, Aybek AS, Kul M. Electrical properties of ZnO/Au/ZnS/Au ilms deposited by ultrasonic spray pyrolysis. Thin Solid Films.2007;515(24):8752-8755. DOI: 10.1016/j.
tsf.2007.04.001
11. Daranfed W, Aida MS, Hafdallah A, Lekiket H. Substrate temperature inluence on ZnS thin ilms prepared by ultrasonic
spray. Thin Solid Films.2009;518(4):1082-1084. DOI: 10.1016/j.
tsf.2009.03.227
12. Ubale AU, Kulkarni DK. Preparation and study of thickness dependent electrical characteristics of zinc sulide thin ilms. Bulletin of Materials Science.2005;28(1):43-47. DOI: 10.1007/
BF02711171
13. Goudarzi A, Aval GM, Sahraei R, Ahmadpoor H. Ammonia-free chemical bath deposition of nanocrystalline ZnS thin ilm bufer layer for solar cells. Thin Solid Films. 2008;516(15):4953-4957. DOI: 10.1016/j.tsf.2007.09.051
14. Gayou VL, Salazar-Hernandez B, Constantino ME, Andrés ER, Díaz T, Macuil RD, et al. Structural studies of ZnS thin ilms grown on GaAs by RF magnetron sputtering. Vacuum.
2010;84(10):1191-1194. DOI: 10.1016/j.vacuum.2009.10.023
15. Agawane GL, Shin SW, Moholkar AV, Gurav KV, Yun JH, Lee JY, et al. Non-toxic complexing agent Tri-sodium citrate’s efect on chemical bath deposited ZnS thin ilms and its growth
mechanism. Journal of Alloys and Compounds.
2012;535:53-61. DOI: 10.1016/j.jallcom.2012.04.073
16. Öztaş M, Bedir M, Yazici AN, Kafadar EV, Toktamış H. Characterization of copper-doped sprayed ZnS thin ilms. Physica B: Condensed Matter.2006;381(1-2):40-46. DOI:
10.1016/j.physb.2005.12.248
17. Ortíz-Ramos DE, González LA, Ramirez-Bon R. p-Type transparent Cu doped ZnS thin ilms by the chemical bath
deposition method. Materials Letters.2014;124:267-270. DOI:
10.1016/j.matlet.2014.03.082
18. Peng WG, Cong GW, Qu SC, Wang ZG. Synthesis and photoluminescence of ZnS:Cu nanoparticles. Optical Materials.
2006;29(2-3):313-317. DOI: 10.1016/j.optmat.2005.10.003 19. Goudarzi A, Aval GM, Park SS, Choi M, Sahraei R, Ullah MH,
et al. Low-Temperature Growth of Nanocrystalline Mn-Doped ZnS Thin Films Prepared by Chemical Bath Deposition and Optical Properties. Chemistry of Materials.
2009;21(12):2375-2385. DOI: 10.1021/cm803329w
20. Maity R, Chattopadhyay KK. Synthesis and optical characterization of ZnS and ZnS:Mn nanocrystalline thin ilms by chemical
route. Nanotechnology. 2004;15(7):812-816. DOI:
10.1088/0957-4484/15/7/017
21. Ummartyotin S, Bunnak N, Juntaro J, Sain M, Manuspiya H. Synthesis and luminescence properties of ZnS and metal (Mn, Cu)-doped-ZnS ceramic powder. Solid State Sciences.
2012;14(3):299-304. DOI: 10.1016/j.solidstatesciences.2011.12.005
22. Mondal S, Mitra P. Preparation of cadmium-doped ZnO thin ilms by SILAR and their characterization. Bulletin of Materials Science.2012;35(5):751-757. DOI: 10.1007/s12034-012-0350-2
23. Kale SS, Mane RS, Pathan HM, Shaikh AV, Joo OS, Han SH. Preparation and characterization of ZnTe thin ilms by SILAR
method. Applied Surface Science.2007;253(9):4335-4337.
DOI: 10.1016/j.apsusc.2006.09.043
24. Rietveld HM. A proile reinement method for nuclear and
magnetic structures. Journal of Applied Crystallography.
1969;2:65-71. DOI: 10.1107/S0021889869006558
25. Datta A, Pal M, Chakravorty D, Das D, Chintalpudi SN. Disorder
in Ni3Fe. Journal of Magnetism and Magnetic Materials.
1999;205(2-3):301-306. DOI: 10.1016/S0304-8853(99)00498-9 26. Pal M, Das D, Chintalpudi SN, Chakravorty D. Preparation of
nanocomposites containing iron and nickel-zinc ferrite. Journal of Materials Research.2000;15(3):683-688. DOI: 10.1557/
JMR.2000.0101
27. Maiti UN, Ghosh PK, Ahmed SF, Mitra MK, Chattopadhyay
KK. Structural, optical and photoelectron spectroscopic studies
of nano/micro ZnO:Cd rods synthesized via sol-gel route. Journal of Sol-Gel Science and Technology.2007;41(1):87-92.
DOI: 10.1007/s10971-006-0116-7
28. Lee YE, Kim YJ, Kim HJ. Thickness dependence of microstructural evolution of ZnO ilms deposited by rf magnetron sputtering. Journal of Materials Research.1998;13(5):1260-1265. DOI:
10.1557/JMR.1998.0180
29. Allouche NK, Nasr TB, Kamoun NK, Guasch C. Synthesis and properties of chemical bath deposited ZnS multilayer ilms. Materials Chemistry and Physics.2010;123(2-3):620-624.
DOI: 10.1016/j.matchemphys.2010.05.026
30. Tauc J, ed. Amorphous and Liquid Semiconductor. New York: Plenum Publishing; 1974. 441 p. DOI: 10.1007/978-1-4615-8705-7
31. Ghosh PK, Jana S, Nandy S, Chattopadhyay KK. Size-dependent optical and dielectric properties of nanocrystalline ZnS thin ilms synthesized via rf-magnetron sputtering technique. Material Research Bulletin. 2007;42(3):505-514. DOI: 10.1016/j. materresbull.2006.06.019
32. Khan F, Ameen S, Song M, Shin HS. Inluence of excitation
![Figure 6 shows optical absorbance spectrum [absorbance ( A ) as a function of wavelength (λ)] for ZnS and Sn doped ZnS ilms](https://thumb-eu.123doks.com/thumbv2/123dok_br/18883889.423354/4.765.65.372.368.616/figure-shows-optical-absorbance-spectrum-absorbance-function-wavelength.webp)