Adv. Geosci., 35, 15–21, 2013 www.adv-geosci.net/35/15/2013/ doi:10.5194/adgeo-35-15-2013
© Author(s) 2013. CC Attribution 3.0 License.
Advances in
Geosciences
Open Access
Geoscientiic
Geoscientiic
Geoscientiic
Geoscientiic
A common feature in latitudinal dependence of different geophysical
processes occurring on the rotating Earth
E. V. Sasorova1, B. W. Levin1,2, and M. V. Rodkin2,3
1Shirshov Institute of Oceanology, Russian Academy of Sciences, Moscow, Russia 2Institute of Marine Geology and Geophysics, FEB of RAS, Yuzhno-Sakhalinsk, Russia
3Institute of Earthquake Prediction Theory and Mathematical Geophysics, Russian Academy of Sciences, Moscow, Russia
Correspondence to:E. V. Sasorova (sasorova [email protected])
Received: 8 February 2013 – Revised: 16 April 2013 – Accepted: 18 April 2013 – Published: 25 June 2013
Abstract.The concept of an essential latitudinal dependence of different geophysical processes occurring on the rotating Earth was formed in the last two decades. The objective of this work is to present a few statistically reliable regularities in the latitudinal distributions of the following geophysical phenomena: earthquakes, hotspots, and major and super ma-jor ore deposits.
The similarity of latitudinal distributions for different geo-physical phenomena points to the existence of the “critical latitudes” in the rotating solid Earth.
1 Introduction
Two subsets of the worldwide seismic catalogs were used for the study of the earthquake (EQ) latitudinal distributions: the International Seismological Centre catalog (ISC, UK) from 1964 to date and the National Earthquake Information Cen-ter (NEIC USGS) catalog of the significant worldwide earth-quakes (2150 BC–1994 AD).
Firstly, we analyzed latitudinal distribution of seismic events. Data processing of the seismic events (about 25 0000 earthquakes with M≥4, compiled from the ISC catalog from 1964) was carried out. Because of the fact that quakes are concentrated along the plate boundaries, earth-quake number and released energy values are normalized by length of the lithospheric plate boundaries in the given inter-val of latitudes. Thus it was revealed that the seismic activity of Earth is almost absent in the high latitudes, and has clearly expressed two peaks in middle latitudes of the Northern Hemisphere(40◦–50◦) and the Southern Hemisphere (25◦– 40◦), and the local minimum near the Equator. These
bi-modal latitudinal distributions were observed both for a num-ber of seismic events and for the released energy values. The bimodal structure of the empirical distributions remains for shallow events, and for intermediate and deep earthquakes too.
The stability of the obtained bimodal distributions in time and in space was also shown.
The published data of various authors (Stothers, 1993; Courtillot et al., 2003) were used to analyze of the hotspot spatial distributions. These distributions also display the same bimodal character (peaks at 20◦–30◦S and 20◦–40◦N, local minimum on 0◦–20◦N, and almost zero values at high latitudes).
The study of the latitudinal distributions of the major and super major ore deposits was fulfilled on the basis of data obtained from the geographic information system (GIS) “Largest Mineral Deposits of the World” (Commission on Geological Map of the World, 2006), which was carried out under the direction of Prof. D. V. Rundkvist. The version used contains data of 1242 major and super major ore posits. It was revealed that the latitudinal distributions of de-posit number and dede-posit density (in 10◦latitude belts) also have bimodal character (peaks at 20◦–30◦S and 40◦–60◦N, local minimum on 10◦–20◦N, and almost zero values at high latitudes).
2 Latitudinal distribution of the earthquake density and density of the released energy
Fig. 1.The distribution of the EQ occurring since 1980 withM >4 on the world map (data from ISC catalog). The epicenters are marked by color circles: 1 for 0≤H≤70, 2 for 70< H≤200, 3 for 200< H≤400, and 4 for 400< H;His a hypocenter depth (km).
in the distribution of EQ epicenters over Earth (Gutenberg and Richter, 1942). The concept of dependence of seismicity on latitudinal disposition was formed in the last two decades (Mogi, 1985; Sun, 1992; Levin and Sasorova, 2009a; Riguzzi et al., 2010). The objective of this part of this work is to find statistically reliable, stable regularities in the latitudinal dis-tributions of earthquakes of different energy characterizing the global seismicity of Earth.
We used the data from the ISC with preliminary stan-dardization of magnitudes and removal of aftershocks (by program, Smirnov, 1997). We processed the earthquakes with magnitudesM≥4.0 that occurred from 1964 (a total of more than 250 000 events). Since the events of differ-ent energetic levels can differ in the character of latitude– depth distributions, in this work we studied the distributions separately for six magnitude ranges (MRs): 4.0≤M <4.5; 4.5≤M <5.0; 5.0≤M <5.5; 5.5≤M <6.0; 6.0≤M <
6.5; and 6.5≤M. The separation of an event set into several subsets with different magnitude ranges allows us to analyze the peculiarity of the seismic process for various energy lev-els. The whole studied area was divided into 18 latitudinal intervals (belts) each 10◦wide.
Because of the fact that most earthquakes are concentrated along the boundaries of lithospheric plates, normalization of earthquake number and released energy by length of the lithospheric plate boundaries in every single latitudinal belt was done. The EQ epicenter locations in the world are pre-sented in Fig. 1. Such normalization determines the average number of earthquakes generated per every 100 km of plate
boundary. It allows us to compare seismic activity of latitu-dinal belts in different parts of Earth.
Thus we have defined the following values:
– a linear density of the seismic event number,Npi,k=
Ni,k/Li, whereNi,kis the number of the seismic events
in given latitudinal belti(1≤i≤18), forkmagnitude range (MR, 1≤k≤6) and Li is the length of
litho-spheric plate boundaries (km) in the studied belt; – a relative density of seismic events for the studied belt,
ˆ
Npi,k=Npi,k
i=L
P
i=1
Ni,k(varied from 0 to 1);
– a density of the energy released by EQs in a given lati-tudinal belti,Epi=Ei/Li.
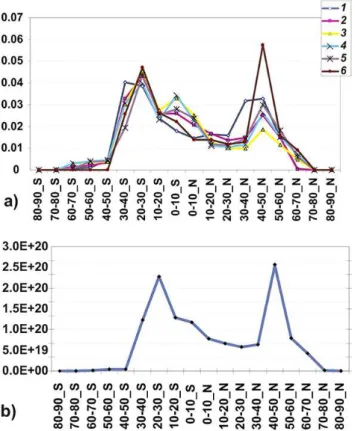
An analysis of the EQ density distributions showed that seis-mic activity of the planet is almost absent at the poles and at polar caps of the planet, whereas it has clearly expressed peaks in middle latitudes of the Northern Hemisphere and the Southern Hemisphere (40–50◦N and 20–35◦S) and sta-ble local minimum near the Equator (10–20◦N). Thus the empirical distributions (Fig. 2a) of the EQ density have a dis-tinct bimodal structure. Similar distributions are obtained as for a density of seismic events and for released energy as well (Fig. 2b). It should be noted that the latitudinal distributions of the EQ density and released energy are asymmetric with respect to the Equator, and they are shifted northwards.
E. V. Sasorova et al.: Geophysical processes occurring on the rotating Earth 17
Fig. 2. (a)Distributions of the relative seismic event density (the ˆ
Npi,k values) over latitude belts for 6 magnitude ranges: 1 for
4.0≤M <4.5, 2 for 4.5≤M <5.0, 3 for 5.0≤M <5.5, 4 for 5.5≤M <6.0, 5 for 6.0≤M <6.5, and 6 for 6.5≤M.(b)The distribution of the energy density (theEpi values) over latitudinal
belts.
events in all MRs were doubled for four ten-year periods. In spite of the fact that the total number amount of EQs in different ten-year periods may significantly vary, all the above-noted peculiarities in latitudinal distributions have re-mained. Next we repeat the calculations of the EQ density distributions using other sizes of the latitudinal belts (5◦and 2◦wide). In these cases, similar bimodal distributions as for ten-degree latitudinal scale were obtained.
The EQ density distributions for two-degree latitudinal scale are presented in Fig. 3. It should be noted that basic features of the distributions shown in Fig. 3 and Fig. 2a (ten-degree scale) are similar. But in the case of two-(ten-degree scale, also the same regional peculiarity of the EQ distributions was reflected (Sasorova and Levin, 2009b).
The analysis of the observation data has showed that lati-tudinal distributions of the seismic event density for all MRs and released energy possess the stable bimodal configuration. Let us propose that EQs are distributed uniformly along the lithosphere plates and bimodal distributions emerge in a ran-dom manner from uniform distribution. Then the probability of occurrence of such bimodal distributions for six
magni-Fig. 3. Four latitudinal distributions of event relative density (Npˆ i,k)for four magnitude ranges (size of the latitude belt – two
degrees): 1 for 4.0≤M <4.5, 2 for 4.5≤M <5.0, 3 for 5.0≤ M <5.5, and 4 for 5.5≤M <6.0.
tude ranges according to the Pearson criterion varies from 1×10⁻⁷to 1×10⁻⁵.
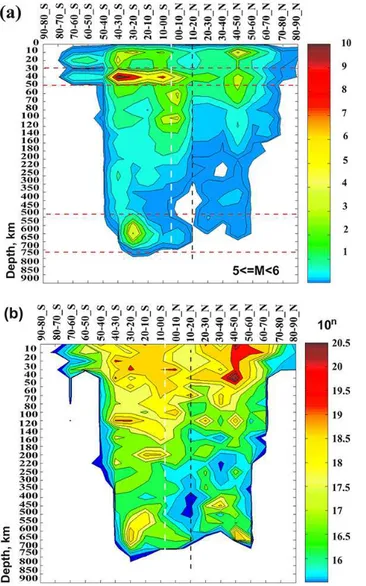
It was shown that bimodal structure of the empirical distri-butions remains for shallow events, and for intermediate and deep earthquakes. Therefore, we analyzed two-dimensional distributions of earthquake density and released energy (by latitudes and depths) using ten-degree latitudinal scale. The two-dimensional distribution of the event density for MR 5≤M <6 is presented in Fig. 4a. A clear spatial clustering of events is traced by both latitudes and depths. Event con-centrations are distinguished at latitudes of 20◦–35◦S and 40◦–50◦N and at depths of 0–60, 100–250, and 500–700 km. A sharp decrease in the event density near the Equator (10◦– 20◦N) and almost complete absence of the events in polar latitudes are found also. Clusters with the maximal number of events for deep earthquakes (500≤H <750 km) are located closer to the Equator than clusters of crustal earthquakes. Similar two-dimensional distributions were obtained for all MRs. The two-dimensional distribution of the energy den-sity is shown in Fig. 4b. In this case clear spatial clustering of the energy is also very evident.
The full interval of observations in the EQ density distri-butions presented above is equal to 47 yr. Thus we try to use the NEIC catalog (NEIC USGS) of the significant world-wide earthquakes (2150 BC–1994 AD) to extend the period of the observation (up to 4100 yr). Total number of events withM≥5 is equal to 2809.
Fig. 4.Two-dimensional distribution of the seismic event density for magnitude range 5≤M <6(a)and two-dimensional distribu-tion of the released energy in logarithmic scale(b). The vertical axes are depth in km, and horizontal ones are latitudinal belts. The color scales of the density of event number and of the released seis-mic energy are given on the right of corresponding plot. The black dotted vertical lines show the position of minimum of seismicity oc-curring in the equatorial zone. The red dotted horizontal lines limit the depth intervals of maxima of seismic activity. The white solid vertical lines correspond to the Equator.
this part of the diagram. The full interval of observation in this case is more then 4000 yr. And observations connected with the period 1800–1996 will be compressed in very nar-row bounds. That is why we use two horizontal scales in Fig. 5 (the serial number of the time-ordered seismic events in catalog (equidistant bottom scale) and the second one (up-per) is nonuniform horizontal time axis).
Hence bimodal function of the seismic activity distribu-tion on Earth is not a random fluctuadistribu-tion, and two peaks of these distributions located in middle latitudes of the
North-Fig. 5. The latitudinal distribution of strong historical earth-quakes (from catalog of the significant worldwide earthearth-quakes NEIC/USGS from 2150 BC until 1995 AD). The serial number of the time-ordered seismic events in the catalog is given along the bottom equidistant horizontal axis (black labels). The years of earth-quake occurrences are given by magenta color labels on the upper nonuniform time scale (magenta grid vertical lines). The latitude of earthquake is given along ordinate axis.
ern Hemisphere and the Southern Hemisphere (40–50◦N and 20–35◦S) show the existence of latitude belts where clearly expressed intensification of the seismic process in a wide range of the depths (from 0 to 700 km) occurred.
It may be interesting to remark that the latitudinal distri-butions of the moonquakes (Fig. 6) are described also by a bimodal function with two peaks in middle latitudes, lo-cal minimum near the Equator and practilo-cal zero values in high latitudes (Levin and Sasorova, 2010). Thus, global fea-tures of the latitudinal distributions are the same for Earth and the Moon. The data compiled from work of Lammlein (1977), based on the observations obtained from seismic sta-tions established on the lunar surface in frame of the project “Apollo” (1971–1974), were used by authors for the calcula-tion of the latitudinal distribucalcula-tions of lunar seismic events.
3 The latitudinal distributions of hotspots
In this part of our work we have data about latitudinal dis-tribution of the Earth hotspots published before (Stothers, 1993; Courtillot et al., 2003).
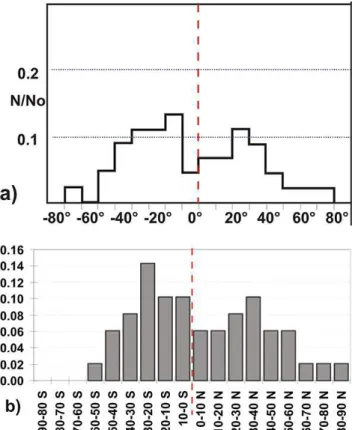
The latitudinal distribution of the hotspot relative number (N/N0) according to the work of Stothers (1993) is presented
E. V. Sasorova et al.: Geophysical processes occurring on the rotating Earth 19
Fig. 6. Latitudinal distribution of moonquakes (total number of events – 844). The horizontal axis shows Moon latitudinal belts (10◦ wide), vertical axis – number of moonquakes (data from Lammlein (1977)). The green dotted vertical line corresponds to the Equator, two peaks of the seismic activity on the Moon marked by red dotted vertical lines.
equal to 45. The latitudinal distribution of the Earth hotspot relative number manifests as a bimodal structure with two peaks in the Northern Hemisphere and the Southern Hemi-sphere (20◦–40◦N and 10◦–20◦S), local minimum near the Equator (10◦S–0◦), negligible values in the high latitudes and zero values in polar caps. This distribution agrees with latitudinal distributions of the EQ density obtained in our work on the qualitative level.
The latitudinal distribution of the Earth hotspot relative number according to the work of Courtillot et al. (2003) is presented in Fig. 7b. The common number of studied objects is equal to 49. In this case the latitudinal distribution of the Earth hotspot number shows clearly expressed peaks in mid-dle latitudes of the Northern Hemisphere and the Southern Hemisphere (30–40◦N and 20–30◦S), local minimum near the Equator (0–20◦N), zero values in the high latitude in the Southern Hemisphere and negligible values in the high lati-tude in the Northern Hemisphere. These results are in good agreement with our results presented above. It should be noted that the hotspot latitudinal distributions are asymmet-ric with respect to the Equator; they are shifted northwards as the latitudinal distributions of the EQ density and released energy.
Thus bimodal structure of the latitudinal distributions of the Earth hotspots also shows the existence of the areas in the Earth shell where there is manifested intensification of the geophysics processes.
4 The latitudinal distributions of the major and super major ore deposits
The study of the latitudinal distributions of the major and su-per major ore deposits was fulfilled on the basis of data
ob-Fig. 7.The latitudinal distributions of the Earth hotspot relative numbers: fragment(a)adopted from the work of Stothers (1993); fragment(b) adopted from work of Courtillot et al. (2003). The horizontal axes show latitudinal belts (10◦wide), vertical axes – relative number of the Earth hotspots. The red dotted vertical lines on both fragments correspond to the Equator.
tained from the GIS “Largest Mineral Deposits of the World” (Commission on Geological Map of the World, 2006). The current version contains data about 1241 major and super major ore deposits. The data in GIS are constantly supple-mented. Every deposit is described by a lot of parameters, but in this analysis we need only one – latitude.
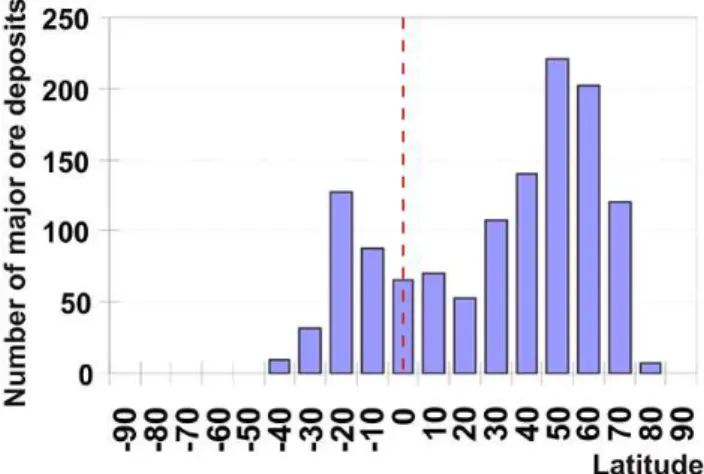
The latitudinal distributions of the deposit number and deposit density (in ten-degree latitudinal scale) were calcu-lated. The latitudinal distribution of the deposit number is presented in Fig. 8. To obtain the deposit density, we used normalization of the number of deposits in every latitudinal belt by the square of given belt. Two distributions (number of deposits and deposit density) are in very close agreement for latitudinal interval from 90◦S up to 30◦N and differ only on the latitudes from 40◦N to 70◦N because of sharp decreasing of the normalization coefficient.
Fig. 8.The distribution of the major and super major ore deposit number over latitudes (bar chart). The horizontal axis shows latitu-dinal belts (10◦wide), vertical axis – number of deposits. The red dotted vertical line corresponds to the Equator.
and for the hotspots). The deposit latitudinal distributions also are asymmetric with respect to the Equator; they are shifted northwards as the latitudinal distributions of the EQ density and released energy. It should be noted that the de-posit distribution reflected very long duration processes that take place in the solid Earth interior.
5 Conclusions
Distribution bimodal functions for a number of geophysical processes on Earth are not a random fluctuation, and two peaks of these distributions located in middle latitudes of the Northern Hemisphere and the Southern Hemisphere (40– 50◦N and 20–35◦S) show the existence of the areas in the Earth shell where clearly expressed intensification of some geophysical processes occurred.
The similarity of latitudinal distributions for different geo-physical phenomena points out the existence of the “critical latitudes” in the solid shell of Earth. The existence of the crit-ical latitudes (at±35◦) in the atmosphere and hydrosphere of Earth is well known. But the existence of the critical latitude for the solid Earth is not universally recognized yet.
It should be noted that bimodal structure of the latitudi-nal distributions of the different physical phenomena with clearly expressed peaks in the middle latitudes takes place on some other rotating celestial bodies too. As it is already men-tioned above, bimodal structure occurs for the moonquake distribution over latitude. The apparent shell of the Sun exe-cutes complete revolutions around the rotation axis near the Equator approximately during 25 terrestrial days and near polar zones during 29 terrestrial days. The same effect is ob-served for Saturn and Jupiter and its satellite (Moffatt, 1978). Angular velocity gradient of the Sun over heliographic
lati-45 times, and the difference in released energy is more than 100 times. At the same time, the maximum difference in the plate traveling velocities in subduction zones (from 5◦N to 45◦S) is no more than 10 %. Now the author team is trying to search for the geophysical explanation of anomalous in-tensification of geophysical processes on the basis of plate tectonics, of tidal processes and of the variations of Earth’s rotation velocity.
Acknowledgements. This work was supported in part by the Rus-sian Foundation for Basic Research (project No. 10-05-00116a).
Edited by: K. Tokeshi
Reviewed by: G. Papadopoulos and Y. A. Stepanyants
References
Courtillot, V., Davaillle, A., Besse, J., and Stock, J.: Three distinct types of hotspots in the Earth‘s mantle, Earth Planet. Sc. Lett., 205, 295–308, 2003.
GIS, Largest Mineral Deposits of the World, CD-ROM, Commis-sion on Geological Map of the World, 2006.
Gutenberg, B. and Richter, C. F.: Magnitude, intensity, energy and acceleration as earthquake parameters, Bull. Seism. Soc. Amer., 32, 3, 163–170, 1942.
(ISC), International Seismological Catalogue: http://www.isc.ac.uk/ iscbulletin/search/catalogue/, last access: 19 June 2013. Lammlein, D. R.: Lunar seismicity and tectonics, Phys. Earth Planet
Inter., 14, 224–273, 1977.
Levin, B. W. and Sasorova, E. V.: Bimodal Character of Latitudinal Earthquake Distributions in the Pacific Region as a Manifestation of Global Seismicity, Dok. Earth Sci., 424, 175–179, 2009a. Levin, B. W. and Sasorova, E. V.: Latitudinal distribution of
earth-quakes in the Andes and its peculiarity, Adv. Geosci., 22, 139– 145, doi:10.5194/adgeo-22-139-2009, 2009b.
Levin, B. W. and Sasorova, E. V.: General Regularities in the Dis-tribution of Seismic Events on the Earth and on the Moon, Dok. Earth Sci., 434, 1249–1252, 2010.
Levin, B. W., Sasorova, E. V., and Domanski, A. V.: Seismic evi-dences of the Earth rotation contribution in geodynamics, Geo-physical Research Abstracts, 13, EGU2011-2030, 2011 EGU General Assembly 2011, Vienna, Austria, 2–8 April, 2011. Moffatt, H. K.: Magnetic field generation in electrically conducting
fluids, Cambrige Univ. Press, 1978.
E. V. Sasorova et al.: Geophysical processes occurring on the rotating Earth 21
NEIC USGS: http://www.ncedc.org/anss/catalog-search.html and http://www.ngdc.noaa.gov/nndc/struts/form?t=101650&s= 1&d=1, last access: 19 June 2013.
Riguzzi, F., Panza, G., Varga, P., and Doglioni, C.: Can Earth’ s rota-tion and tidal despinning drive plate tectonics?, Tectonophysics, 484, 60–73, 2010.
Smirnov, V. B.: Experience in Estimating Representative Data of Earthquake Catalogue, Volkanology and Seismology, 4, 93–105, 1997.
Stothers, R. B.: Hotspots and Sunspots: surface traces of deep man-tle convection in the Earth and Sun, Earth Planet Sc. Lett., 116, 1–8, 1993.