405 Braz. J. Biol., 2010, vol. 70, no. 2, p. 405-407
Alternative method for quantification of alfa-amylase activity
Farias, DF.
a, Carvalho, AFU.
a*, Oliveira, CC.
b, Sousa, NM.
a,
Rocha-Bezerrra, LCB.
a, Ferreira, PMP.
c, Lima, GPG.
aand Hissa, DC.
aaDepartamento de Biologia, Universidade Federal do Ceará – UFC, Campus do Pici, CEP 60455-970, Fortaleza, CE, Brazil
bDepartamento de Farmacologia, Universidade Federal do Ceará – UFC, Fortaleza, CE, Brazil
cCampus Senador Helvídio Nunes de Barros, Universidade Federal do Piauí – UFPI, CEP 64600-000, Picos, PI, Brazil
*e-mail: [email protected]
Received November 27, 2008 – Accepted February 26, 2009 – Distributed May 31, 2010 (With 2 igures)
Abstract
A modiication of the sensitive agar diffusion method was developed for macro-scale determination of alfa-amylase. The proposed modiications lower costs with the utilisation of starch as substrate and agar as supporting medium. Thus, a standard curve was built using alfa-amylase solution from Aspergillus oryzae, with concentrations ranging from 2.4 to 7,500 U.mL–1. Clear radial diffusion zones were measured after 4 hours of incubation at 20 °C. A linear
relationship between the logarithm of enzyme activities and the area of clear zones was obtained. The method was validated by testing α-amylase from barley at the concentrations of 2.4; 60; 300 and 1,500 U.mL–1. The proposed
method turned out to be simpler, faster, less expensive and able to determine on a macro-scale α-amylase over a wide range (2.4 to 7,500 U.mL–1) in scientiic investigation as well as in teaching laboratory activities.
Keywords: alfa-amylase, alternative method, quantiication.
Alternativa para quantificação de alfa-amilase
Resumo
Modiicações foram propostas ao método sensível de difusão em ágar para a macrodeterminação de alfa-amilase. As modiicações propostas diminuem os custos, com a utilização de amido como substrato e ágar como meio so-lidiicante. Assim, foi construída uma curva padrão utilizando uma solução de alfa-amilase de Aspergillus oryzae
com concentrações variando de 2,4 a 7.500 U.mL–1. Em seguida, as zonas claras de difusão radial foram mensuradas
depois de 4 horas de incubação a 20 °C. Foi obtida uma relação linear entre o logaritmo da atividade enzimática e os diâmetros das zonas claras. O método foi validado utilizando-se soluções de alfa-amilase de cevada nas concentrações de 2,4; 60; 300 e 1.500 U.mL–1. O método tornou-se mais simples, rápido, com baixo custo e passível de ser utilizado
para macrodeterminação de alfa-amilase em ampla faixa (2,4 a 7.500 U.mL–1) na investigação cientíica e para ins
didáticos em aulas práticas.
Palavras-chave: alfa-amilase, método alternativo, quantiicação.
1. Introduction
In the early eighties, Tauschel and Rudolph (1982) proposed a new radial diffusion method for the deter-mination on a micro-scale of α-amylase activity in se-rum, urine and organic extracts as an alternative and/ or replacement of spectrophotometric methods used in those days. Among the several advantages, the pro-posed method was able to quantify the enzyme activity in a concentration-dependent way with excellent linear-ity and reliabillinear-ity over an extended concentration range (1-1100 mU.mL–1), correlating concentration with the
area of diffusion zones. These advantages were achieved through the utilisation of expensive chemical reagents making it inadequate for teaching purposes or even for scientiic research dealing with a large number of sam-ples, mainly when high sensitivity is not needed.
amy-Farias, DF. et al.
406 Braz. J. Biol., 2010, vol. 70, no. 2, p. 405-407
Fifty millilitres of agar-starch were prepared as de-scribed before and transferred to a plate. Six wells were made on the gel and 20 µL of each solution of α-amylase was innoculated to each one. The plates were incubated for 4 hours at 20 °C. Ten replicates were run to analyse the accuracy and reproducibility of the curve, using one-way analysis of variance (ANOVA, α = 0.01) followed by Newman-Keuls test (P < 0.01) (GraphPad program, Intuitive Software for Science, San Diego, CA).
Plates were stained with lugol solution to show the clear zones to be measured in two perpendicular direc-tions using a paquimeter. The total area of enzyme dif-fusion and action was calculated in cm2. It is important
to emphasise that the well areas were excluded from the measurements.
For validating the method, ten plates containing 50 mL of agar-starch were prepared as described above and diluted enzyme solutions were added to the wells. A puriied α-amylase from barley (EC 3.2.1.1., Sigma-Aldrich Co., St Louis, USA) was used as the valida-tion enzyme, which was previously prepared following the same conditions described previously. The area of the clear zones produced by solutions at 2.4; 60; 300; 1,500 U.mL–1 was compared to that produced by the
standard enzyme at the same concentrations and after the same incubation conditions.
2.3. Statistical analyses
In order to determine differences between clear zones areas, data (means ± standard deviation) were compared by one-way analysis of variance (ANOVA) followed by Newman-Keuls tests (P < 0.05) using the GraphPad pro-gram (Intuitive Software for Science, San Diego, CA). Variancy coeficient, Spearman correlation coeficient, ANOVA, Kolmogorov-Smirnov and t-student were uti-lised to analyse reproducibility and reliability of the methodology.
3. Results and Discussion
The proposed method to quantifyα-amylase showed to be effective. The starch on the plate was hydrolysed by
α-amylase and the hydrolysis products diffused through the medium. After the staining process, lugol produced clear areas around the wells containing the enzyme while the rest of the starch-containing agar medium showed the characteristic blue black colour due to complex iodine-starch formation. A similar reaction appears to occur in the Tauschel and Rudolph method, when enzyme hydro-lyzes Reactone Red 2 B-amylopectin, leading to clear zones formation. In both methods, clear zones depend on enzimatic concentration.
The increase in agar concentration led to decrease in clear zone area. In fact, agar might represent a physical barrier for enzyme migration. Based on these observa-tions it is suggested that 0.02 g.mL–1 would be the ideal
agar concentration, since it could provide adequate con-sistency of the medium and it was not characterised as an loclastic activity being revealed by lugol. Nevertheless,
the method was useful only for macrodetermination over a narrow range of activity (25 to 750 U.mL–1) and these
components continued to be used for a long time only for qualitative detection (Hankin and Anagnostakis,1975).
The present study proposed modiications to the method of α-amylase quantiication developed by Tauschel and Rudolph (1982) as an attempt to reduce costs and improve simplicity over a wide range of amy-lase activity.
2. Material and Methods
2.1. Reagents
Soluble starch (VETEC, Rio de Janeiro, Brazil) was used as enzymatic substrate; agar-agar (VETEC, Rio de Janeiro, Brazil) was used for medium solidii-cation; α-amylase from Aspergillus oryzae (Ahlburg) Cohn (EC 3.2.1.1, Sigma-Aldrich Co., USA) was used to produce a standard curve in order to represent the re-lation between enzymatic concentration and the area of clear radial diffusion zones; α-amylase from barley (EC 3.2.1.1., Sigma-Aldrich Co., USA) was used to validate the method and lugol solution (VETEC, Rio de Janeiro, Brazil) was used to reveal the clear zones through com-plex iodine-starch formation.
2.2. Experimental procedures
A stock solution was prepared with 0.1786 g of
α-amylase from Aspergillus oryzae in 1 mL of 20 mM fosfate buffer with 6 mM NaCl, pH 6.9 (Bergmeyer, 1974) (loading buffer). This solution (7,500 U.mL–1) was
serially ive-fold diluted up to 2.4 U.mL–1.
For establishing the ideal agar concentration, at constant starch concentration (0.01 g.mL–1), four
agar-starch plates containing loading buffer in increasing agar concentration (0.005 g.mL–1; 0.01 g.mL–1; 0.02 g.mL–1
and 0.04 g.mL–1) were prepared. To each plate, 20 µL
of the most and the +least concentrated α-amylase solu-tions (7,500 and 2.4 U.mL–1, respectively) were added,
leading to the formation of clear diffusion zones after 4 hours of incubation at 20 °C. Likewise, for establish-ing the ideal starch concentration, at constant agar con-centration (0.02 g.mL–1), the same procedure was done
with increasing starch concentration (0.0025 g.mL–1;
0.005 g.mL–1; 0.01 g.mL–1; 0.02 g.mL–1; 0.04 g.mL–1).
Following the determination of the ideal concentra-tions of agar and starch, the supporting medium for en-zymatic activity assay was prepared with 0.5 g of starch and 1.0 g of agar dissolved in 50 mL of loading buffer.
Thirty-six plates containing 25 mL of agar-starch were prepared as described above. To each plate, 20 µL of the highest and the lowest concentration of α-amylase solu-tions (7,500 and 2.4 U.mL–1) were innoculated, leading to
Alternative for quantiication of alfa-amylase
407 Braz. J. Biol., 2010, vol. 70, no. 2, p. 405-407
linearity zone, not being necessary sample dilutions. Hence, procedure errors might be prevented. However, it is dificult to explain why Mestecky et al. (1969) had reported that amyloclastic starch methods with the for-mation of a blue iodine complex are not linear over the whole tested range (25-750 U.mL–1). In the present work
a wider range was used (2.4-7,500 U.mL–1) and even so
the linearity could be observed. The high determination coeficient conirms the high correlation between the variables (r2 = 0.9839). The high Spearman coeficient
obtained (r = 0.9919) also conirms that the data are highly related. The regression analysis is represented by the equation y = 0.3777x.
The degradation clear zone areas (0.10 ± 0.02; 0.65 ± 0.03; 0.76 ± 0.10 and 1.05 ± 0.06 cm2) formed by
stand-ard α-amylase hydrolysis at four different concentrations revealed to be statistically similar (p > 0.01) to the ones produced by validation α-amylase (0.14 ± 0.01; 0.59 ± 0.02; 0.66 ± 0.04 and 0.87 ± 0.15 cm2) when compared at
the same concentrations (2.4; 60; 300 and 1,500 U.mL–1,
respectively), showing that the method is valid and vi-able for the macro scale determination of α-amylase.
4. Conclusion
The proposed method turned out to be simpler, fast-er, less expensive and able to determine on a macro-scale
α-amylase over a wide range in scientiic investigation as well as in teaching laboratory activities.
References
BERGMEYER, HU., 1974. Methods of enzymatic analysis. 2 ed. New York: Academic Press.
HANKIN, L. and ANAGNOSTAKIS, SL., 1975.The use of solid media for detection of enzyme production by fungi. Mycologia, vol. 67, p. 597-607.
MESTECKY, J., KRAUS, FW., HURST, DC. and VOIGHT, AS., 1969. A simple quantitative method for -amylase determinations. Analytical Biochemistry, 1969, vol. 30, no. 2, p. 190-198.
TAUSCHEL, HD. and RUDOLPH, C., 1982. A new sensitive radial diffusion method for microdetermination of alpha-amylase. Analytical Biochemistry, vol. 120, no. 2, p. 262-266. VOET, D. and VOET, JG., 2004. Biochemistry. 3 ed. Hoboken: John Wiley & Sons.
obstacle to an adequate clear zone formation. Similarly, it was also observed that when starch concentration increases, clear zone size decreases. This could be ex-plained by the fact that the enzyme reaches its saturation point rapidly when substrate is present in high concentra-tion, leading to a smaller enzymatic activity zone (Voet and Voet, 2004). Starch concentration of 0.01 g.mL–1 was
selected to provide a satisfactory measurement. The shortest time required for a satisfactory meas-urement, both for the highest (7,500 U.mL–1) and the
lowest (2.4 U.mL–1) concentration of enzyme solutions
was 4 hours. Such incubation time is comparable to that of the Tauschel and Rudolph method which is performed between 3 and 6 hours.
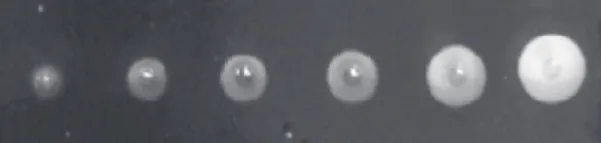
The obtained standard curve as well as that dem-onstrated by Tauschel and Rudolph (1982) revealed to be reliable and highly reproducible, conirmed by vari-ation analysis (ANOVA; p = 0.9998). The enzymatic activity zones according to decreasing concentrations of
Aspergillusoryzae α-amylase are shown in Figure 1. The curve demonstrated in Figure 2 showed that the clear zones were directly proportional to the logarithm of en-zyme concentration (U.mL–1) and presents a wide range
Figure 2. Standard curve. Linear relationship between the logarithmic of enzymatic concentration and the enzymatic degradation halos.