Journal of Engineering, Project, and Production Management
2012, 2(2), 78-87
Production Resource Management in the Industrialised
House-Building Supply Chain
Martin Lennartsson1 and Anders Björnfot2
1
PhD Student, Division of Structural and Construction Engineering, Luleå University of Technology, Luleå, Sweden, E-mail: marlen@ltu.se (corresponding author).
2
Assistant Professor, Faculty of Technology, Economy and Management, Gjøvik University College, Gjøvik, Norway, E-mail: anders.bjornfot@hig.no
Production Management
Received November 7, 2011; received revision January 19, 2012; accepted February 2, 2012 Available online February 27, 2012
_________________________________________________________________________________________
Abstract: Industrialised house-building suppliers must learn to see how the lack of resource management disrupt the synchronisation of their production processes both upstream (e.g. capability to forecast material consumption) and downstream (e.g. order delivery Just-in-Time). In contrast to focus on workflow as is more common in construction, Systematic Production Analysis (SPA) is a tool capable of providing a more robust production process in terms of better resource characterisation and predictability. A roadmap model, composed of six steps, has been developed for simple introduction of SPA. The model is a straightforward way of classifying the production system in terms of impacting resource and parameters attributing to production loss (scrap or downtime). The applicability of SPA is analysed through a pilot case study at a patio door manufacturer. Two main response parameters emerged related to scrap; surface and dimension errors of the work piece material (wood). An objective function was formulated to reduce the scrap without increasing the total cost of the work piece material. It was suggested that the case company evaluates Engineering Wood Products (EWP) leading to a more robust production process (less scrap), but in turn increasing the initial cost of the work piece material. Other potential measures are purchasing new processing tools, investing in new machinery or educating workers which all, directly or indirectly, lead to reduced scrap. Consequently, proper management of production resources will improve their predictability and in turn improve production control.
Keywords: Industrialised house-building, Production system, Robustness, Supply Chain Management, Systematic Production Analysis.
_________________________________________________________________________________________
1. Introduction
Swedish house-builders who utilise standardisation are frequently called industrial to reflect on their industrial maturity. These companies (both detached and multi-storey housing) demonstrate characteristics derived from manufacturing organisations. Core characteristics of mature production environments within this segment are standardised production processes in fixed manufacturing locations (Lennartsson and Björnfot, 2010), and standardised products and components, for example pre-defined building systems (Björnfot and Stehn, 2007) and even standard house portfolios as is more common in the detached housing industry. In the development of their production processes, Swedish industrial house-builders have strived to detach themselves from the traditional, project based, construction industry.
However, the current business climate demands an adaptation to a project-based reality (Ekholm and Molnár, 2009). As industrial house-builders strive to increase repetitiveness and standardisation, the current business environment is counterproductive. Especially, it becomes evident in the relation between the building company, or
assembler, and their subcontractors. Lu et al. (2011) argued that the shift towards manufacturing-oriented practices demands suppliers and subcontractors to become more responsive and agile. The increased level of industrialisation guided by waste reduction (e.g. lower inventories) and takt times put demands on suppliers to take a more active role within the supply chain. In other words, suppliers must synchronise their production process both upstream (e.g. capability to forecast material consumption) and downstream (e.g. deliver orders Just-in-Time).
“Japanese lake” methodology (Yamamoto and Bellgran, 2010), as areas of improvements are hidden due to the low staff utilisation. Lowering the buffer will expose the production process to issues beyond mere product development and process design, issues that instead are related to the actual work carried out on the shop floor, i.e. re-work, scrap rates and down times.
To continue production development it is vital that the production resources are controlled allowing for buffers to be reduced and the variation ranges to be narrowed, in turn providing a more robust production system, i.e. insensitive to disturbances. Production system design encompasses the organisation of resources for efficient production (Tolio et al., 2010), i.e. production system design does neither entail product development nor process design. In all production it is essential to find balance between costs and quality (Söderberg, 1994). Overcapacity is a cost, which has to be harmonized with customer focus; for business-to-business manufacturing this often translates to delivery according to schedule. Systematic Production Analysis (SPA) is a comprehensive tool that investigates production costs coupled to available resources and production loss derived from scrap and downtimes (Jönsson et al., 2008a, 2008b). The purpose of SPA is to enable systematic production system development.
The aim of this paper is to examine how SPA can be used to provide for a more robust production process in terms of better resource characterisation and predictability, i.e. emphasising production resource utilisation in contrast to work flow as used in Value Stream Mapping (VSM). Hence, SPA should be able to support the management of production in a project-based environment. The paper first provides a theoretical contextual background of the dominant project-oriented production systems in construction and in Swedish industrial house-building. Then, definitions of resources in the production system are presented, followed by the SPA methodology. A roadmap model has been developed for simple introduction of SPA. The applicability of SPA is analysed through a pilot case study at a patio door manufacturer, which is a continuation of the VSM case study in Björnfot et al. (2011).
2. Production Systems in Construction
The performance of the traditional construction production system is reliant on variability reduction, activity interdependence and uncertainty (Schramm et al., 2008). Koskela (2000) identifies seven different resource flows; construction design, components and materials, workers, equipment, space, connecting work and external conditions and stress the risk for high variability due to construction peculiarities, e.g. the use of traditional working methods (Arbulu, 2006). Moreover, construction production systems are temporary (Schramm et al., 2008) and products are mainly delivered as unique projects. Consequently, one variability inconsistency is geometry tolerances which in a traditional construction setting are managed with tacit knowledge (Milberg and Tommelein, 2003).
Industrialised construction implies application of industrial production methods originating from manufacturing to the traditional construction production system. The aim of industrialisation is to better control the on-site production process through, for example, proactive and active production control (Lennartsson et al., 2009). However, even if the variations are significantly reduced,
the industrialised construction production system is complex as the product is composed of numerous different components, often produced in separate locations, by different actors, and where the final point of assembly is the construction site. Also, the majority of production activities are still performed manually. Consequently, overall performance is dependent on the competence of the work force.
Höök (2008) concluded that the success for Swedish industrial house-builders is dependent on progressive development. The industrial house-builders have moved their production inside factories where work is performed in preset production processes with defined value flows (Meiling and Johnsson, 2008). However, the industrialised housing supply chain is immature, i.e. poor delivery precision, both from the perspective of time (late deliveries) but also from the quality perspective as faulty materials, work, or components are not uncommon (Lennartsson and Björnfot, 2010). The suppliers must align with the industrial house-builders production process, implying synchronization of deliveries with the production pace of the house-builders.
2.1. The Production System Defined in Terms of Resources
The production system can be viewed as the realisation of value-adding processing operations through organised sharing of human and technical resources (Ajaefobi and Weston, 2009). A view shared by Ballard et al. (2001), who argue that the production system has the goal to “do the job” by maximizing value and minimizing waste where “do the job” implies balancing of resources to obtain value and reduce waste. According to Foss (1997), the product and resources are interdependent entities meaning that products require several resources and many resources are applicable on several products. Ståhl (2008) characterised the production system in four resources: A: Tooling. A tool provides the material, or components, with correct measurements regarding geometry, surface and material attributes.
B: Work piece material. Work material is characterized by its geometry, surface and material characteristics, i.e. the work piece itself carries these attributes.
C: Manufacturing Process. The process relates to equipment (rigidity, cushion), process data (cutting data, power, temperatures), additives (lubricants, gas) and other preparation factors (sequence, changeovers).
D: Personnel. The human resource is related to administration, instructions, action plans, work form, responsibility and authority.
3. Systematic Production Analysis (SPA)
As industrial house-building companies work towards lean production, it becomes important to keep Work-In-Process (WIP) low. Therefore, resource coordination within production is essential, which also includes outsourced components, i.e. on-time deliveries and required quality. Systematic Production Analysis (SPA) takes its starting point in the resources available and evaluates the conditions in terms of production losses such as scrap rates and down times (Jönsson et al., 2008a).
3.1. Production Loss Rates
SPA (Jönsson et al., 2008a, 2008b; Ståhl, 2008) describes the current state in terms of resources (tooling, work piece material, manufacturing process and personnel) and calculates the production loss rates; scrap (qQ), down time
(qS) and takt (qP) for production process segments or
specific work stations (Eq. 1-3). The nomenclature for the different terms is given in Table 1 below.
N
N
1
q
0Q
(1)p s S
t
t
q
(2)v 0
0 P
t
t
1
q
(3)3.2. Response Parameters
To evaluate qQ, qS, and qP, production response parameters
are used to connect loss parameters with control factors (Fig. 1). The matrix can be used for different purposes, e.g. production follow-up, production system design, scenario simulations and cause-and-effect analyses of the connections between factors and parameters (Ståhl, 2008). In actuality, the response parameters dictate the condition (the “health”) of the production system (production loss rates) as they directly affect the resource costs. To identify critical factors and parameters for the factor groups A to D, the rows and columns are summarised. The method follows two steps:
1. Identify response parameters (e.g. Q1 to Qn)for the
product part regarding production prerequisites or function, e.g. for Q (scrap), Q1 could indicate surface defect, Q2
dimension error, etc. These Q-parameters calculates qQ
(Eq. 1). In the same manner, identification of S and P parameters are utilised for calculation of qS (Eq. 2) and qP
(Eq. 3).
2. Identify influencing factors in the resource groups A to D, A: Tooling, B: Work piece material, C: Manufacturing process, and D: Personnel. Each resource is a compilation of causes (e.g., A1 to An) for waste (Q, S, or P), e.g. for A.
tooling, A1 could indicate blunt tools, A2 inaccurate tools,
etc.
Table 1. SPA nomenclature
N Number of required parts [unit]
N0 Nominal batch size [unit]
t0 Nominal cycle time [min]
tS Down time [min]
tp Actual production time [min]
t0v Increase in cycle time to meet demands while avoiding down time [min]
qB Material waste rate
kA Initial costs of tooling [EUR/hour]
kB Initial cost of work piece material [EUR/hour]
kC1 Initial cost of equipment at service [EUR/hour]
kC2 Initial cost of equipment at down time [EUR/hour]
kD Initial cost of personnel [EUR/hour]
Tsu Setup time [min]
URP Degree of occupation
TPB Production time per batch
3.3. Resource cost Parameters
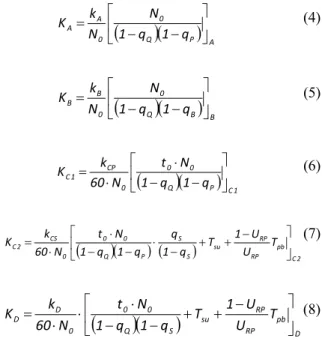
The production loss rates are utilised to obtain costs related to the resources in the production system (Eq. 4-8).
KA denotes the cost for tooling, KB denotes the cost for
work piece material, KC1 denotes the cost for the
equipment at service, KC2 denotes the cost for equipment
at down time and KD denotes the cost for personnel.
Q
P
A 0 0 A A q 1 q 1 N N k K (4)
Q
B
B 0 0 B B q 1 q 1 N N k K (5)
Q
P
C1 0 0 0 CP 1 C q 1 q 1 N t N 60 k K (6)
pb C2RP RP su S S P Q 0 0 0 CS 2 C T U U 1 T q 1 q q 1 q 1 N t N 60 k K (7)
pb D RP RP su S Q 0 0 0 D D T U U 1 T q 1 q 1 N t N 60 k K (8)3.4. Objective Functions
Production system development is either continuous or determined (Ståhl, 2008). Continuous development is strategic, i.e. the capacity to concurrently develop and maintain the production system. On the other hand, deterministic development is focused on improvement of specific segments or activities in the system where the key is to identify an objective function for the activities or work stations. This practice demands that the process is measurable so that changes can be directed toward predetermined goals. An objective function can be
formulated based on the production loss rates (Eq. 1-3) and the individual resource costs (Eq. 4-8), for example:
·Reduce the scrap rate (qQ) for the work piece material
(Factor B) without increasing the part cost (KB) for
material. Material change could be a relevant strategy to satisfy this objective, where the new material costs more (kB), but is more robust and yields lower scrap (qQ).
Another example of an objective function can instead be formulated based on the overall resource cost (summation of Eq. 4-8), for example:
·Reduce the down time (qS) in the manufacturing process
(Factor C) without increasing the overall process cost K
(KA + KB + KC1 + KC2 + KD).
·Decreased service intervals could be a relevant strategy in this case, more services costs more (kC1) but results in
more robust processing and less unplanned downtime (qS).
It is important to coordinate improvement measures, to avoid negative interactions between different resources and cumulative production loss rates. The strategy with objective functions means that an initial state is needed for the loss rates, working as reference after investments have been introduced.
3.5. Production System Design Using SPA
To aid in production system improvements, an interpretation of the different entities and their interrelations has been made into a conceptual view illustrated in Fig. 2. Here, the resource costs KA-KD are
connected to each other by the production loss rates qQ, qS,
qP. This means that costs for one resource can be adjusted
by different measures, e.g. interchange and upgrade abilities, which in turn influence the loss rates. However, the changed loss rates also alter the cost for other resources. For example, improve the production system by personnel training ventures (increasing kD), and keep the
other resources (kA, kB or kC) fixed. The training of
personnel reduces production loss rates and leads to cumulative cost reductions for corresponding resources, e.g. more accurate operations yield less scrap.
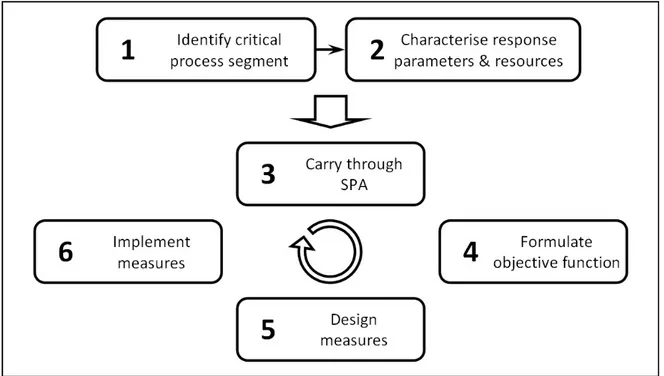
This interpretation of SPA implies independent work on different aspects in production system development, i.e. causes for production loss, response parameters and objective functions. A roadmap (Fig. 3) composed of six steps is suggested to manage production system development. The output for each step is in [brackets]. 1. [Identify criticalprocess segment or work station], e.g. decide on a core product, a value stream, an activity, a machine, etc. that is of interest.
2. Characterise response parameters [∑Qi, ∑Si, ∑Pi] and
resources [∑Ai, ∑Bi, ∑Ci, ∑Di].
The Steps 3 to 6 are intended to be carried out repeatedly until established objective functions in Step 4 are achieved.
3. Carry through SPA (Fig. 1), evaluate response parameters [∑Qi, ∑Si, ∑Pi] and calculate the production
loss rates [qQ, qS, qP].
4. [Formulate objective function] for development of the production system, based on the performed SPA.
5. [Design measures] for improving the production system based on the objective functions.
6. [Implement measures] and design plan for new SPA (go back to step 3).
4. Method - Case Study of Patio Door Manufacturing
The case company is a first-tier supplier to an industrial producer of detached housing. They are aiming to work in a more industrial manner, i.e. moving from project to process orientation. Their product catalogue includes patio doors, front doors and windows. The case company has a 1.2 M€ turnover and 11 employees. Together with company management it was decided to investigate the patio doors. The product and process were characterised through on-site observations and
interviews with company personnel. Using the product and process characterisations, the production system was determined in terms of resources, i.e. the different workstations were defined and characterized. This work was done together with company management, worker interviews and observations.
Application of SPA followed the proposed roadmap (Fig. 3). It was decided together with company management to study the entire process for the patio doors (Step 1). The characterisation of response parameters and resources was made in a workshop together with the company management (Step 2). The characterisation was transferred to SPA work sheets in A3 format, which were positioned at all work stations. The factory workers were then responsible to log causes for scraps and downtimes on one batch of patio doors (Step 3) consisting of a total of 152 patio doors, produced over 17 days. The work sheets were then collected and the results were compiled in a summarising SPA matrix. The analysis resulted in formulation of an objective function, which was done together with the company management (Step 4). Different measures to achieve the objective function and their implementation were then discussed in Step 5 and
Step 6.
4.1. Product Description
The patio door (Fig. 4) production process (Fig. 4) is composed of eight segments/work stations. The patio door (Level 0) is composed of frame and arc (Level 1) that in turn consist of 11 parts (Level 2), quantities given in brackets. Note that, fill materials, i.e. insulation or glass, and threshold are purchased from external suppliers, while the remaining eight parts are manufactured in-house. Fig. 4 also presents the workstation sequences where the patio door parts are processed.
4.2. Process Description
Frame production (Fig. 5) is initiated by pre-cut wood planed at workstation I, the frame sides are then milled for mount assembly and holes are drilled for assembly at
II. After that ocular inspection is carried out at V, inspection for cracks and twigs. If required, they are grinded at IV otherwise the parts are puttied. The following step is base painting and drying at VI. After that they are varnish grinded at IV and top painted at VI. Then mounts are assembled at VII and the frames at VIII. Arc production (Fig. 5) is initiated by pre-cut wood planed at workstation I. Fittings for hinges and locks are milled at II. Then ocular inspections are made at V. If required, they are grinded at IV otherwise the parts are puttied. The arc is nailed together and details are attached through nailing and gluing at III followed by puttying and base painting at V and VI respectively. Then varnish grinding occurs at IV before top painting at VI. Finally mounts are assembled at VII before finalising the arc at VIII, i.e. assembly of fill, glass and laths and attaching the door to the frame.
4.3. Production System Characterisation
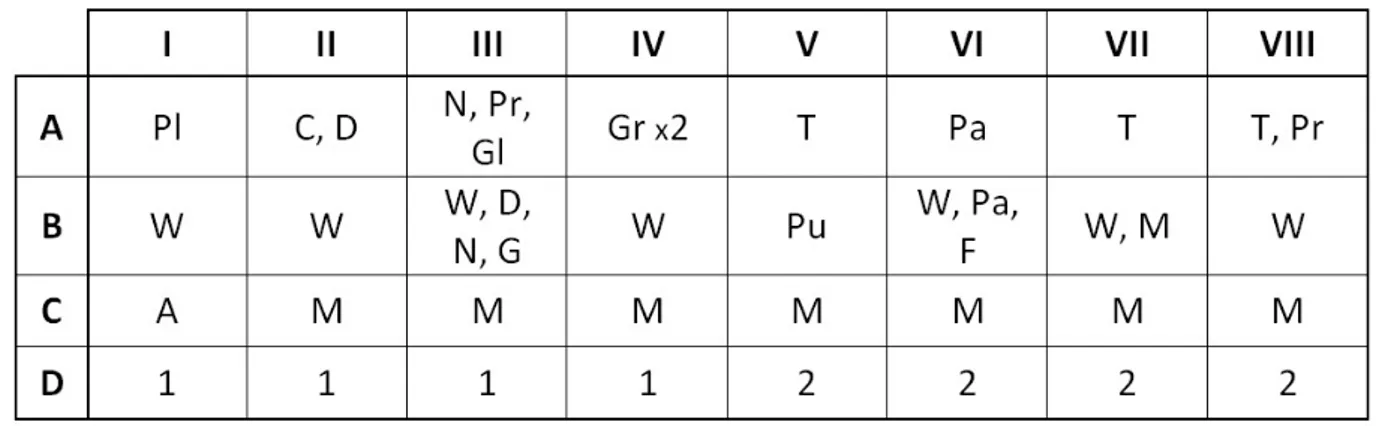
Table 2 illustrates the production system in terms of resource utilisation for each of the eight identified work stations, I-VIII (Fig. 5). The resources (A-D) in the production system are presented and positioned at the different workstations.
A: Tooling: Planer (Pl), Nailer (N), Table cutter (C), Drilling machine (D), Press (Pr), Grinding machine (Gr), Painting device (Pa), Glue pistol (Gl) and Work Tables (T).
B: Work piece material: Pre-cut wood (W), Paint (Pa), Fill (F), Nails (N), Details (D), Glue (G), Mounts (M), and Putty (Pu).
C: Manufacturing process: Automatic (A) or Manual (M).
D: Personnel: 6 employees work in the process as roaming resource. The number, given in Table 2, is the amount of workers required at each workstation.
Fig. 4. The patio door parts and Bill-Of-Material (BOM)
Table 2. Resource utilisation in the production system at the patio door manufacturer
5. Results – SPA Implementation
5.1. Step 1: Identify critical process segment
The first step in the framework is to identify critical segments or work stations in the production process. It was decided to study the value stream for the patio door as this product is a core product. Also, the case company has an immature manufacturing process, based on manual work. Consequently, no previous analysis of the production system has been performed. Therefore, it was decided to study the entire process in order to locate possible problem areas.
5.2. Step 2: Characterise response parameters and resources
The second step, to characterise response parameters and resources, included the entire process. Two scrap parameters, regarding surface (Q1) and dimension errors
(Q2), and two down time parameters, planned (S1) and
unplanned down time (S2) were determined. P-factors
were excluded because the company does not yet work with paced manufacturing (takt time). In total 35 loss factors [resource properties] in resources A to D were identified.
A: Tooling.A1: Blunt tools, A2: Errors on tools, A3: Dirt,
A4: Tools missing.
B: Work piece material. B1: Erroneous moisture
(Hi-Lo), B2: Twigs, B3: Cracks, B4: Dimension error, B5:
Temperature error, B6: Dirt between glasses,
B7: Crooked wood, B8: Ragged surface.
C: Manufacturing process. C1: Erroneous positioning
of work piece, C2: Set-up, C3: Defect dispensers, C4:
First piece check, C5: Dimension check,
C6: Incorrect tool, C7: Disruption due to other work, C8:
Moisture check, C9: Work piece missing, C10: Preset
measures incorrect, C11: Device error, C12: Compressed
air control.
D: Personnel.D1: Breaks, D2: Meetings, D3: Personnel
shortage (leave, etc.), D4: Unfamiliarity, D5:
Unwariness, D6: Matters too difficult, D7: Incorrect read
of drawing, D8: Drawing missing, D9: Looking for
material, D10: Looking for area to put material, D11:
Material blocking path.
5.3. Step 3: Carry through SPA
SPA was carried through on one batch with the size of 152 patio doors during a period of 17 days. The
aggregated SPA matrix from the eight different work stations is presented in Table 3.
The total number of parts was N0=1216 of which 89
parts (Q1+Q2) were scrapped. The total production time
was tp=6231 minutes and the downtime was tS=1501
minutes. The calculated loss rates yielded qQ = 0.068
(Eq. 1) and qS = 0.241 (Eq. 2), indicating that 6.8 % of
processed parts are scrapped and that production stands still 24.1 % of the processing time.
5.4. Step 4: Formulate objective function
The results (Table 3) indicate a large down time (Sn)
derived from the planned set-up (S1) of the planer (C2).
To reduce the down time, continuous work with 5S and introduction of standard protocols for set-up are but two examples of measures. However, the results (Table 3) indicate that the B–resource (work piece material) is the main issue and needs further investigation since all scrap (Qn) originates from here. Thus, a reasonable objective
function for deterministic improvement of the production system is based on the scrap rate (Eq. 1) originating from the work piece material and its total cost (Eq. 5):
Reduce the scrap rate in the B-factor (qQ) without
increasing the total cost of the work piece material (KB).
To employ measures for reaching the objective, a full investigation of the work piece material is required, i.e. what are the reasons for caused scrap. It should be observed that as of this time the case company has not yet designed any production system development measure nor implemented these. Therefore, the last two steps are mere suggestions of how to apply the framework.
5.5. Step 5 & 6: Design & implement measures
The calculation of the total work piece material cost (Eq. 5) indicates that three parameters influence the total work piece cost; the initial cost of the work piece material itself (kB), the scrap rate (qQ) and the material
waste rate (qB). The material waste rate (qB) considers
resistance properties of steel are different compared to those of wood.
For small companies, drastically changing materials is difficult, as their turnover do not permit large investments if Return on Investment (ROI) cannot be achieved in short term. Engineered Wood Products (EWP) could be an intermediate option to reduce scrap rate by minimizing the occurrence of cracks and crooked wood. Introduction of EWP has the potential to reduce the scrap rate (qQ), which will compensate for the
increased initial work piece cost (kB), and thereby
improve the robustness. However, will the scrap reduction be sufficient? This issue requires dedicated pre-evaluation, implementation and follow-up of process effects.
6. Analysis & discussion – SPA Implementation
The analysis investigates the applicability of the proposed model (Fig. 3). Each step in the model is examined from the point-of-view of the case study results.
․Step 1: Identify critical process segment. For this case it was appropriate to consider the entire process as the company did not have any systematic measurements. However, for more mature production systems, the unit of analysis could be narrowed down to single machines or activities. The step is dependent on the overall objective, e.g. decision support in rebuilding production systems or providing an overview of experience and competence required for a specific activity (Ståhl, 2008).
․Step 2: Characterise response parameters and resources. Because of the lack of measurements it was impossible to make any investigation on the takt in the process. The other parameters and factors were important for the company to characterise as they provide an overview of resources and possible problems within the production system. In this step it is important to find a balance in the complexity, meaning a resolution for the resource and parameter definitions so that it is neither too simple so it does not provide any useful
knowledge, nor too complicated so it is difficult to understand for the personnel who will collect the data.
․Step 3: Carry through SPA. The lessons learned from the study were that adequate instructions are needed for the personnel that are actually making the measurement, i.e. customise the work sheets accordingly with precise factors and parameters that is straight-forward to fill out. Also, it is difficult for the personnel to admit to their own mistakes and fill out production losses caused by their own doing. To be able to break this trade specific influence, training and learning persistence is required, which is an integral step in the accomplishment of continuous improvements (Ko et al., 2011).
․Step 4: Formulate objective function. Since the scrap collected, only came from the B-factor it was natural to formulate a function focusing on this problem at hand. Important to underline here is that the function has to be related to the goal of improving the synchronisation to the industrialised house-building supply chain, both upstream and downstream. However, the absence of measurements in the other factor groups might simply indicate a lack of experience of the personnel.
․Step 5 & 6: Design and implement measures. Even though these steps were not performed, the model was capable of providing substantial information to support design of measures to improve the robustness of the production system. The problem with much scrap originating from the B-module motivates an investigation and deterministic development through the assessment of alternative materials. Further, the strategy for reduction of downtime should be achieved through continuous production development. Ståhl (2008) stress the importance of simultaneously maintaining and developing the production system, i.e. continuous and deterministic production development should coincide.
There are certainly other measures (Step 5 & 6) that could be applied to reduce the scrap rate. As the factors are interrelated (Fig. 2), an option is to work with the different factors themselves. For example, purchasing new tools capable of processing higher degrees of faulty wood (A-factor), investing in new machinery for quality control (C-factors) or educating the workers to perform quality checks (D-factors). The proposed measures imply increased costs, but they are also likely to be one-time investments. For example, investing in new knowledge for the personnel, e.g. they can be taught to notice what timber will lead to quality issues and what timber should be discarded and perhaps be used for other products. Such measure would not per se reduce the scrap rate (as all scrap would still be in the process). However, the accompanied down time from scrap would be reduced, in turn lowering the part cost. Further, a more skilled work force would certainly demand higher wages, diminishing the effect of the measure.
7. Conclusion
The aim of this paper was to examine how SPA can be used to provide for a more robust production process in terms of better resource characterisation and predictability. The application of SPA was evaluated and the employment of the roadmap method (Fig. 3) automatically provides an overview of the production system in terms of influencing resource factors and attributing production loss parameters. The results from the SPA (Table 3) showed that the choice of work piece material is the largest cause for occurring scrap that in turn disrupts downstream work. Application of the roadmap model provided many potential measures to improve production system robustness, where the most straight forward solution is the evaluation of a new work piece material. In conclusion, the SPA roadmap model is straightforward and may be a good approach to start performance measurements in young manufacturing organisations, which is the case for many actors in the industrial house-building supply chain as of today.
Compared to many manufacturing enterprises, industrialised house-builders are still immature, especially in quality management, i.e. production performance measurements and monitoring. Meiling and Johnsson (2008) state that experience feedback is not utilised in forthcoming projects and production system designs. According to Milberg and Tommelein (2003), this is not an issue in construction, simply because there are no measurements. Consequently, cause-and-effect analyses seem to be missing from construction processes in general. To gain a more robust production system, there is a need for a reliable measurement framework. Only then will the industrial house-builders be able to measure capability, e.g. cost, quality, delivery and flexibility (Dangayach and Deshmukh, 2001), as is the norm at mature manufacturers.
Acknowledgements
The authors are grateful to the participating case company for the access to data and for the dedication of the personnel who made the study possible. The authors also acknowledge the research centres of TräIN (the Wood Innovation Network) and Lean Wood Engineering, for their financial support.
References
Ajaefobi, J. O. and Weston, R. H. (2009). Application of Enterprise Modelling (EM) principles to improving the performance of a semi-automated production system. Advanced Materials Research, 62-64(2009), 293-302.
Arbulu, R. (2006). Application of Pull and Conwip in Construction Production Systems. Proceedings of the 14th annual conference of the International Group for Lean Construction, Santiago, Chile, 215-226.
Ballard, G., Koskela, L., Howell, G. and Zabelle, T. (2001). Production System Design in Construction.
Proceedings of the 9th annual conference of the International Group for Lean Construction,
Singapore.
Björnfot, A. and Stehn, L. (2007). Value Delivery through Product Offers. Lean Construction Journal, 3(1), 46-70.
Björnfot, A., Bildsten, L., Erikshammar, J., Haller, M. and Simonsson, P. (2011). Lessons Learned from Successful Value Stream Mapping (VSM).
Proceedings of the 19th annual conference of the International Group for Lean Construction, Lima, Peru, 163-173.
Dangayach, G. S. and Deshmukh, S. G. (2001). Manufacturing Strategy: Literature Review and Some Issues. International Journal of Operations and Production Management, 21(7), 884-932. Ekholm, A. and Molnár, M. (2009). ICT Development
Strategies for Industrialisation of the Building Sector. Journal of Information Technology in Construction, 14 (2009), 429-444.
Foss, N. J. (1997). Resources, firms, and strategies: a reader in the resource-based perspective. Oxford, UK.
Höök, M. (2008). Lean Culture in Industrialized Housing - a study of Timber Volume Element Prefabrication. Ph.D. thesis, Luleå University of Technology, Sweden, 67.
Jönsson, M., Andersson, C. and Ståhl, J-E. (2008a). A Generic Economic Model for Manufacturing Cost Simulation. Proceedings of the 41st CIRP
Conference on Manufacturing Systems, Tokyo,
Japan, 33-38.
Jönsson, M., Andersson, C. and Ståhl, J-E. (2008b). Implementation of an Economic Model to Simulate Manufacturing Costs. Proceedings of The 41st CIRP
Conference on Manufacturing Systems, Tokyo,
Japan, 39-44.
Ko, C. H., Wang W. C. and Kuo J. D. (2011). Improving Formwork Engineering Using the Toyota Way. Journal of Engineering, Project, and Production Management, 1(1), 13-27
Koskela, L. (2000). An exploration towards a production theory and its application to construction. Technical Research Center of Finland, VTT Publications 408, Espoo, Finland, 187-188. Lennartsson, M., Björnfot, A. and Stehn, L. (2009).
Production Control through Modularisation. Proceedings of the 17th Annual Conference of the International Group for Lean Construction, Taipei, Taiwan, 453-464.
Development. Lean Construction Journal, 2010(1), 17-29.
Lu, W., Olofsson, T. and Stehn, L. (2011). A lean-agile model of homebuilders' production systems.
Construction Management and Economics, 29(1), 25-35.
Meiling, J. and Johnsson, H. (2008). Feedback in Industrialised Housing; Why Does It Not Happen?.
Proceedings of the 24th ARCOM conference,
Cardiff, Wales, 145-154.
Milberg, C. and Tommelein, I. D. (2003). Application of Tolerance Analysis and Allocation in Work Structuring: Partition Wall Case. Proceedings of the 11th annual conference of the International Group for Lean Construction, Blacksburg, VA, 1.
Schramm, F. K., Silveira, G. L., Paez, H., Mesa, H., Formoso, C. T. and Echeverry, D. (2008). Using Discrete-event Simulation to Support Decision-makers in Production System Design and Operations. Proceedings of the 16th Annual Conference of the International Group for Lean Construction, Manchester, UK, 131-142.
Ståhl, J-E. (2008). Industriella Tillverkningssystem. Division of Production and Materials Engineering, Lund University, Lund, Sweden.
Söderberg, R. (1994). Robust design by tolerance allocation considering quality and manufacturing cost. Proceedings of the 20th Design Automation Conference. ASME 2(1994), 219-226.
Tolio T., Ceglarek, D., El Maraghy, H. A., Fischer, A., Hu, S. J., Laperrière, L., Newman, S. T. and Váncza, J. (2010). SPECIES-Co-evolution of products, processes and production systems. CIRP Annals – Manufacturing Technology, 59(2010), 672-693. Yamamoto, Y. and Bellgran, M. (2010). Fundamental
mindset that drives improvements towards lean production. Assembly Automation, 30(2), 124-130.
Martin Lennartsson got his Master of Science (MSc) degree in Industrial and Management Engineering at Luleå University of Technology in 2004. Martin currently works as PhD Student at the division of Structural and Construction Engineering, Luleå University of Technology, Luleå, Sweden. He is also affiliated to the Lean Wood Engineering (LWE) competence centre. Martin has worked as teacher and lecturer in different courses at Luleå University of Technology (e.g. Structural engineering, Building materials and Building Physics). Martin’s research focus include, but are not limited to, Quality Management, Operations management, Supply Chain Management (SCM) and Modularity, within the construction industry in general and Industrial house-building in particular.
Dr. Anders Björnfot has an MSc in timber engineering from 2001 and took his PhD in Lean Construction of multi-storey timber structures in 2006. Anders is currently working as an Assistant Professor at the Faculty of Technology, Economy and Management, Gjøvik University College, Gjøvik, Norway. Anders
![Table 1. SPA nomenclature N Number of required parts [unit]](https://thumb-eu.123doks.com/thumbv2/123dok_br/18434430.362478/3.892.168.727.358.1153/table-spa-nomenclature-n-number-required-parts-unit.webp)