Evolutionary history of
Phakopsora pachyrhizi
(the Asian soybean rust) in
Brazil based on nucleotide sequences of the internal transcribed spacer
region of the nuclear ribosomal DNA
Maíra C.M. Freire
1, Luiz O. de Oliveira
1, Álvaro M.R. de Almeida
2, Ivan Schuster
3, Maurilio A. Moreira
1,
Merion M. Liebenberg
4and Charlotte M.S. Mienie
41
Instituto de Biotecnologia Aplicada à Agropecuária, Universidade Federal de Viçosa, Viçosa, MG, Brazil.
2
Empresa Brasileira de Pesquisa Agropecuária, Centro Nacional de Pesquisa de Soja, Londrina, PR, Brazil.
3Cooperativa Central de Pesquisa Agrícola,Cascavel, PR, Brazil.
4ARC-Grain Crops Institute, Potchefstroom, South Africa.
Abstract
Phakopsora pachyrhizi has dispersed globally and brought severe economic losses to soybean growers. The fungus has been established in Brazil since 2002 and is found nationwide. To gather information on the temporal and spatial patterns of genetic variation inP. pachyrhizi, we sequenced the nuclear internal transcribed spacer regions (ITS1 and ITS2). Total genomic DNA was extracted using either lyophilized urediniospores or lesions removed from in-fected leaves sampled from 26 soybean fields in Brazil and one field in South Africa. Cloning prior to sequencing was necessary because direct sequencing of PCR amplicons gave partially unreadable electrophoretograms with peak displacements suggestive of multiple sequences with length polymorphism. Sequences were determined from four clones per field. ITS sequences from African or Asian isolates available from the GenBank were included in the anal-yses. Independent sequence alignments of the ITS1 and ITS2 datasets identified 27 and 19 ribotypes, respectively. Molecular phylogeographic analyses revealed that ribotypes of widespread distribution in Brazil displayed character-istics of ancestrality and were shared with Africa and Asia, while ribotypes of rare occurrence in Brazil were indige-nous. The results suggestP. pachyrhizi found in Brazil as originating from multiple, independent long-distance dispersal events.
Key words: Phakopsora pachyrhizi, diversity, internal transcribed spacer, Asian soybean rust, phylogeography. Received: May 20, 2008; Accepted: August 22, 2008.
Introduction
Soybean [Glycine max(L.) Merrill] holds a
promi-nent position in the Brazilian economy because of the di-mension of the cultivated area and the volume of grain production. To achieve the desirable level of productivity, the Brazilian breeding programs have been actively in-volved in the release of new varieties with improved agro-nomic traits, particularly high yielding capabilities. Until some years ago, diseases that imposed important economic losses to Brazilian soybean growers were regarded as of minor importance and were restricted to certain geographic regions and climatic conditions (Almeida et al., 2005).
With the global spread of the Asian soybean rust, caused by the fungusPhakopsora pachyrhizi Sydow & Sydow, the
national soybean production system is facing a new chal-lenge that requires a new set of management skills from the soybean researchers and growers. The challenges are enor-mous since no geographic region or state is free from the
occurrence of the Asian soybean rust and no resistant variety has yet been released to soybean growers.
In addition to the classicalRpp1, Rpp2, Rpp3 and Rpp4 resistance genes (Bromfield and Hartwig, 1980;
Hartwig, 1986), several major resistance genes have been identified in new plant introductions or cultivars (Monteros
et al., 2007; Pierozziet al., 2008; Garciaet al., 2008).
How-ever, even with the availability of these new sources to Bra-zilian breeders, the durability of the disease resistance genes cannot be predicted because of our lack of under-standing about fundamental aspects of the fungus biology, such as the level of genetic diversity present in the Brazilian cropping regions.
The Asian soybean rust pathogen was first identified in 1902 in Japan (Bromfield, 1984). During the following 60 years, the disease was identified in the Philippines, China, Australia and several other countries in Southeast Asia. Later, the disease spread to the African continent and was reported in Zimbabwe (1997) and South Africa (2001). Until the 2000/2001 season, the American continent was free of the Asian soybean rust. However, the fungus was reported in Par-Genetics and Molecular Biology, 31, 4, 920-931 (2008)
Copyright © 2008, Sociedade Brasileira de Genética. Printed in Brazil www.sbg.org.br
Send corresponde to Luiz Orlando de Oliveira. Instituto de Biotec-nologia Aplicada à Agropecuária, Universidade Federal de Viçosa, 36570-000 Viçosa, MG, Brazil. E-mail: [email protected].
aguay (2001) and was established in Brazil and Argentina (2002), Bolivia (2003) as well as the United States (2004) (Schneideret al., 2005). Long-distance dispersal of the spores
is attributed mainly to wind storms (Isardet al., 2005).
WhileP. pachyrhizicauses an infestation that results
in large economic losses to soybean growers, the disease caused by a closely related species naturally found in the Americas,Phakopsora meibomiae(Arthur) Arthur, results
in low or no significant crop losses (Onoet al., 1992). A
PCR-based protocol (Frederick et al., 2002) allowed the
distinction betweenP. pachyrhiziandP. meibomiae
iso-lates. Use of this protocol led to the detection of dual infec-tion in some soybean fields located in southern Brazil (Piugaet al., 2003).
Phylogeography studies have been intensively em-ployed to investigate the genetic diversity of natural popula-tions of both plants and animals. It deals with the principles and processes that govern the geographic distributions of ge-nealogical lineages, especially those within and among closely related species (Avise, 2000). A phylogeographic ap-proach generally aims to understand genetic diversity in con-nection with dispersal history (Avise, 2000). The potential for the use of molecular phylogeography in the investigation of native or introduced species is enormous, mostly because it provides information about genetic diversity not only in the spatial dimension but also in the temporal dimension (Avise, 2000). Molecular phylogeography techniques have been more frequently used in the areas of ecology, conserva-tion genetics and biogeography.
The utilization of molecular phylogeographic approa-ches to uncover patterns of genetic diversity in species of agricultural importance is in its infancy. Recently, this ap-proach was used to reveal patterns of genetic diversity in the plant pathogens Fusarium graminearum (O’Donnell 2000), Alternaria alternata (Peever et al., 2002),
Phaeosphaeria nodorum (Stukenbrock et al., 2006) and
Mycosphaerella graminicola(Bankeet al., 2004).
In the present study, we used a phylogeographic ap-proach through the molecular characterization of the two internal transcribed spacer regions (ITS1 and ITS2) of the 18S-26S ribosomal RNA genes of P. pachyrhizi andP. meibomiaeto address the following questions: (1) What
levels of ITS variation are present inP. pachyrhiziandP. meibomiaein Brazil? (2) Is there any association between
patterns of ITS sequence variation and geographic location of soybean fields in Brazil? (3) What are the genealogical relationships amongP. pachyrhizifound in Brazil and that
of African or Asian origins?
Material and Methods
Sampling strategy
Phakopsora-infected soybean leaves were collected
from 26 soybean fields in Brazil and one field in South Af-rica.
In Brazil, sampling sites were selected such that to-gether they would represent the area in which soybeans were cultivated during the 2005/2006 growing season. In sampling, we had no particular preference for a given soy-bean variety, crop system, soil type or field size. Infected leaves were randomly sampled from several soybean plants throughout the field, pooled together according to the field of origin, bagged and shipped to our laboratory, where uredinospores were harvested using a fine paint brush.
Soybean leaves sampled in many of the fields showed symptoms of a mild infection only. In these cases, the leaves were not brushed; instead, leaf segments containing the lesions were removed with the help of a small pair of scissors. Urediniospores or leaf segments were pooled to-gether according to field of origin, lyophilized and main-tained at -80 °C until further use. Although inoculation of soybean plants under greenhouse conditions with field-derived urediniospores could increase fungal tissue avail-ability for DNA extraction, we choose not to use this proce-dure because the inoculation process might favor some genotypes in detriment of others in case our field samples contained a pool ofPhakopsorastrains.
In South Africa, infected leaves were collected from naturally infected highly susceptible local cultivars on “Ce-dara Agricultural Research Station”, near Pietermaritzburg, during the 2005/2006 growing season. In this case, leaves were sampled four times during the growing season and samples from each stage were pooled and handled sepa-rately. Genomic DNA was extracted at the ARC-Grain Crops Institute, Potchefstroom, following the protocol de-scribed below. After extraction, the genomic DNA was lyophilized and sent to our laboratory in Brazil for further analyses.
DNA extraction
Total genomic DNA was extracted using the CTAB method of Doyle and Doyle (1987), with modifications. Each extraction included 30 mg of lyophilized uredinios-pores or leaf fragments. Crushing was done within a micro-tube in the presence of 600µL of a prewarmed (to 65 °C) CTAB extraction buffer (1.4 M NaCl; 100 mM Tris-HCl, pH 8.0; 20 mM EDTA; 5% CTAB; 2%β-mercaptoetanol). The homogenate was incubated for 15 min at 65 °C in the same buffer. Subsequently, 400 µL of a chloroform/iso-amilic alcohol mixture (24:1) was added and the suspen-sion was centrifuged for 10 min at 13.000 rpm. The DNA was precipitated with equal volume of isopropanol and washed twice with cold 70% ethanol. The DNA was solubi-lized in 30µL TE and stored at -20 °C for subsequent use.
PCR amplification, cloning and sequence editing Preliminary amplifications of the target gene regions were performedviathe polymerase chain reaction (PCR) in
a GeneAmp PCR System 9700 (Applied Biosystems). Ini-tially, the universal primers ITS4 and ITS5 of Whiteet al.
(1990) were used and an amplicon of about 650 bp was ob-tained. ITS4 and ITS5 are primers that target the internal transcribed spacer regions (ITS1, intervenient 5.8S se-quence, and ITS2) of the 18S-26S ribosomal RNA gene cluster. When soybean genomic DNA was used as the sole source of DNA template in control experiments, PCR am-plification with ITS4 and ITS5 also yielded an amplicon of similar length (data not shown). We regarded this soybean amplicon as potentially misleading because soybean genomic DNA was present as a contaminant in the fungal DNA samples. Since elimination of the contaminant DNA was operationally unfeasible, we designed new primers for the specific amplification of the ITS regions of P. pachyrhizi. To design the new primers, alignments of ITS
sequences ofP. pachyrhiziandGlycine maxavailable in the
GenBank (accession numbers: DQ354536 and X02623, re-spectively) were performed. Alignment analyses indicated sequences in theP. pachyrhizi ITS region with very low
homology to correspondent sequences in theGlycine max
ITS regions. These low-homology sequences of the P. pachyrhiziITS region were fed into the software Primer3
(Rozen and Skaletsky, 2000) to design two new primers: ITSPP3 (5’-GTTCAGTGGGTAGTCTCACCTGATT-3’) and ITSPP5 (5’-GCAACGGCACTTTACTGGCTC-3’). PCR with ITSPP3 and ITSPP5 showed no detectable amplicon when the source of the DNA template was
Phakopsora-free soybean leaves, but yielded a single
amplicon of the expected size when our fungal DNA sam-ples were used as a DNA template (data not shown).
The fungal tissue samples yielded a very limited amount of DNA upon extraction. Moreover, the DNA was of poor quality in most of the samples as the source of DNA was field-grown soybean leaves. Consequently, amplifica-tions of the whole ITS region with primers ITSPP5 and ITSPP3 were feasible in few samples only. To circumvent this problem, we choose to amplify the ITS1 and ITS2 re-gions separately using our two new primers and the primers ITS6 and ITS3 of Whiteet al.(1990). PCR with the primer
pairs ITSPP5/ITS6 (aimed at the ITS1 region) or ITS3/ITSPP3 (aimed at the ITS2 region) each consistently gave a single amplicon. PCR with any of the above-men-tioned primer pairs showed no detectable amplicon when the source of the DNA template wasPhakopsora-free
soy-bean leaves (data not shown).
For final PCR amplification, 60 ng of genomic DNA was used in a 25µL final reaction volume. The concentra-tions of the reagents were: 10 mM Tris-HCl (pH 8.3), 50 mM KCl, 0.1% Tween 20, 1.5 mM MgCl2, 0.2 mM for each deoxynucleoside triphosphate (dNTP), 1.25 µL DMSO, 0.5µM for each of the primers, 0.25 U Taq DNA polymerase (Phoneutria). The PCR program was 5 min at 94 °C followed by 35 cycles of 1 min at 94 °C for template denaturation, 1 min at 58 °C for primer annealing, and 1 min at 72 °C for primer extension, plus a final extension step of 5 min at 72 °C. A sample of 5µL of each
amplifica-tion reacamplifica-tion was visualized in a 0.8% agarose gel stained with a 0.2µg/mL ethidium bromide solution, and a single fragment was identified. The PCR product was cloned into pGEM T-Easy vector (Promega), using the manufacture’s recommendations. Samples were loaded in a MegaBace DNA Analysis System 500 (Amersham Biosciences Corp.) for sequence detection.
Direct sequencing of most of the Phakopsora
-spe-cific amplicons gave partially unreadable electrophoreto-grams, with overlapping peaks. The peak displacements were suggestive that sequences differing in length could be present within the amplicons. Cloning of the amplicons prior to sequencing resulted in electrophoretograms free of ambiguities. Four clones from each of the 26 Brazilian fields (a total of 104 clones) and four clones from each of the four growing stages of the South-African field (a total of 16 clones) were sequenced for each ITS region.
The 120 sequences for each of the two ITS regions were imported into Sequencher version 4.8 (Gene Codes Corp.) and editing was accomplished through manual cor-rections. Sequences derived from cloning were easily aligned and adjustments due to the presence of inser-tion/deletions (indels) were required.
Thirteen sequences of the ITS region ofPhakopsora pachyrhizi(GenBank Accessions AF333488 to AF333500)
and two sequences of the ITS region of Phakopsora meibomiae (GenBank Accessions AF333501 and
AF333502) were available at the time this study was under-taken. The sequences had been obtained by Fredericket al.
(2002) from isolates sampled in Africa (Zimbabwe), Asia (Australia, India, Indonesia, the Philippines, Taiwan, and Thailand) and Hawaii. Sampling dates ranged from 1972 to 2000. We included these sequences in our analyses, but ex-cluded the intervening 5.8s RNA gene.
Data analyses
Population structure was estimated by analysis of mo-lecular variance (AMOVA) using Arlequin 3.11 (Excoffier
et al., 2005). The total genetic diversity was partitioned into
components of two hierarchical levels: between soybean fields and among soybean fields. The significance of the genetic differentiation was tested with 1000 permutations, where P denotes the probability of having a more extreme variance component than would have been obtained for the observed values by chance alone. Arlequin 3.01 also esti-mated the gene diversity and nucleotide diversity (Nei, 1987) indexes.
We used the computer program TCS version 1.13 (Clementet al.2000) to obtain an unrooted ribotype
clado-gram that would reveal genealogical relationships among the ITS sequences. This program applies statistical parsi-mony by implementing the networking algorithm devel-oped by Templetonet al.(1992). The program collapses the
original sequences into ribotypes and calculates a distance matrix (number of mutational differences) for all pairwise
comparisons of ribotypes until the probability exceeds 95%. The number of mutational differences just above this cutoff point is the maximum number of mutational connec-tions between pairs of sequences justified by the parsimony criterion (Clementet al., 2000). The program was run
con-sidering indels as a 5thcharacter state and coded such that each indel, regardless of its size, was considered a single state. We estimated two ribotype networks, for ITS1 and ITS2 regions, respectively.
Results
Datasets for ITS1 and ITS2 regions were assembled independently. Each contained 133 sequences from P. pachyrhiziand two sequences fromP. meibomiae. Among
the sequences ofP. pachyrhiziin each dataset, 104 were
ob-tained in Brazil, 16 from South Africa, and 13 from GenBank. Overall, the length of the ITS1 region ranged from 251 to 252 bp, the 5.8S was 153 bp, and the ITS2 re-gion ranged from 229 to 240 bp.
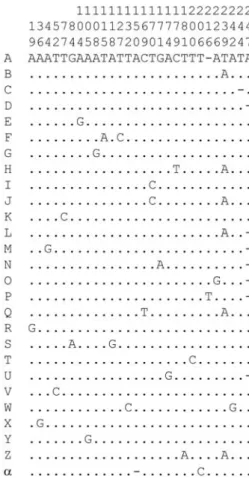
Independent sequence alignments of the ITS1 and ITS2 datasets uncovered 27 and 19 ribotypes, respectively. Twenty four base substitutions and four 1-bp indels distin-guished the 27 ribotypes of the ITS1 region (Figure 1). For the ITS2 region, 17 polymorphic sites (ten base substitu-tions and seven indels) defined the 19 ribotypes. Among the seven indels found in the ITS2 ribotypes, five were 1 bp long, one was 3 bp long, and one was 6 bp long (Figure 2). The sequences have been deposited in GenBank (EU930070 to EU930096 for ITS1 ribotypes and EU930097 to EU930115 for ITS2 ribotypes).
The genealogical relationships among the ribotypes ofP. pachyrhiziandP. meibomiaewere revealed by
assem-bling two ribotype networks, one for each ITS datasets. In each case, species-specific networks were obtained. Con-sistently, one of the networks contained the sequences ofP. meibomiae, while the other network contained the
se-quences ofP. pachyrhizi(Figures 3 and 4). The maximum
number of mutational connections between pairs of se-quences, justified by the ‘parsimony’ criterion with 95% confidence, was estimated as six. The estimation procedure detected many interior nodes (represented by a small circle) to which none of the sequences could be assigned. These nodes represent inferred intermediate ribotypes between two nearest-neighbor ribotypes in the network that differed by two or more mutations (Templeton, 1998). These miss-ing intermediates are either ribotypes that have vanished, or ribotypes with such a low frequency in the population that they were not sampled.
According to the predictions of the coalescent theory (Templetonet al., 1992), ancestral ribotypes
characteristi-cally: (a) are located at the inner part of the network, (b) oc-cur at high frequencies, (c) show a large number of connections to low frequency ribotypes, and additionally (d) are widespread at large geographic areas. In contrast, derived ribotypes are: (a) located in tips of the network, (b)
occur at low frequency, (c) are connected to a ribotype that is located in a central part of the network, and (d) are cir-cumscribed to limited geographic areas, such as a single population or adjacent populations.
For the ITS1 region ofP. pachyrhizi, the most
com-mon ribotypes were ribotypes A and B (Table 1), which oc-cupy the inner parts of the network and are connected to a number of low frequency ribotypes (Figure 3). Moreover, these two ribotypes showed the most widespread geo-graphic distribution among the ITS1 ribotypes (Figure 5) and may have an ancient origin because they were identi-fied in GenBank accessions collected in Australia (1972 and 1979), Hawaii (1995 and 1998), India (1973), Indone-sia (1972), the Philippines (1977), Taiwan (1972 and 1980), Thailand (1976) and Zimbabwe (2000). Ribotypes A and B also showed the most widespread occurrence within the Brazilian territory. Ribotype D also appeared with high frequency (although not as high as that shown by ribotypes A and B) and occupies a central position in the ITS1 network (Figure 3). It was collected from Cedara (South Africa) and from five soybean fields in Brazil (Ta-ble 1 and Figure 5). Ribotypes A, B, and D should, there-fore, be treated as having an ancestral relationship to the
Freireet al. 923
Figure 1- Sequence alignment of the variable sites for the ITS1 region
remaining ribotypes in the network. Additional evidence of the ancestrality of ribotypes A, B, and D emerges when the network configuration data are evaluated with respect to the geographic distribution of their ribotype components (Figure5). Most of the remaining ITS1 ribotypes occurred at very low frequencies, 22 of them being singletons, that is, they were each identified within a single soybean field. Three of these singletons (ribotypesα, T and Z) were ex-clusive to Cedara (South Africa) (Figure 5).
For the ITS2 region ofP. pachyrhizi, the most com-mon ribotypes were ribotypes A’ and B’ (Table 2). Al-though these two ribotypes occupy central positions and are connected to a number of tip ribotypes in the network re-covered for ITS2 region (Figure 4), they were found mostly at Cedara (South Africa) and in Brazil (Figure 6). Ribotype A’ was uncovered from a single GenBank accession (AF333500) collected in Zimbabwe (2000) and ribotype B’ was not present among the GenBank accessions. The ab-sence of ribotypes A’ and B’ from older samples may
indi-924 Phylogeography of the Asian soybean rust in Brazil
Figure 2- Sequence alignment of the variable sites for the ITS2 region de-fining the 19 ribotypes uncovered in 133 cloned sequences ofPhakopsora pachyrhizi. Each fragment spans 241 bases. Dots indicate similarity to ribotype A’ and hyphens indicate gaps. Numbers indicate the nucleotide position having ribotype A’ as a reference sequence during alignment.
Figure 3- Networks obtained with TCS 1.13 forPhakopsora pachyrhizi
(I) andPhakopsora meibomiae(II) using ITS1 ribotypes. Indels were con-sidered as 5thcharacter state and coded such that each one, regardless of its
size, was considered as only one character. Letters inside circles identify the detected ribotype. Each line in the network represents one mutational change, and small, open circles indicate extinct or unsampled ribotypes.
Figure 4- Networks obtained with TCS 1.13 forPhakopsora pachyrhizi
(I) andPhakopsora meibomiae(II) using ITS2 ribotypes. Indels were con-sidered as 5thcharacter state and coded such that each one, regardless of its
Freire
et
al.
925
Table 1- Distribution of the 27 ITS1 ribotypes among 133 cloned sequences ofPhakopsora pachyrhizi. The total number of cloned sequences analyzed per site (#), the total number of ribotypes found in each site
(RSH), and the number of sites that share a given ribotype (RSITE) are indicated. Sites were numbered from 1 to 27 as indicated in parenthesis after the site name.
Sites Ribotypes
# A B C D E F G H I J K L M N O P Q R S T U V W X Y Z a RSITE
Alto Taquari, MT (1) 4 1 1 1 1 4
Campinas, SP (2) 4 1 3 2
Campos de Júlio, MT (3) 4 2 1 1 3
Chapadão do Sul, MS (4) 4 4 1
Cerejeiras, RO (5) 4 3 1 2
Corumbiara, RO (6) 4 2 1 1 3
Cristalina, GO (7) 4 1 2 1 3
Guarda Mor, MG (8) 4 2 1 1 3
Itiquira, MT (9) 4 2 1 1 3
Londrina, PR (10) 4 1 2 1 3
Miguelópolis, SP (11) 4 1 2 1 3
Mineiros, GO (12) 4 3 1 2
Palmas, TO (13) 4 3 1 2
Paulínia, SP(14) 4 2 1 1 3
Piracicaba, SP (15) 4 3 1 2
Pitanga, PR(16) 4 1 1 1 1 4
Rio Paranaíba, MG (17) 4 2 1 1 3
Rio Verde, GO (18) 4 2 1 1 3
Sarandi, RS (19) 4 3 1 2
São Gabriel do Oeste, MS (20) 4 1 3 2
São Gotardo, MG (21) 4 2 1 1 3
Seberi, RS (22) 4 2 2 2
Taquarituba, SP (23) 4 2 2 2
Tupiciguara, MG (24) 4 1 2 1 3
Uberaba, MG (25) 4 1 2 1 3
Vista Alegre, RS (26) 4 2 2 2
Cedara Research Station, SA (27) 16 8 3 2 1 1 1 6
GenBank Accessions 13 11 2
926
Phylogeography
of
the
Asian
soybean
rust
in
Brazil
Table 2- Distribution of the 19 ITS2 ribotypes among 133 cloned sequences ofPhakopsora pachyrhizi. The total number of cloned sequences analyzed per site (#), the total number of ribotypes found in each site (RSH), and the number of sites that share a given ribotype (RSITE) are indicated. Sites were numbered from 1 to 27 as indicated in parenthesis after the site name.
Sites Ribotypes
# A’ B’ C’ D’ E’ F’ G’ H’ I’ J’ K’ L’ M’ N’ O’ P’ Q’ R’ S’ RSITE
Alto Taquari, MT (1) 4 1 1 1 1 4
Campinas, SP (2) 4 2 2 2
Campos de Júlio, MT (3) 4 3 1 2
Cerejeiras, RO (4) 4 2 1 1 3
Chapadão do Sul, MS (5) 4 2 2 2
Corumbiara, RO (6) 4 2 2 2
Cristalina, GO (7) 4 1 3 2
Guarda Mor, MG (8) 4 2 1 1 3
Itiquira, MT (9) 4 4 1
Londrina, PR (10) 4 2 2 2
Miguelópolis, SP (11) 4 3 1 2
Mineiros, GO (12) 4 4 1
Palmas, TO (13) 4 1 1 1 1 4
Paulínia, SP (14) 4 1 3 2
Piracicaba, SP (15) 4 1 2 1 3
Pitanga, PR (16) 4 1 1 1 1 4
Rio Paranaíba, MG (17) 4 3 1 2
Rio Verde, GO (18) 4 4 1
São Gabriel do Oeste, MS (19) 4 3 1 2
São Gotardo, MG (20) 4 2 1 1 3
Tupiciguara, MG (21) 4 1 2 1 3
Taquarituba, SP (22) 4 4 1
Uberaba, MG (23) 4 2 2 2
Seberi, RS (24) 4 3 1 2
Sarandi, RS (25) 4 2 2 2
Vista Alegre, RS (26) 4 3 1 2
Cedara Research Station, SA (27) 16 10 3 1 1 1 5
GenBank Accessions 13 1 7 5
cate that these two ribotypes, although frequently found in Brazil, may be of recent origin. Two ribotypes of rare oc-currence (D’ and E’) showed interesting placements in the network. Among the GenBank accessions, they were those of higher frequencies, appearing seven and five times, re-spectively. Ribotype E’ occupies a tip position and was not found in Brazil, but was identified in samples collected in Asia since 1972. Ribotype D’, which is internally con-nected to E’ was collected from only two Brazilian fields, but was identified in samples collected in Asia between 1972 and 1980, and in Zimbabwe, Africa in 2000. Ribo-types D’ and E’ were both absent from the South African samples. The majority of the remaining ITS2 ribotypes of
P. pachyrhiziwere singletons (Figure 6).
Overall, most of the Brazilian fields exhibited from two to three ribotypes for each ITS region (Tables 1-2 and Figure 5-6). In South Africa, DNA samples from infected leaves that were sampled four times during the growing season gave distinct ribotypes (data not shown). These findings are consistent with the lack of readability of
elec-trophoretograms derived from direct sequencing of PCR products and is an indication thatP. pachyrhizimay possess
variation for the ITS sequences evaluated in this study. Analysis of molecular variance (AMOVA) was per-formed with data sets taken from each ITS region and only included data collected from the Brazilian fields (Table 3). For the ITS1 dataset, results of the AMOVA revealed that 90.77% of the total molecular variance can be attributed to within field variation. A similar result (84.3%) was ob-tained when AMOVA was performed using the ITS2 dataset. These high levels of within field diversity are consistent with the high number of singletons uncovered during sequence analysis. Genetic differences among the Brazilian fields were low. AMOVA revealed that only 9.23% of the variation, for the ITS1 dataset, and 15.7% of the variation, for the ITS2 dataset, can be attributed to dif-ferences among fields. As shown in Tables 2 and 3, the most frequent ribotypes were shared by most of the Brazil-ian fields, which is consistent with differences among fields being low.
Freireet al. 927
Figure 5- Geographic distribution of the 27 ribotypes for the ITS1 region ofPhakopsora pachyrhizi. (I) Distribution of ribotypes found in Africa
and Asia. (II) Distribution of the ribotypes found in Brazil. Numbers on the map correspond to the same population codes given in Table 1. Areas of pie charts represent composite haplotype frequency. Ribotype colors and codes are as in the network shown in Figure 3.
Figure 6- Geographic distribution of the 19 ribotypes for the ITS2 region
928 Phylogeography of the Asian soybean rust in Brazil
Table 3- Summary of the AMOVA based on ITS1 and ITS2 datasets forPhakopsora pachyrhizisampled in 26 soybean fields in Brazil
Source of variation df Sum of squares Variance components % total variance p-value*
ITS1
Among fields 24 21.61 0.0651 9.23 < 0.001
Within fields 75 48.00 0.64 90.77 < 0.001
Total 99 69.61 0.7051
ITS2
Among fields 25 20.32 0.08641 15.7 < 0.001 Within fields 79 36.65 0.46392 84.3 < 0.001
Total 104 56.97 0.55033
*p-values are the probabilities of having a more extreme variance component than would have been obtained for the observed values by chance alone. Probabilities were calculated by 1000 random permutations.
Table 4- Gene diversity* and nucleotide diversity** ofPhakopsora pachyrhiziin 26 soybean fields in Brazil
Site ITS1 ITS2
Gene diversity Nucleotide diversity Gene diversity Nucleotide diversity
Alto Taquari, MT (1) 1.000±0.177 0.011±0.008 1.000±0.177 0.008±0.007
Campinas, SP (2) 0.500±0.265 0.002±0.002 0.667±0.204 0.003±0.003
Campos de Júlio, MT (3) 0.833±0.222 0.007±0.006 0.500±0.265 0.002±0.003
Chapadão do Sul, MS (4) 0.000 0.000 0.667±0.204 0.003±0.003
Cerejeiras, RO (5) 0.500±0.265 0.002±0.002 0.833±0.222 0.004±0.004
Corumbiara, RO (6) 0.833±0.222 0.009±0.007 0.667±0.204 0.003±0.003
Cristalina, GO (7) 0.833±0.222 0.005±0.004 0.500±0.265 0.002±0.003
Guarda Mor, MG (8) 0.833±0.222 0.004±0.004 0.833±0.222 0.005±0.005
Itiquira, MT (9) 0.833±0.222 0.009±0.007 0.000 0.000
Londrina, PR (10) 0.833±0.222 0.008±0.007 0.667±0.204 0.009±0.007
Miguelópolis, SP (11) 0.833±0.222 0.007±0.006 0.667±0.204 0.003±0.003
Mineiros, GO (12) 0.500±0.265 0.008±0.007 0.000 0.000
Palmas, TO (13) 0.500±0.265 0.006±0.005 1.000±0.177 0.010±0.008
Paulínia, SP(14) 0.833±0.222 0.004±0.004 0.500±0.265 0.002±0.003
Piracicaba, SP (15) 0.500±0.265 0.004±0.004 0.833±0.222 0.005±0.005
Pitanga, PR(16) 1.000±0.177 0.010±0.008 1.000±0.177 0.014±0.011
Rio Paranaíba, MG (17) 0.833±0.222 0.005±0.004 0.500±0.265 0.004±0.004
Rio Verde, GO (18) 1.000±0.272 0.008±0.007 0.000 0.000
Sarandi, RS (19) 0.500±0.265 0.002±0.002 0.667±0.204 0.003±0.003
São Gabriel do Oeste, MS (20) 0.500±0.265 0.002±0.002 0.500±0.265 0.002±0.003
São Gotardo, MG (21) 0.833±0.222 0.006±0.005 0.700±0.218 0.005±0.004
Seberi, RS (22) 0.667±0.204 0.003±0.003 0.500±0.265 0.004±0.004
Taquarituba, SP (23) 0.667±0.204 0.003±0.003 0.000 0.000
Tupiciguara, MG (24) 0.833±0.222 0.005±0.004 0.833±0.222 0.007±0.006
Uberaba, MG (25) 0.833±0.222 0.005±0.004 0.667±0.204 0.003±0.003
Vista Alegre, RS (26) 0.667±0.204 0.003±0.003 0.500±0.265 0.002±0.003
Nucleotide diversity and gene diversity are presented in Table 4. Nucleotide diversity estimates the probability that two randomly chosen homologous nucleotides will be different and is equivalent to the level of polymorphism within population (Nei, 1987). Gene diversity is defined as the probability that two randomly chosen ribotypes will be different in the sample, and is used as a measure of the ge-netic variability within a population (Nei and Li, 1979). Gene diversity for ITS1 reached the lowest value (0.0) in Chapadão do Sul (MS). For ITS2, gene diversity reached the lowest value (0.0) in Itiquira (MT), Rio Verde (GO), Mineiros (GO), and Taquarituba (SP). In each of these five fields, only a single ribotype was uncovered, and therefore no diversity was found. On the other hand, gene diversity for ITS1 reached the highest possible value (1.0) in Alto Taquari (MT), Rio Verde (GO), and Pitanga (PR). For ITS2, gene diversity was the highest in Alto Taquari (MG), Palmas (TO), and Pitanga (PR). Each of the four clones se-quenced in each of these fields yielded a distinct ribotype. Two fields with the same number of ribotypes, such as Cerejeiras (RO) and Palmas (TO) with two ribotypes each, did not necessarily yield the same estimate for nucleotide diversity. The reason for different estimates between Cere-jeiras (RO) and Palmas (TO) is that nucleotide diversity takes into consideration the number of mutations that dis-tinguishes each of the ribotypes. In our investigation, nu-cleotide diversity ranged from zero (in those fields where a single ribotype was identified), to 0.014 at Pitanga (PR) (with four ribotypes for ITS2) and 0.011 at Alto Taquari (MT) (with four ribotypes for ITS1).
Discussion
One of the objectives of this investigation was to de-termine the levels of ITS variation inP. pachyrhiziandP. meibomiaepresent in soybean fields of Brazil. A previous
study already had revealed that nucleotide sequence simi-larity among isolates of either P. pachyrhizi or P. meibomiaewere greater than nucleotide sequence
similar-ity between the two species (Fredericket al., 2002) and
ref-erence sequences for comparative purposes were available at the GenBank. Sequence alignments and data analyses re-vealed that each of the 208 sequences of Brazilian origin identified in this study were either identical to, or diverged by a few mutation steps from the sequences ofP. pachyrhizi
deposited in the GenBank. None of the sequences were ei-ther identical to or had any ancestral-descendent relation-ship to the sequences ofP. meibomiae. Species-specific
networks obtained with our datasets confirmed this trend. Despite being a weaker pathogen that does not cause eco-nomic damage to soybeans,P. meibomiaeis endemic to the
Americas and infects a range of host species in addition to soybeans (Onoet al., 1992). Until 2000, this was the only
soybean rust species present in Brazil (Carvalho Jr and Figueiredo, 2000). It was therefore plausible to expect that our sequence analyses might confirm the incidence ofP.
meibomiaein soybean leaves harvested in at least some of
the Brazilian fields. Such double incidence had been de-tected previously (Piugaet al., 2003). However, none of the
sequences we obtained could be attributed toP. meibomiae.
Our results do not allow us to exclude the presence ofP. meibomiaefrom soybean fields in Brazil, but they indicate
that the current incidence of this species may be extremely low compared to the occurrence of the P. pachyrhizi.
Levels of nucleotide diversity in both the ITS regions ofP. pachyrhiziwere low. However, for a species that was first
reported in Brazil in 2002 (Yorinori and Paiva, 2002), and that appears to be maintained asexually (the sexual stage has not yet been reported), the level of intraspecific ITS se-quence variation, as revealed by the number of ribotypes uncovered, was surprisingly high. Although species that are maintained via clonal propagation are expected to dis-play low levels of genetic diversity, there are many in-stances in which strictly asexual plant pathogens possess unusually high levels of genetic diversity, as inPuccinia triticina (Kolmer, 2001; Goyeau et al., 2007). Several
events are invoked to explain such high levels of genetic di-versity in imperfect fungi, including parasexuality and heterokaryosis (Kuhnet al., 1995; Tayloret al., 1999), as
well as high mutation rate (Bentleyet al., 1998; O’Donnell et al., 1999). The occurrence of any of these processes in Phakopsora pachyrhiziis, however, yet to be investigated.
The phylogeographic framework proposed by Tem-pletonet al.(1992) and co-workers allowed us to
investi-gate the association between ITS sequence variation, geo-graphic location of soybean fields in Brazil, and the genealogical relationships among Brazilian, African, and Asian ribotypes. The overall pattern we identified in this in-vestigation is that those ribotypes with the most widespread occurrence in Brazil also displayed characteristics of ances-trality and were shared with Africa in particular, and to a lesser degree with Asia. On the other hand, ribotypes of rare occurrence in Brazil are endemic and were limited to a sin-gle field or to fields in the same vicinity in Brazil.
These findings support an African origin for the pop-ulations ofP. pachyrhizifound in Brazil as ribotypes D, A’
and B’, which occurred in both Africanand Brazilian sam-ples, but not in those of Asian-Australian origin. Likewise, ribotype E’ occurred in Asian, but not in the African or Bra-zilian samples. Ribotype B occurred in the BraBra-zilian and South African samples, and in the Australian sample, but not in any of the Asian samples, indicating that the African and Brazilian samples may be more closely related to the Australian sample. More recent samples from Asia and Australia are needed to confirm these indications.
One possible scenario that may account for the natu-ral introduction of the Asian soybean rust into Brazil would involve a transatlantic dispersal of spores from Africa me-diated by air currents. Atmospheric pathways have been suggested to contribute to long-distance dispersal of rust pathogens (Nagarajan and Singh, 1990), and recently this
possibility has been applied to investigate the origin ofP. pachyrhizifound in the United States (Isardet al., 2005).
Regardless of the mechanism of introduction, a single long-distance dispersal event is not compatible with the pattern of distribution of genetic diversity we uncovered for
P. pachyrhiziin Brazil. Shared ribotypes with Africa that
have distinct patterns of geographic distribution in Brazil are suggestive of multiple, independent introduction events. Considering that the DNA regions being investi-gated are not under selection pressure, it is plausible to ex-pect that early-arriving ribotypes would have originated in Africa/Asia and would display a wider geographic distribu-tion in Brazil. Similarly, ribotypes with an African/Asian origin, but being of rare occurrence in Brazil, would have arrived later. This rationale can be illustrated with the ITS2 ribotypes as an example. Ribotype D’ is expected to repre-sent a recent introduction because it was prerepre-sent in several African and Asian isolates sampled from 1972 to 2000, but was found in only two Brazilian fields. Conversely, ribotypes A’ and B’ were probably introduced earlier since they are of widespread occurrence in Brazil and are shared with Africa.
Acknowledgments
This work was supported by FAPEMIG (grants n. CAG-1484/05 to LOO) and IICA/PROCISUR (grant to AMRA). FAPEMIG provided fellowship to MCMF. The authors thank anonymous reviewers for valuable comments on an earlier version of the manuscript.
References
Almeida AMR, Ferreira LP, Yorinori JT, Henning AA, Godoy CV, Costamilan LM and Meyer, MC (2005) Doenças da soja. In: Kimati L, Amorin JAM, Rezende A, Bergamim Filho LEA and Camargo H (eds) Manual de Fitopatologia, v. 2. Editora Agronômica Ceres Ltda, São Paulo, pp 568-588.
Avise JC (2000) Phylogeography: The History and Formation of Species. Harvard University Press, Cambridge, 447 pp. Banke S, Peschon A and McDonald BA (2004) Phylogenetic
analysis of globally distributed Mycosphaerella graminicolapopulations based on three DNA sequence loci. Fungal Genet Biol 41:226-238.
Bentley S, Pegg KG, Moore NY, Davis RD and Buddenhagen IW (1998) Genetic variation among vegetative compatibility groups ofFusarium oxysporumf.sp. cubenseanalysed by DNA fingerprinting. Phytopathology 88:1283-1293. Bromfield KR (1984) Soybean Rust. Monograph n. 11. APS
Press, Inc., St. Paul, 65 pp.
Bromfield KR and Hartwig EE (1980) Resistance to soybean rust (Phakopsora pachyrhizi) and mode of inheritance. Crop Sci 20:254-255.
Carvalho Jr AA and Figueiredo MB (2000) A verdadeira identi-dade da ferrugem da soja no Brasil. Sum Phytopathol 26:197-200.
Clement M, Posada D and Crandall KA (2000) TCS: A computer program to estimate gene genealogies. Mol Ecol 9:1657-1659.
Doyle JJ and Doyle JL (1987) A rapid DNA isolation procedure for small amounts of fresh leaf tissue. Phytochem Bull 19:11-15.
Excoffier L, Laval LG, and Schneider S (2005) Arlequin v. 3.0: An integrated software package for population genetics data analysis. Evol Bioinform Online 1:47-50.
Frederick RD, Snyder CL, Peterson GL and Morris RB (2002) Polymerase Chain Reaction for the detection and discrimi-nation of the soybean rust pathogensPhakopsora pachyrhizi andP. meibomiae. Phytophatology 92:217-227.
Garcia A, Calvo ES, Kiihl RAS, Harada A, Hiromoto DM and Vieira LGE (2008) Molecular mapping of soybean rust (Phakopsora pachyrhizi) resistance genes: Discovery of a novel locus and alleles. Theor Appl Genet 117:545-53. Goyeau H, Halkett F, Zapater MF, Carlier J and Lannou C (2007)
Clonality and host selection in wheat pathogenic fungus Puccinia triticina. Fungal Genet Biol 44:474-483.
Hartwig EE (1986) Identification of a fourth major gene confer-ring resistance to soybean rust. Crop Sci 26:1135-1136. Isard SA, Gage SH, Comtois P and Russo JM (2005) Principles of
the atmospheric pathway for invasive species applied to soy-bean rust. BioScience 55:851-861.
Kolmer JA (2001) Molecular polymorphism and virulence pheno-types of the wheat leaf rust fungusPuccinia triticinain Can-ada. Can J Bot 79:917-926.
Kuhn DN, Cortes BR, Pinto T and Weaver J (1995) Parasexuality and heterokaryosis inFusarium oxysporumf.sp. cubense. Phytopathology 85:119.
Monteros MJ, Missaoui AM, Phillips DV, Walker DR and Boer-ma HR (2007) Mapping and confirBoer-mation of the ‘Hyuuga’ Red-Brown Lesion Resistance Gene for Asian soybean rust. Crop Sci 47:829-834.
Nagarajan S and Singh DV (1990) Long-distance dispersion of rust pathogens. Annu Rev Phytopathol 28:139-153. Nei M (1987) Molecular Evolutionary Genetics. Columbia
Uni-versity Press, New York, 512 pp.
Nei M and Li WH (1979) Mathematical model for studying ge-netic variation in terms of restriction endonucleases. Proc Natl Acad Sci USA 76:5269-5273.
O’Donnell K, Gherbawy Y, Schweigkofler W, Adler A and Pri-llinger H (1999) Phylogenetic analyses of DNA sequence and RAPD data compared inFusarium oxysporumand re-lated species from maize. J Phytopathol 147:445-452. O’Donnell K, Kistler HC, Tacke BK and Casper HH (2000) Gene
genealogies reveal global phylogeographic structure and re-productive isolation among lineages of Fusarium graminearum, the fungus causing wheat scab. Proc Natl Acad Sci USA 97:7905-7910.
Ono Y, Buritica P and Hennen JF (1992) Delimitation of Phakopsora,PhysopellaandCeroteliumand their species on Leguminosae. Mycol Res 96:825-850.
Peever TL, Ibanez A, Akimitsu K and Timmer LW (2002) World-wide phylogeography of the citrus brown spot pathogen, Alternaria alternata. Phytopathology 92:794-802.
Pierozzi PEB, Ribeiro AS, Moreira JUV, Laperuta LDC, Rachid BF, Lima WF, Arias CAA, Oliveira MF and Toledo JFF (2008) New soybean (Glycine max Fabales, Fabaceae) sources of qualitative genetic resistance to Asian soybean
rust caused by Phakopsora pachyrhizi (Uredinales, Pha-kopsoraceae). Genet Mol Biol 31:505-511.
Piuga FF, Almeida AMR, Godoy CV, Costamilan LM, Oliveira ACB, Guerzoni RA, Nunes J and Morel W (2003) Dupla infec-ção dePhakopsora pachyrhizieP. meibomiaeem lavouras de soja, no Brasil. In: Resumos da XXV Reunião de Pesquisa de Soja da Região Central do Brasil, Uberaba, pp 166-167.
Rozen S and Skaletsky HJ (2000) Primer3 on the WWW for gen-eral users and for biologist programmers. In: Krawetz S and Misener S (eds) Bioinformatics Methods and Protocols: Methods in Molecular Biology.Humana Press, New York, pp 365-386.
Schneider RW, Holier CA, Whitam HK, Palm ME, Mckemy JM, Hernandez JR, Levy L and Devries-Paterson R (2005) First report of soybean rust caused byPhakopsora pachyrhiziin Continental United States. Plant Dis 89:774.
Stukenbrock EH, Banke S and McDonald BA (2006) Global mi-gration patterns in the fungal wheat pathogen Phaeosphaeria nodorum. Mol Ecol 15:2895-2904.
Taylor JW, Jacobson DJ and Fisher MC (1999) The evolution of asexual fungi: Reproduction, speciation, and classification. Annu Rev Phytopathol 37:197-246.
Templeton AR (1998) Nested clade analysis of phylogeographic data: Testing hypotheses about gene flow and population history. Mol Ecol 7:381-397.
Templeton AR, Crandall KA and Sing CF (1992) A cladistic anal-ysis of phenotypic associations with haplotypes inferred from restriction endonuclease mapping and DNA sequence. III. Cladogram estimation. Genetics 132:619-633.
White TJ, Bruns T, Lee S and Taylor J (1990) Amplification and direct sequencing of fungal ribosomal RNA genes for phylogenetics. In: Innis MA, Gelfand DH, Sninsky JJ and White TJ (eds) PCR Protocols: A Guide to Methods and Ap-plications. Academic Press, London, pp 315-322.
Yorinori JT and Paiva WM (2002) Ferrugem da soja:Phakopsora pachyrhiziSydow. Embrapa Soja, Londrina, 6 pp.
Associate Editor: Márcio de Castro Silva Filho
License information: This is an open-access article distributed under the terms of the Creative Commons Attribution License, which permits unrestricted use, distribution, and reproduction in any medium, provided the original work is properly cited.