i NOVA Information Management School
Instituto Superior de Estatística e Gestão de Informação Universidade Nova de Lisboa
DEVELOPING THE FINANCIAL BALANCE SHEET AND ACCUMULATION
ACCOUNT MODEL FOR SOUTH AFRICA
IMPLEMENTING RECOMMENDATION 8 OF THE G20 DGI-2
by
Barend Christoffel de Beer
Project work report presented as partial requirement for obtaining the Master’s degree in Statistics and Information Management
Advisor: Filipa Lima, Ph.D.
Co Advisor: Fábio de Albuquerque, Ph.D.
ii
DEDICATION
Firstly, I dedicate this thesis to my wife, Lisa, who has supported and encouraged me to find my true passion in macroeconomic statistics and delve ever deeper into the unknown. Throughout this project she was and still is my true inspiration – the one who has actively supported me and encouraged me to realize my full potential. Thank you for the practical and emotional support you have given me whilst I had to deal with the challenging demands of work and study. I am tremendously appreciative as we mutually engaged on this journey together and at times had to make sense of the various challenges we faced and also provide encouragement to each other at times when it seemed difficult to continue. You are my soul mate and comrade.
Secondly, to my two sons, Elmo and Alex, thanks for your unwavering support and dedication in supporting me throughout this endeavor over the past few years. You fill my life with joy and as a farther inspire me to try to do my best every day.
iii
ACKNOWLEDGEMENTS
I would like to extend my utmost thankfulness and gratitude to my supervisor Filipa Lima and my co-supervisor Fábio de Albuquerque for their invaluable assistance, advice and encouragement. It has been a privilege to receive their excellent advice and precious time given their busy schedules and responsibilities.
iv
ABSTRACT
The recent global financial crisis highlighted the significant degree of interconnection and integration of economies and identified several gaps in the existing suite of national and international financial statistics. From this realisation emerged the G20 Data Gaps Initiative (G20DGI) - a set of 20 recommendations on the enhancement of economic and financial statistics. These recommendations were developed in two phases – the first being G20DGI-1 and the second G20DGI-2, with the second set building on and replacing the first set. Recommendation 8 of G20DGI-2 identifies the development of the Balance Sheet Approach (BSA) for integrated sector accounts. In South Africa’s case, no integrated financial balance sheet and accumulation accounts (FBSAA) exist. This study presents a proposition to a complete model for the construction of the South African FBSAA model within a positivist paradigm making use of quantitative research utilising computation techniques. This is done being mindful of international requirements and guidelines pertaining to data sourcing and output, whilst also being cognisant of the South African specificities relating to time, resource and knowledge constraints. One of the main benefits of the FBSAA model is its ability to provide a holistic view of the financial dimension of the different sectors in a national economy as well as their international linkages. In addition, it also provides the basis to analyze risks and vulnerabilities in financial systems in an integrated manner.
KEYWORDS
v
INDEX
1. Introduction ... 1
2. Problem identification... 3
3. Study relevance ... 4
4. Objectives ... 6
5. Literature review ... 7
6. Methodology ... 10
6.1 Methodological approach ... 10
6.2 Data sources and characteristics ... 10
7. FBSAA model set-up ... 11
7.1 Project phases ... 11
7.2 Monitoring, control and communication... 12
7.3 The FBSAA model parameters ... 15
7.4 The FBSAA model components ... 21
7.4.1 The building block component ... 21
7.4.2 The valuation component ... 29
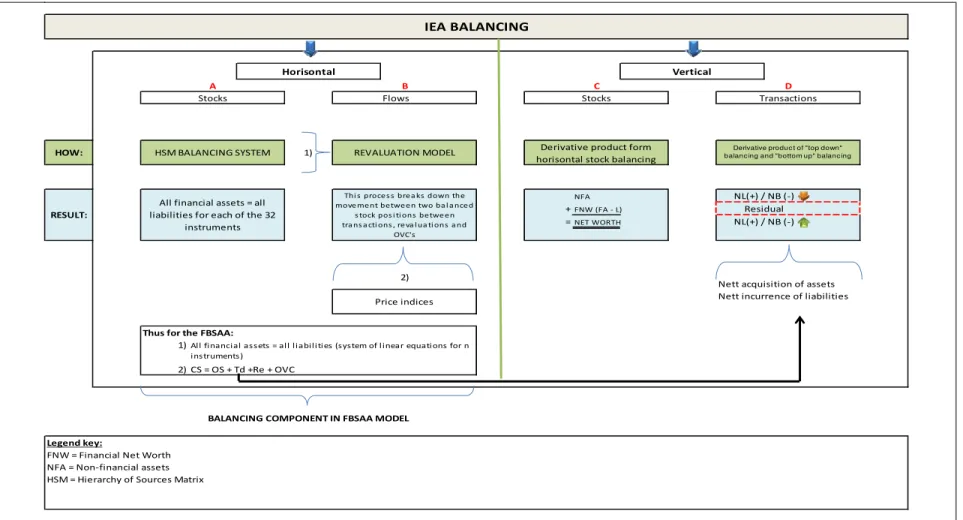
7.4.3 The balancing component ... 32
7.4.4 The output and dissemination component ... 37
8. Result analysis ... 42
9. Limitations and recommendations for future work ... 47
10.Final remarks ... 50
11.Bibliography ... 52
12.Appendix ... 55
12.1 Summary template for DTC sector FALT: opening stocks ... 55
vi
LIST OF FIGURES
Figure 7.1 - Components of the FBSAA model ... 14
Figure 7.2 - FBSAA management framework ... 14
Figure 7.3 - FLFA process within the building block component ... 25
Figure 7.4 - Diagrammatic illustration of the revaluation component ... 30
Figure 7.5 - Diagrammatic illustration of the balancing components ... 34
Figure 7.6 - Balancing prototype for the FBSAA model ... 36
Figure 8.1 - Total financial assets per institutional sector ... 42
Figure 8.2 - Total financial assets per instrument ... 42
Figure 8.3 - Total liabilities per institutional sector ... 43
Figure 8.4 - Total financial assets/liabilities per sector, 31 Dec. 2011 ... 44
vii
LIST OF TABLES
Table 7.1 - Sector delineation of the FBSAA model ... 16
Table 7.2 - Detailed instrument breakdown contained in the FBSAA model ... 19
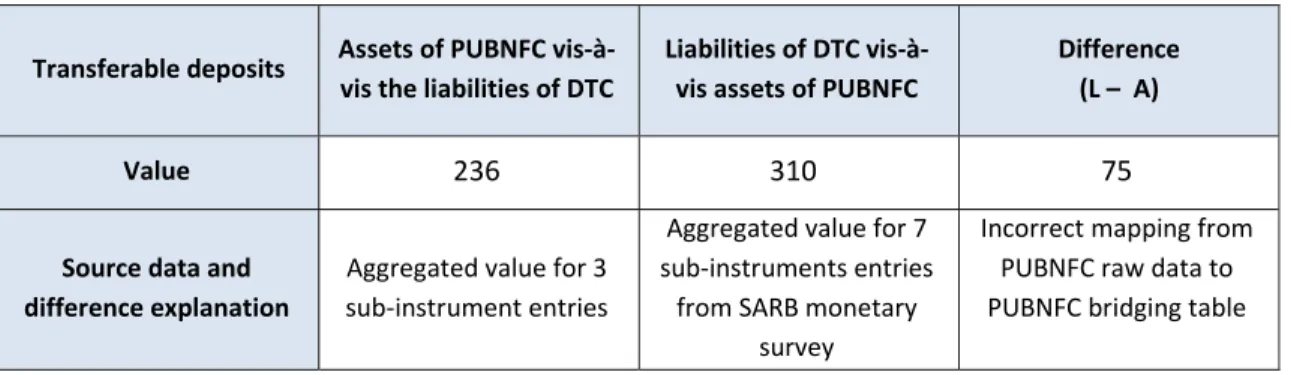
Table 7.3 - CALAN : PUBNFC assets versus DTC liabilities ... 29
Table 7.4 - Price indices used for revaluation estimation ... 31
Table 8.1 - Financial asset and liability positions per institutional sector ... 45
viii
LIST OF ABBREVIATIONS AND ACRONYMS
BFALT Balanced Financial Asset and Liability Template BOP Balance of Payments
BSA Balance Sheet Approach
CALAN Counterparty Asset Liability Analysis
CAPFIN Captive Financial Institutions and Money Lenders CBSD Central Balance Sheet Database
CB Central Bank
CPD Corporation for Public Deposits
CPGOV Central and Provincial Government (sector)
CS Closing Stock
DTC Deposit Taking Corporations (sector) EBI Extra Budgetary Institution (sector)
ERSD Economic Research and Statistics Department
ESA2010 European System of National and Regional Accounts 2010 FA Financial Auxiliaries (sector)
FALT Financial Asset and Liability Template
FBSAA Financial Balance Sheet and Accumulation Accounts FC Financial Corporations (sector)
FCeICPF Financial Corporations except Insurance Corporations and Pension Funds (sector) FINCO Financial Companies (sector)
FLFA First Level Financial Asset and Liability Analysis FSB Financial Stability Board
FWTW From-Whom-To-Whom
ix G20DGI-2 Group of Twenty Data Gap Initiative Phase two
GDP Gross Domestic Product GG General Government (sector) HH Household (sector)
HSM Hierarchy of Sources Matrix IMF International Monetary Fund IC Insurance Corporations (sector)
ICPF Insurance Corporations and Pension Funds (sector) IEA Integrated Economic Accounts
ISIC International Standard Industrial Classification JSE Johannesburg Stock Exchange
LBS Locational Banking Statistics LG Local Government (sector)
MA Monetary Authority (sector)
MFI Monetary Financial Institutions (sector) MMF Money Market Fund (sector)
NFC Non-financial Corporations (sector) NFW Net Financial Worth
NG National Government (sector)
NMMFIF Non-Money Market Fund Investment Funds (sector) NPISH Non-Profit Institutions Serving Households
OFI Other Financial Intermediaries (sector) OMFI Other Monetary Financial Institutions (sector)
OS Opening Stock
OSC Operational Steering Committee OVC Other Volume Change
x PF Pension Funds (sector)
PG Provincial Government (sector) PIC Public Investment Corporation
PUBFIN Public Financial Intermediaries (sector) PUBNFC Public Non-financial Corporations (sector) PRIVNFC Private Non-financial Corporations (sector) PUBPEN Public Pension Fund (sector)
PRIVPEN Private Pension Fund (sector) ROW Rest of the World
NSF National Statistical Framework SDR Special Drawing Right SNA System of National Accounts SNA2008 System of National Accounts 2008 SSA Summary Statistics Analysis SSF Social Security Fund
Steerco Strategic Steering Committee
UN United Nations
UT Unit Trust (sector)
VC Valuation Change
1
1.
INTRODUCTION
1The level of interconnection and integration of different national economies and financial markets were highlighted by the pervasive effects of the global financial crisis that emerged in 2008. This became evident from the depth of the crisis as well as the speed with which international financial contagion spread in its wake. The crisis came largely as a surprise to many policymakers, multilateral agencies, investors and academics (Verick and Ismal, 2010). Although significant bodies of economic and financial statistics existed before the crisis, there were areas poorly covered by existing datasets. Due to the nature of and manner in which the financial crisis spread it became clear that the problem manifested not so much in the quality of existing statistics, but in the gaps that existed in certain crucial areas. “What now became crystal clear was that the global financial crisis created new demands for macroeconomic statistics” (Bamanga, 2010, p. 1). In addition, the scant availability and comparability of longitudinal data across countries compounded the problem.
One specific area of concern which emerged from the financial crisis related to the interconnectedness of economies due to strong globalisation and specifically global financialisation of national economies over the past two decades. This interconnectedness formed the global financial fault lines along which the crisis spread (IMF, 2010). These economies had positions with each other which created a possible link of contagion to their respective domestic economies depending on their national sector balance sheet structure and exposures. This was further exacerbated by the existence of complex instruments and off-balance sheet items which created serious financial stability risks (Dimsdale, 2009). The fact that data on the network of domestic and international positions were scarce or non-existent contributed significantly to the inherent risks. The set of integrated economic accounts contained in the European System of National and Regional Accounts (ESA2010) as well as the System of National Accounts (SNA2008) provide ample scope and guidance for the creation of a set of integrated and harmonised stock and accumulation accounts for an economy that could partially address some of the identified data gaps. Although the underlying statistical guidelines existed prior to the crisis there had not been sufficient focus on the following components:
Measuring the full dimension from opening stock position, through accumulation variables to closing stock position;
Measuring these variables for all the sectors of an economy;
Measuring and understanding the financial dynamics of specifically non-bank financial sectors;
Understanding the impact of credit and counterparty solvency, and
Understanding the impact of public debt in periods of stress.
Flowing from this realisation, the Group of 202 (G20) advanced and large emerging market economies identified the need for comprehensive and timely economic and financial data and called
1
The views expressed in this work project are that of the author and does not necessarily reflect that of the South African Reserve Bank
2
2 on various international agencies “to explore gaps and provide appropriate proposals for strengthening data collection” (FSB, 2009, p.9). This resulted in the identification of the following four different but related data gap areas which required urgent attention:
Identification of risk build-up in the financial sector;
Identification of cross-border financial linkages;
Determination of the extent of vulnerability to shocks (endogenous or exogenous) of domestic economies; and
Improvement of the dissemination and communication process concerning official statistics.
3
2.
PROBLEM IDENTIFICATION
Recommendation 8 of the G20DGI-2 specifically focuses on financial and economic sector datasets and identifies the development of a strategy to promote the compilation and dissemination of the balance sheet approach, flow of funds, and sector data more generally and as a matter of priority (IMF, 2009). South Africa’s membership of the G20 compels it to adhere to and implement the recommendations identified in the G20DGI-2. However, in South Africa’s case, a complete and integrated set of sector balance sheets and accumulation accounts covering the main institutional sectors and instrument categories as proposed in ESA2010 and SNA2008 for financial assets and liabilities does not exist.
This problem is compounded due to the fact that the level of data availability varies among sectors, with the financial corporations (FC) sector well covered but sectors such as the Private Non-financial Corporations (PRIVNFC) and households (HH) least covered - with no directly sourced data and significant reliance upon derived and administrative data. This highlights a significant data gap in South Africa’s macroeconomic financial statistics given the fact that comprehensive FBSAA datasets already exist in many countries, amongst others, Austria, Belgium, Brazil, Chile, Czech Republic, France, Germany, Indonesia, Italy, the Netherlands, Poland, Portugal, the Russian Federation, Slovakia, Spain, Turkey, United States of America, United Kingdom, etc.
Thus, the main identified problem is that there is currently no comprehensive model that provides for the sourcing, balancing, output and dissemination of the South African FBSAA. This poses a significant gap in South Africa’s suite of financial statistics because reliable data on the assets and liabilities of sectors’ as well as countries’ aggregate balance sheets is essential for making the balance sheet approach operational (Allen, Rosenberg, Keller, Setser, & Roubini, 2002). Furthermore, it is critically important to construct a sound and robust FBSAA model that will link the “real” economy with the financial economy in one harmonized set of Integrated Economic Accounts (IEA’s). Shestra, Fassler and Mink (2012) argue strongly that the relationship between economic flows in the real and the financial spheres of the economy as well as the debtor/creditor relationships should be captured and presented using an integrated statistical framework that ensures the consistency of the data between non-financial and financial transactions and between institutional units.
4
3.
STUDY RELEVANCE
From the South African perspective, there are various reasons why the development of a comprehensive FBSAA model for the South African economy is desirable.
The well-developed and pervasive characteristic of the financial sphere of the South African economy necessitates a good understanding of the financial structure underlying the real economic activities. Furthermore, institutional units across all sectors of the economy are significant contributors to the liquidity dynamics of the South African economy and generate significant revenue through their operational activities and depending on their cost and capital structure lead to significant sector net lending/borrowing positions (SARB, 2015). These positions and the flows between periods result in sizeable financial movements throughout the full spectrum of financial instruments as delineated in SNA2008 and ESA2010. In addition, claims on debtors and cash management related to operations and short-term liquidity management can potentially form sizeable positions. The capital structuring activities by institutional units across all sectors could represent a liquidity increase or decrease on the economy in a specific period with a reversal of this in the following period or vice versa.
Due to these dynamics and their impact on the national net lending/borrowing position of the economy it is critical to understand the interlinkages and their impact. Therefore, a comprehensive and thorough FBSAA model containing granular data on the underlying financial instruments would hugely benefit the South African Reserve Bank (SARB) and country at large and would in fact constitute a national statistical asset. This would also directly benefit the IEA compilation for the South African economy by providing the financial net lending/borrowing position per sector which could be related to the net lending/borrowing position calculated from the current and capital account. Such a set of IEA’s for South Africa would provide invaluable insight into the distribution of domestic savings in the economy and also cast light on the diffusion of international capital throughout the domestic economy – thereby providing elucidation into one of the key structural components of the South African economy.
The fact that there has been intense focus on financial and real sector interrelatedness since the financial crisis necessitated the development of a structure to facilitate, compile and house this information without delay. This is, in part, due to the fact that the contribution of the different sectors to economic growth as well as economic crisis can only be thoroughly comprehended if the dynamics driving the sub-components and variables within that sector are tracked and analyzed over time. Gonçalves (2011, p.1) points out that in the Portuguese case “This setting emphasizes the critical need for having detailed data on institutional sectors in order to assess their financial soundness and how they are affected by the adverse economic situations.”
The following is deemed to be the main benefits of developing the FBSAA model for South Africa:
Complete balance sheet (financial assets and liabilities) and accumulation accounts for all institutional sectors of the economy as well as the evolution in these components over time;
5
This information could focus attention on policies that can reduce sector vulnerabilities, especially vulnerability related to changes in key financial variables;
It could assist policymakers in the evaluation of the trade-offs among different policy objectives available after the identification/emergence of sector-specific problems;
At an organizational level, the successful implementation of the FBSAA model will contribute towards the strategic objectives of the Economic Research and Statistics Department (ERSD) of the SARB, which houses the mandate to operationalize recommendation 8 of the G20DGI-2, and thereby congruently address the strategic objectives of the SARB, namely to:
Develop the FBSAA model within the larger IEA model for the South African economy; and
Contribute to the development of a methodology to delineate accumulation account data through the identification of valuation and other volume changes in financial instruments for the different sectors of the South African economy and thereby isolate pure transaction data and reducing data noise.
The project further provides an opportunity to harmonize intra-departmental methodology and quality with other related statistics by integrating all sectors of the economy within one system that could benefit cross-pollination and source data harmonization efforts; and
6
4.
OBJECTIVES
The ultimate goal of this project is to deliver an operational blueprint for the South African FBSAA model. The different components of the FBSAA model will provide a detailed plan on how to source, integrate and disseminate the relevant financial balance sheet and accumulation account data for all the different sectors of the South African economy. In order to achieve this goal, the following intermediary objectives have been identified:
1. Develop a management structure for the FBSAA project;
2. Define the appropriate sector and financial instrument delineation based on international guidelines and requirements;
3. Develop the appropriate FBSAA data sourcing templates with which to source the required data; 4. Develop the validation model with which to estimate revaluation data and derive transactions; 5. Develop the appropriate “raw” data integration model with which to balance the input data in
order to achieve harmonized FBSAA statistics for the South African economy; and
7
5.
LITERATURE REVIEW
It is difficult to identify literature that specifically addresses the existence of FBSAA data gaps. This is probably due to the fact that many central banks that are entrusted with the compilation of FBSAA data sets do so within the context of internal research projects and the literature set generated from this process is not necessarily made available in the public research domain. In addition, literature that address FBSAA data generating processes and dynamics is generally more readily available for developed than developing economies.
The available literature that addresses the FBSAA model specifications can broadly be divided into three categories, namely:
Firstly, literature by international organizations in the form of guidelines, recommendations and position papers that identify, analyze and comment on the impact of these data gaps and provide guidelines for closing them within the context of the overarching FBSAA construct;
Secondly, literature on in-house FBSAA model specifications of specific central banks, mainly relating to European countries that deal with the scope and usefulness of financial accounts and related statistics;
Finally, the third strand of literature relates to individual research - often by national central bank staff under the auspices of national central banks - that have been done on the structure and dynamics of the their in-house FBSAA models as well as the statistics generated by them. The main body of literature that addresses the data gaps identified after the financial crisis of 2008 does so within the context of the overarching G20DGI. Since 2009 the Financial Stability Board (FSB) has produced yearly reports on the progress by G20 member countries on efforts towards closing the 20 identified data gaps. This strand of literature and the information it provides to countries about their peer-country progress is central to the motivation and design of the FBSAA model for South Africa because it provides the frame and international context within which it should be developed. The initial report (FSB, 2009, p.4) to the G20 finance ministers and central bank governors highlighted the financial crisis and data gaps as “an inevitable consequence of the ongoing development of markets and institutions”. The key focus of this research emphasizes the fact that a lack of timely and accurate information hinders the ability of policy makers and market participants to develop effective responses. The fifth progress report, released in September 2014, indicated that significant progress has been made in the implementation of the G20DGI recommendations since 2009. It however stated that although most of the conceptual work had been completed, the enhancements of datasets by all economies took place at diverse rates of progress, primarily reflecting varying levels of sophistication of national statistical systems and data sourcing structures (FSB, 2014).
8 statutory obligations to various regulatory agencies in Portugal and that this development is the result of close cooperation among the public entities with the aim of reducing respondent reporting burden.
The second strand of literature focuses on the efforts of national FBSAA compilers. The Bank of England (2016) highlights the importance of harmonious and uniform classification schemes for the compilation of national accounts. In a similar vein the United Nations (2015) highlights the potential problems in identifying and classifying holding companies and head offices. Publications on methodological notes by the Central Bank of Russia (2015) shows that the financial accounts and financial balance sheets are also a source of data for analyzing the activities of institutional sectors for which detailed information is missing, for example, the non-financial corporations (NFC) and HH sectors.
Wen (2011) identifies the main challenges for Chinese accumulation account data as (a) time lags (b) sector classifications (c) financial instrument innovations, and (d) different supervisory and accounting standards. Kobayakawa and Okuma (2012) postulate that while the Japanese sector account data is comprehensive, it does not appear to be “user-friendly” for primary statistics users due to the complexity of its matrix structure. The authors furthermore state that against this background the Bank of Japan has enacted several measures to improve the usefulness of the Japanese data with the aim of expanding the understandability of the statistics as well as the range of users.
The third strand of literature relates to individual research, mostly by staff of international organizations, central banks and statistical authorities. Their research output primarily focuses on the existing data gaps within the FBSAA as well as the uneven development of these data sets across different countries. Shestra et al. (2011) describe the importance of using an integrated approach for the compilation of financial flows and positions on a “from-whom-to-whom” (FWTW) basis - one of the main components of recommendation 8 of the G20DGI-2. The development of the South African FBSAA model will use this approach as its anchor to contextualize the model and hence informing its design.
The authors furthermore stress that the application of this kind of analysis has been hampered by the lack of adequate data and although different countries have recently improved the development of statistical methodologies and data availability, a fully integrated approach for financial flows and positions within the macroeconomic statistics framework is yet to be achieved. The primary obstacle for achieving this is limited sets of FWTW data. Tissot (2014) emphasizes that several steps have been taken in recent years to refine aspects of national financial accounts with the ultimate aim of constructing integrated sector financial accounts which could play a pivotal role in supporting financial stability analyses. The author however also cautions that its development is presenting acute data challenges and furthermore asserts that additional progress can be achieved by drawing on the ‘micro data revolution’ which currently is receiving significant attention globally.
9 cannot be assured without a macro-prudential approach. In light of this assertion the author highlights the fact that that various datasets emerging from the G20DGI recommendations support the intersection of analysis between the macro-prudential, macroeconomic, and micro-prudential and so are relevant to policy makers in these fields – one of them specifically relating to the enhanced focus on sector balance sheets.
Haim and Levy (2007) focuses on the use of balance sheet data as an important instrument in surveillance of financial stability, the formulation of other similar frameworks for analyzing financial risks, and the provision of more detailed data in the national balance sheet that would enable a deeper analysis of overall economic risks and the risks in the major sectors. In research conducted by Davies (2009) the focus turns to the identification and measurement of current omissions from balance sheets including activities from the shadow banking system such as hedge funds, structured investment vehicles and private equity. This is done with the aim of improving transparency and making it easier to analyze the transmission of financial crisis to institutional sectors and to better monitor future developments. Similarly, Rucher and Wolff (2011) emphasize analysis of vulnerabilities by stating that many recent studies have analyzed the sovereign debt as well as the financial health of Deposit Taking Corporations (DTC’s) while the balance sheets of NFC’s have been subject to less scrutiny.
Silva and Toledo (2015) expand on the magnitude and composition of agent’s leverage and asset holdings as an important indicator for financial stability monitoring, and thus asserts that financial sector accounts have an important role to play in this regard. However, to complement gross and net measures in the sector financial accounts, timely information on FWTW holdings would improve the quality of assessments for financial stability. Rodano and Signorini (2008) emphasize future development work that can be done on the inclusion of micro enterprises in the financial sector accounts of Italy, highlighting that the nature of these small enterprises makes their measurement very difficult but necessary due to the relatively large contribution they make to employment in the NFC sector.
10
6.
METHODOLOGY
6.1
M
ETHODOLOGICAL APPROACHThe positivist paradigm will be the overarching methodological construct within which this study will be conducted. Within this paradigm, the study will make use of a quantitative research approach which emphasises the systematic empirical investigation of social phenomena using computation techniques – both mathematical and statistical. Quantitative methods generally allow for the study of large datasets through which certain patterns and/or behaviours can be identified. This approach is also specifically appropriate when the identified subject of interest can be measured and quantified, as is the case with economic statistics. This study will furthermore avail of longitudinal data obtained from primary data sources as well secondary data sources such as public sector administrative databases. Within the above-mentioned context, the development of the FBSAA model for the sectors and financial instruments of interest will primarily be project based with research and thereafter system development being conducted on divergent but related areas.
6.2
D
ATA SOURCES AND CHARACTERISTICSWithin the FBSAA model, the FBSAA data sourcing template used in the project has as its underlying foundation the IMF template on minimum and encouraged data cells to be reported on by member countries. The FBSAA template was adjusted to take cognisance of the South African national requirements with regard to both sector and instrument delineation.
The data was sourced from five statistics divisions within the ERSD, and forms part of the suite of macroeconomic statistics produced by the SARB. The datasets are compiled using various census and sample survey methodologies, depending on the target population and whether full enumeration is sought. These data sets are considered to be raw datasets from the FBSAA model perspective because they have been compiled with the initial macroeconomic statistical dimension in mind. The raw data sets generate data on a varied number of financial sub-instruments and sectors. These divergent sub-instruments are then aggregated into 32 sub-instruments and 8 main instruments based on instrument guidelines obtained from the SNA2008 and ESA2010.
11
7.
FBSAA MODEL SET-UP
The FBSAA model has various components, each one unique with its own dimensions but also intricately interrelated with one another. For this reason it is necessary to systematically characterize each component and thereby provide a view of the foundation and structure of the model. The rest of this chapter is structured as follows – first the different phases of the project are explained. Thereafter the project monitoring, control and communication activities are described. This is followed by a discussion of the key parameters underlying the FBSAA model. Thereafter the building block component of the FBSAA model is addressed. Following this, is an exposé of how the valuation calculations are done before expanding on the balancing methodology. The chapter concludes with a discussion of the FBSAA model output and statistics dissemination strategy.
7.1
P
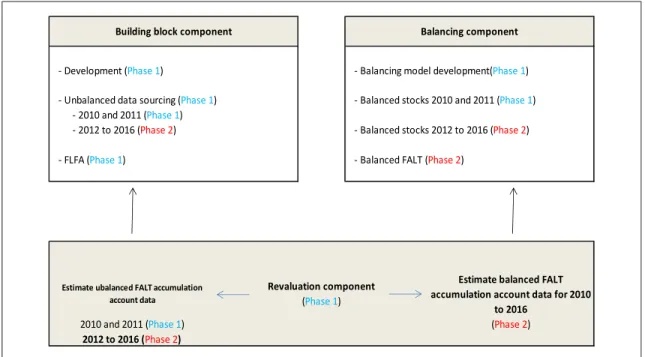
ROJECT PHASESThe inputs into the FBSAA model encompass a vast number of data sets that are merged into one harmonized data set. This entails the amalgamation of raw data from various statistical domains, which have been compiled within their own paradigms, rules and structures. In addition to this the FBSAA model represents the first effort by the SARB to construct a complete FBSAA model entailing all the different components. This has given the project an expansive and iterative nature, and therefore it was decided to implement the development in a stepwise manner. Thus, the development of the FBSAA model is divided into three distinct phases. Phase 1 covers the following areas:
Development of the building block component to be utilized over the full scope of the project (2010 to 2016);
Development of the revaluation component to estimate the accumulation account data for the full scope of the project;
Development of the balancing component to be used for the full scope of the project;
Sourcing of unbalanced sector balance sheet data for the periods 2010 to 2011 on a quarterly basis, i.e. 8 quarters – this phase only addresses these two years to provide the model compilers the opportunity to identify and accommodate significant data gaps and also provide the sector compilers with feedback regarding their data gaps in order for them to address these in the input data from 2012 to current;
Execution of the First Level Financial Asset and Liability Analysis (FLFA) for the period 2010 and 2011;
Estimation of unbalanced accumulation account data for the period 2010 and 2011 on a quarterly basis, i.e. 8 quarters; and
Generation of balanced stock data for the period 2010 to 2011 on a quarterly basis, i.e. 8 quarters.
Most of the activities in phase 2 of the project will be dealt with in the future development section of the study and relates to:
12
Estimation of the unbalanced accumulation account data for the period 2012 to 2016 on a quarterly basis, i.e. 20 quarters; and
Balancing of stocks for the period 2012 to 2016 (20 quarters);
Detail level accumulation account estimation for period 2010 to 2016 (28 quarters); and
Population of balanced FALTS (BFALTS) for the entire project scope period.
Phase three covers the full operational integration of the FBSAA model into the suite of macroeconomic indicators that is already generated by the SARB. Figure 7.1 provides a diagrammatical view of the different components and phases.
- Development (Phase 1) - Balancing model development(Phase 1)
- Unbalanced data sourcing (Phase 1) - Balanced stocks 2010 and 2011 (Phase 1) - 2010 and 2011 (Phase 1)
- 2012 to 2016 (Phase 2) - Balanced stocks 2012 to 2016 (Phase 2)
- FLFA (Phase 1) - Balanced FALT (Phase 2)
Building block component Balancing component
Revaluation component
(Phase 1)
2012 to 2016 (Phase 2)
2010 and 2011 (Phase 1) (Phase 2)
Estimate ubalanced FALT accumulation account data
Estimate balanced FALT accumulation account data for 2010
to 2016
Figure 7.1 - Components of the FBSAA model
Much of the work done in phase 1 forms the foundation of the complete FBSAA model and will be utilized in phase 2. This component of the work also provides the empirical results which are analyzed in chapter eight.
7.2
M
ONITORING,
CONTROL AND COMMUNICATIONPlanning and communication are key tasks around which the execution of the FBSAA project revolves. These involve the following key pillars:
Strategic planning: this pillar involves designing the strategy whereby the project is implemented as well as the overall fit of the project into the key focus areas of the SARB;
Operational planning: this pillar involves planning the operational activities in the project, covering aspects such as resources, timing, work flow etc.;
13
Management of process and output: this pillar entails the managerial focus which is needed to guide all participants in the project to fulfill their specific role in order to meet the stated objectives and goal; and
Communication of relevant information to the appropriate stakeholders: this pillar encompasses regular clear and effective communication regarding all the relevant aspects of the project. This is done either via electronic channels or face-to-face.
Both strategic and operational planning are necessary for the efficient management of the numerous statistical operations contained within the project which entails complex processes of conceptualization, interaction with sources of information, resource management, and performance monitoring.
The ultimate objective underlying these functions in the project is to:
Define the project direction, ultimate goal and intermediate objectives;
Support resource management and allocation;
Manage performance;
Provide input for coordination; and
Set priorities.
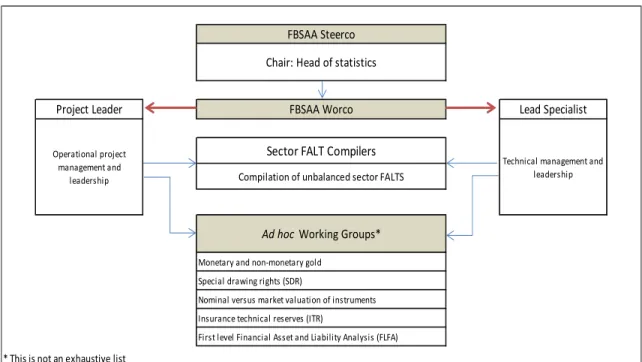
In line with the above-mentioned outline, the FBSAA management framework (see figure 7.2) comprises two different but related areas – strategic and operational – and for that reason, two main committees have been created – the FBSAA Steering Committee (Steerco) and the FBSAA Working Committee (Worco) – with specific characteristics and objectives as follows:
1. Steerco acts as the overarching strategic steering committee with which the responsibility lies to steer the project to completion and in so doing deliver on the ultimate goal. This committee convenes once per month and receives high-level feedback regarding the progression towards achieving the project milestones. Steerco is also the forum where bottlenecks and risk factors pertaining to the project are discussed and high-level risk-mitigating decisions are taken. Thus, Steerco acts as a high-level progress evaluation and think-tank with the aim of keeping the project on track as well as elevation of potential risks to the correct executive level in order to mitigate their impacts on ultimate goal delivery. Steerco’s mandate takes the following into account:
Project management feedback from project leader and lead specialist;
Sector compiler inputs;
Reporting on and evaluation of key milestones; and
Horizon planning and risk mitigation.
14 system is the integration of the different components and levels of the FBSAA model. These relate to:
Sector compiler areas;
The central management area; and
The monitoring platform – which provides a monitoring system to keep track of all the different components of the FBSAA model and take appropriate action to keep progress on track.
In order to achieve the ultimate goal of the project, the co-ordination of all activities lies with three key role players within the management structure: the chairperson of Steerco, the project leader and the lead specialist. Their roles can be elaborated on as follows:
1. The chairperson of Steerco is also the head of statistics of the ERSD and the sponsor of the FBSAA project, being responsible for aligning the ultimate goal of the project with the strategic focus areas of the SARB and also report to the Governors Executive Committee (GEC) on the project progress;
* This is not an exhaustive list
FBSAA Steerco
Chair: Head of statistics
FBSAA Worco
Project Leader Lead Specialist
Sector FALT Compilers
Technical management and leadership Operational project
management and
leadership Compilation of unbalanced sector FALTS
First level Financial Asset and Liability Analysis (FLFA) Ad hoc Working Groups*
Monetary and non-monetary gold
Special drawing rights (SDR)
Nominal versus market valuation of instruments
Insurance technical reserves (ITR)
Figure 7.2 – FBSAA management framework
2. The project leader provides overall project leadership and operational drive and is responsible for the execution of agreed upon intermediate steps towards fulfillment of the ultimate goal; and 3. The lead specialist is responsible for the technical development and drive of the project and typically has more in-depth knowledge of the financial components of the South African economy, sectors and instruments.
15 pertaining to the general project outline such as dates and times of meetings, minutes taken during previous meetings and formalization of action plans agreed upon to achieve specific objectives. The lead specialist has communication responsibilities with regard to technical aspects and is responsible to communicate on the technical outcomes of the ad hoc working groups, explaining the technical decisions made and the impact of these decisions on the FBSAA model. The project leader and lead specialist as well as one additional senior economist form the nucleus of the FBSAA model development team, solely devoted to this project. The expanded team comprises of an additional 9 economists, 4 which are division heads in ERSD. The remaining 5 members are all senior economists in the data supplying divisions which compile the raw data sets entering the FBSAA model.
7.3
T
HEFBSAA
MODEL PARAMETERSAt this stage, it is important to define and delineate the FBSAA model parameters. These parameters are primarily derived from the mandate provided to Steerco for the development and implementation of the FBSAA model, which is to develop a full set of financial balance sheet and accumulation accounts for all the sectors of the South African economy.
From this mandate, the operational classification of the parameters can be developed. The three main operational parameters relate to the project scope timeframe, the sectors of the economy as well as the instruments to be covered. Lastly it is also necessary to define in more detail what type of financial information relating to the identified instruments needs to be measured.
The first operational parameter to be specified relates to the measurement timeframe of the project as well as the frequency within this timeframe with which the data has to be compiled. In order to track the developments in institutional sector balance sheets since relatively shortly after the financial crisis the starting period for the project is 2010. The first and second phase of the project – which is the focus of this study - will yield FBSAA statistics until 2016 on a quarterly basis – thus 32 quarters in total. Phase 3 of the project will entail the routine quarterly integration of the FBSAA production cycle into the broader statistics model of the ERSD.
16
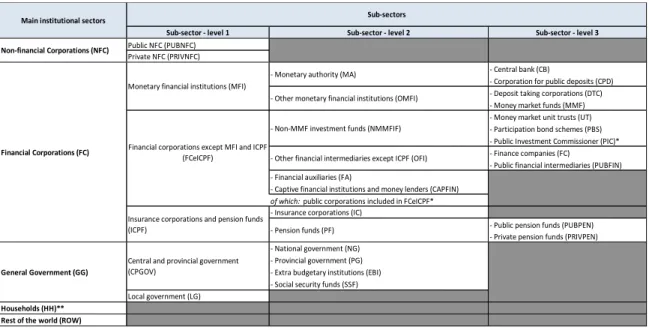
Sub-sector - level 1 Sub-sector - level 2 Sub-sector - level 3
Public NFC (PUBNFC) Private NFC (PRIVNFC)
- Central bank (CB)
- Corporation for public deposits (CPD) - Deposit taking corporations (DTC) - Money market funds (MMF) - Money market unit trusts (UT) - Participation bond schemes (PBS) - Public Investment Commissioner (PIC)* - Finance companies (FC)
- Public financial intermediaries (PUBFIN) - Financial auxiliaries (FA)
- Captive financial institutions and money lenders (CAPFIN)
of which: public corporations included in FCeICPF* - Insurance corporations (IC)
- Public pension funds (PUBPEN) - Private pension funds (PRIVPEN) - National government (NG)
- Provincial government (PG) - Extra budgetary institutions (EBI) - Social security funds (SSF) Local government (LG)
Households (HH)** Rest of the world (ROW)
Financial corporations except MFI and ICPF (FCeICPF)
- Non-MMF investment funds (NMMFIF) Sub-sectors
- Other financial intermediaries except ICPF (OFI)
General Government (GG)
- Pension funds (PF) Main institutional sectors
Non-financial Corporations (NFC)
Financial Corporations (FC)
Monetary financial institutions (MFI)
- Monetary authority (MA)
- Other monetary financial institutions (OMFI)
Insurance corporations and pension funds (ICPF)
Central and provincial government (CPGOV)
Table 7.1 – Sector delineation of the FBSAA model
The FBSAA model commences with the 5 main institutional sectors – four domestic as well as the Rest of the World (ROW), which is also treated as a separate “sector” – with three of them further broken down into sub-sectors as follows:
The Non-financial Corporations (NFC) sector is further broken down into the Public NFC (PUBNFC) and Private NFC (PRIVNFC) sectors;
The Financial Corporations (FC) sector has the most elaborate sub-sector breakdown:
The first sub-sector is the Monetary Financial Institutions (MFI) sector which is further broken down into the Monetary Authority (MA) and Other Monetary Financial Institutions (OMFI). In South Africa’s case the MA sub-sector is further broken down into the Central Bank (CB) and the Corporation for Public Deposits (CPD). The CPD is a subsidiary of the CB and accepts call deposits from the public sector and invests the funds in short-term money-market instruments and Treasury Bills (TB’s)3. The OMFI sub-sector is broken down into the Deposit Taking Corporation (DTC) and Money Market Fund (MMF) sub-sectors;
The next delineation below the main FC sector is the Financial Corporations except Insurance Corporations and Pension Funds (FCeICPF) sub-sector. This sub-sector is broken down into four additional sub-sectors as well as two memo item “sub-sectors”4. The four sub-sectors are the Non-Money Market Fund Investment Funds (NMMFIF), the Other Financial Intermediaries except Insurance Corporations and Pension Funds (OFI) sector, the Financial Auxiliaries (FA) sector and the Captive Financial Institutions and Money Lenders (CAPFIN)
3
With the permission of the Minister of Finance, the CPD may also accept call deposits from other depositors
4
17 sector. The two memo item “sub-sectors” are the Public Investment Corporation (PIC) sector and an “of which public” aggregation of the public corporations in the FCeICPF sub-sector. There is a specific reason why the PIC was included explicitly - it is the only investment management company in South Africa that focuses exclusively on the public sector – investing, amongst others, the public sector pension funds. It is wholly owned by the South African government and given the magnitude of this entity in this sub-sector it is shown separately in the FBSAA model as a memo item as well as being included in the NMMFIF sub-sector. The consolidation of the public corporations data for this sub-sector has been included for analytical interest to explicitly gauge the presence of public financial intermediaries;
The last major sub-sector in the FC sector is that of Insurance Corporations and Pension Funds (ICPF). The pension funds sub-sector is further broken down into public pension funds (PUBPEN) and private pension funds (PRIVPEN).
The General Government (GG) sector is broken down into two main sub-sectors – the Central and Provincial Government (CPGOV) sub-sector and the Local Government (LG) sub-sector. The CPGOV sub-sector is further broken down into the National Government (NG), Provincial (State) Government (PG) and Extra Budgetary Institutions (EBI). An EBI is a national public entity and consists of a board, commission, company, corporation, fund or other entity which is not classified as a quasi-corporation. EBI’s produce goods and services for government or sell goods and services to the public. In addition to the above-mentioned sub-sector split there is also an additional elucidation category for Social Security Funds (SSF) – a category which has seen a significant increase over the past two decades in South Africa. These SSF’s provide comprehensive social security services against vulnerability and poverty within the South African constitutional and legislative framework.
The last two sectors included in the FBSAA model are the household (including NPISH5) sector with no additional disaggregation and the ROW “sector”.
The third operational parameter which needs to be defined relates to the classification of financial transactions, assets and liabilities into different instrument categories. Financial transactions relate to transactions in financial assets and liabilities between the resident institutional units which have been grouped into sectors, and between these resident units and non-resident units (collectively forming the ROW “sector”). A financial transaction between institutional units is a simultaneous creation or liquidation of a financial asset and the counterpart liability, or a change in ownership of a financial asset, or an assumption of a liability (ESA2010).
Financial assets consist of all financial claims, equity as well as the gold bullion component of monetary gold, and are stores of value representing a benefit or series of benefits accruing to an eco-nomic owner by holding or using the assets over a period of time. They are a means of carrying forward values from one accounting period to another. Liabilities are established when a debtor is obliged to provide a payment or a series of payments to a creditor.
5
18
The term instrument will thus relate to both the asset and liability component of financial transactions. In addition to the stock positions in assets and liabilities and the corresponding transactions there are two additional components that provide the complete FBSAA model – revaluations and other volume changes (OVC’s). Changes between the opening balance sheet and the closing balance sheet could also be partially explained by these two additional flow categories, which are not interactions between institutional units by mutual agreement. Revaluations are recorded in the revaluation account and OVC’s in the OVC account.
One of the critical considerations in the FBSAA model is to maintain a balance between too exhaustive sub-instrument breakdowns on the one hand and not having enough detail for sufficient analysis on the other. In order to address this requirement, the eight broad instrument categories detailed above are expanded to contain more detailed sub-instrument categories as depicted in Table 7.2. The expansion in the sub-instrument categories increases the depth of analysis but also addresses South African specific analysis requirements. In addition to the sub-instrument delineation in Table 7.2 the currency composition - domestic versus foreign - as well as maturity structure – short- and long-term - form two additional reporting requirements in several of the instrument categories. This allows for a richer risk analysis regarding instrument structure, foreign exchange exposure and maturity misalignment.
For purposes of the FBSAA model the following eight high-level instrument categories are identified:
Monetary gold and special drawing rights;
Currency and deposits;
Debt securities;
Loans;
Equity and investment fund shares or units;
Insurance, pension and standardized guarantee schemes;
Financial derivatives and employee stock options; and
Other accounts receivable/payable.
19
1 Monetary gold and SDR's
1.1 Monetary gold
1.2 SDRs
2 Currency and deposits
(of which domestic currency)
2.1 Currency
2.2 Transferable deposits
2.2.1 Interbank positions
2.2.3 Other transferable deposits
F29 Other deposits
3 Debt securities
(of which domestic currency)
3.1 Short-term securities
3.1.1 Treasury bills
3.1.2 Short-term government bonds
3.1.3 Short-term private sector bonds
3.2 Long-term securities
3.2.1 RSA-retail savings bonds
3.2.2 Long-term government bonds
3.3.3 Securities of local governments
3.3.4 Securities of public enterprises
3.3.5 Other private sector bonds and preference shares
4 Loans
(of which domestic currency)
4.1 Short-term (including bank loans and advances)
4.2 Long-term
(of which Mortgage loans)
5 Equity and investment fund shares/units
5.1 Equity
5.1.1 Listed shares
5.1.2 Unlisted shares
5.1.3 Other equity
5.2 Investment fund shares/units
5.2.1 Money market fund shares/units
5.2.2 Non MMF investment fund shares/units
6 Insurance, pension and standardized guarantee schemes
6.1 Non-life insurance technical reserves
6.2 Life insurance and annuity entitlements
6.3 Retirement entitlements (F63+F64+F65)
6.3.1 Pension entitlements
6.3.2 Claim of pension funds on pension managers
6.3.3 Entitlements to non-pension benefits
6.4 Provisions for calls under standardized guarantees
7 Financial derivatives and employee stock options
7.1 Financial derivatives
7.1.1 Options
7.1.2 Forwards
7.2 Employee stock options
8 Other accounts receivable/payable
(of which domestic currency)
8.1 Trade credits and advances
8.9 Other accounts receivable/payable
Source: SNA2008
Table 7.2 - Detailed instrument breakdown contained in the FBSAA model
20 useful analysis of the size and activity in the interbank market in South Africa. An additional requirement is the identification of domestic currency positions for the currency and deposit category.
The third instrument is Debt securities. Debt securities are negotiable financial instruments that serve as evidence of debt, and are divided by original maturity into two subcategories – short-term debt securities and long-term debt securities. Short-term refers to securities with an original maturity up to and including one year as well as securities payable on demand whilst long-term refers to securities with an original maturity exceeding one year, including securities where no maturity is stated. In addition to the maturity breakdown a currency breakdown, similar to the one required in the currency and deposits category, is also required. It is also useful to obtain the same data by residual maturity which provides the remaining time until the expiration or the repayment of the instrument – this could prove useful for liquidity analysis.
For analytical purposes a more granular breakdown of the short-term securities instrument is required, namely: TB’s, short-term public sector securities (excluding TB’s)6 and short-term private sector securities. Long-term securities are also broken down into more detail for analytical usefulness. RSA retail savings bonds are debt securities that have been designed to be as accessible as possible to the general South African public to invest in. These bonds yield a safe and market related return on investment7. The term securities instrument is further broken down into long-term national government, local government and public enterprises bonds. Private sector bonds and preference shares form the last category under the long-term securities instrument. Due to the nature of the sub-instrument category breakdown certain sectors are by implication excluded from activity in certain instruments. For example, the instrument category private sector bonds and preference shares will never contain any general government counterpart, etc.
The fourth instrument is Loans8. Loans are created when creditors loan to debtors. The loans category also provides for a domestic currency identifier as well as more detailed maturity breakdown. Short-term loans (which include bank loans and advances) are differentiated from long-term loans which include an “of which mortgage” component.
The fifth instrument - Equity and investment fund shares and units - is broken down into two separate sub-categories – firstly equity and secondly investment fund shares/units. In order to allow for richer analysis, the equity instrument is further broken down into listed, unlisted and other equity. The investment fund shares/units instrument is broken down into money market funds shares/units and non-money market fund investment fund shares/units.
The sixth instrument relates to Insurance, pension and standardized guarantee schemes. This instrument is broken down into four main sub-instruments, namely, Non-Life Insurance Technical Reserves, Life Insurance and Annuity entitlements, Retirement Entitlements, and Provisions for Calls under Standardized Guarantees. Retirement entitlements are further broken down into Pension
6
SARB debentures are grouped into this instrument sub-category
7
Two different types of RSA Retail Savings Bonds are on offer: the RSA Fixed Rate Retail Savings Bond, and the RSA Inflation Linked Retail Savings Bond
8
21 Entitlements, Claims of Pension Funds on Pension Managers, and Entitlements to Non-Pension Benefits.
The seventh instrument relates to Financial derivatives and employee stock options. This instrument is broken down into financial derivatives (differentiating between options and forwards) and employee stock options.
Finally, the eighth instrument is Other accounts receivable and payable which is broken down into trade credits and advances and other accounts receivable/payable.
Each of the eight financial asset categories noted above has a counterpart liability and vice-versa. The only exception is the gold bullion component of monetary gold held by monetary authorities as a reserve asset classified in the category monetary gold and special drawing rights. Due to the fact that monetary gold is a physical asset that has been monetized it has no liability counterpart. As mentioned earlier, the term instrument will thus relate to both the asset and liability component of financial transactions and will follow the above-mentioned instrument breakdown.
7.4
T
HEFBSAA
MODEL COMPONENTSDue to the expansive nature of the FBSAA model it is necessary to disaggregate it into different components in order to fully justify the description of and contribution that each component makes to the complete model. The model can broadly be disaggregated into four main components, namely:
The building block component (please see section 7.4.1): This component encompasses all the sub-components that will be utilized to source the data which is entered into the balancing process, therefore forming the “building blocks” of the balanced stock and accumulation data;
The valuation component (please see section 7.4.2): this component relates to the utilisation of price data to estimate valuation impacts between two stock positions and then derive transactions data;
The balancing component (please see section 7.4.3): This component entails the balancing process – both at high and detailed instrument level - with which the unbalanced sector balance sheet and accumulation accounts are transformed into balanced sector balance sheet and accumulation accounts; and
The output and dissemination component (please see section 7.4.4): this component details the range of outputs to be generated from the balanced sector FBSAA’s and also provides the structure for the dissemination strategy of the produced statistics.
7.4.1 The building block component
22 7.4.1.1 Data sourcing
In order to source the raw stock position data per institutional sector, the FBSAA model utilizes Financial Asset and Liability Templates (FALTS). These are excel based templates which have been designed to meet national and international data requirements into which the raw source data9 from various internal sector compilers within the ERSD are populated. Although this step forms the data entry level into the FBSAA model, this data will have gone through a previous validation process when it entered the ERSD statistical database via specific first level data channels. The FALTS have been developed taking into consideration the data requirements of the IMF, the G20DGI as well as specificities which will be beneficial for national analysis. The FALTS are comprised of the following sub-components:
Bridging templates: The role of the bridging template contained within the sector FALTS is to facilitate the mapping of raw data from various first-level data areas into the required sector and instrument classification contained in the FALTS. This can be seen as the foundation step of the building block component. The data for each sector is entered manually (through static downloads) into the bridging templates in order to ensure that there is no automatic update of building block data – this is a system integrity check that ensures synchronized data revision across all contributory first-level data sets. Although the conceptual design of the bridging templates is generic each bridging template eventually assumes a unique final form. This is due to the fact that different raw datasets are used to populate each sector’s bridging template. For example, the DTC bridging template might contain 10 sub-instruments that comprise the total opening stock (or closing stock) value for the instrument “Other deposits” whilst the same item for a different sector might contain less or more sub-instruments. The advantage of this is that it allows significant flexibility to the sector compiler to migrate their data from their “known” production areas into the FBSAA model. The second but equally important advantage is that it allows for the FBSAA compiler to have a road map from the FBSAA data back into the raw datasets which provides a clear audit trail in case of data anomalies. These anomalous data can then easily be traced back and in most instances resolved without having to revert back to the sector compiler.
Counterparty templates: One of the most important requirements emanating from the G20DGI was the need to provide inter-sector stock and flow linkages between the different domestic sectors of the economy as well as the ROW at detailed instrument level. In order to accommodate this requirement, the FALTS have five counterparty templates – two of them capture the counterparty stock positions (opening and closing) and three capture the counterparty accumulation flows (transactions, OVC’s and revaluations). These five counterparty templates are generic and enable the mapping of total stock and accumulation data for a specific sector for a specific period against all other domestic sectors (and sub-sectors) as well as the ROW. Each of these counterparty templates contains 2968 unique data cells which will be populated divergently depending on the instrument/sector configuration of each sector under review. This yields 5936 possible stock position data cells and 8904 accumulation data cells that explain the change between opening and closing stock positions for each sector for each period under review. This yields the first unbalanced FWTW stock and flow data from the perspective of the compiling sector. The advantage of this approach is that various elementary cell analysis can be done that already provides a view of the unique
9
23 instrument/counterparty structure of a sector’s stocks and flows even before values are formally analyzed. This allows the FBSAA compiler to quickly asses the number of cells containing data, blanks or zeros as well as what the dispersion of the total values are across sectors as well as an asset versus liability dispersion assessment. This provides the first details of the structural composition of a specific sector and also allows the sector compiler to provide a cell quality heat map in order to differentiate cells with lower and higher quality data.
Revaluation split template: Another key requirement placed on the FBSAA model is the need to be able to differentiate between the three components of the accumulation accounts, namely, transactions, OVC’s and revaluations. In South Africa’s case this is a very demanding requirement because most of the available sector data only covers stock positions. Thus, in the absence of actual transaction data it is necessary to create a sub-system to estimate it.
In order to estimate transactions data, it is first necessary to isolate the revaluation component of the accumulation flows and thereafter derive transactions.
This equation for this can be written as follows:
CS = OS + T + R + OVC
where:
CS = closing stock,
OS = opening stock;
T = transactions
OVC = Other Volume Changes; and
R = Revaluations
Rewriting this equation to isolate T as the dependent variable yields:
T = CS – OS – OVC - R
In the absence of measured data on transactions and revaluations the equation can be replaced with:
Td = CS-OS-OVC-Re
where:
Td = derived transactions; and Re = estimated revaluations
24
Summary statistics: The final template contained in the sector FALTS is a summary output template of the unbalanced totals and counterparty sector data per sector. The summary statistics template yield the first holistic view of the unbalanced FBSAA for a specific sector for the main instrument and sector categories – OS and CS positions, OVC’s, Re and Td. The intention is to provide an initial high-level – instrument and sector - assessment of the sector balance sheet and accumulation accounts for the period under review from the perspective of a sector vis-à-vis its counterpart sectors. The benefit of this is twofold – it is of analytical use to the sector compiler in the analysis done for various statistical outputs other that the FBSAA but also serves as a first level validation of the raw data entered into the FBSAA model because it affords the compiler an opportunity to identify obvious data errors in the FALTS. Item 12.1 in the appendix provides an example of this summary template. One of the key challenges in the development and implementation of the FBSAA model relates to the treatment of sub-sectors for which data is not yet sourced, or is sourced but aggregated into categories which does not directly align with the sector breakdown contained within the model requirements. In South Africa’s case this is particularly true for the OFI and CAPTIVE financial sectors. With regards to the OFI sector there are only currently two sub-sectors as delineated in the sector parameter section for which data is sourced directly, namely the Finance Companies (FINCO) and Public Financial Intermediaries (PUBFIN) sub-sectors. This poses a problem due to the fact that the counterpart sectors report asset or liability positions against all the sub-sector’s contained within the OFI sector whilst the directly sourced data only relates to the two mentioned sub-sectors. This generally provides a significant asset/liability mismatch in the unbalanced FALTS. This mismatch is addressed in two different manners – firstly, the unbalanced FALTS are not adjusted but in the balancing process, after validation that the unbalanced FALT cells have been entered correctly the larger of the asset or liability position replaces the smaller position, thereby acknowledging that the two sub-sectors which are measured is only a fraction of the assets or liabilities that exists in reality. The second intervention to address this problem is the development of measurement structures for the other financial sub-sectors contained within the OFI sector – this is elaborated on in the future developments part of this study. The other sector that has a similar problem relates to the CAPTIVE sector where holding companies are allocated to. The unbalanced FALTS generally contain asset positions in listed shares against the holding companies but due to the fact that the holding companies are not yet directly measured the liability side is often missing. In this instance the liabilities in listed shares of the holding companies are imputed from the asset positions reported against them. This is also one of the future development areas discussed in section 9 of this study. In instances where sector compilers only have annual data for a specific instrument they use a business cycle proxy closely related to that instrument to infer the positions of the two middle quarters from the two annual positions. This is however very limited due to the fact that most of the data entered into the FBSAA model is already measured on a quarterly frequency, but the issue of moving towards the measurement of all required data at quarterly frequency is also addressed in the future developments section.
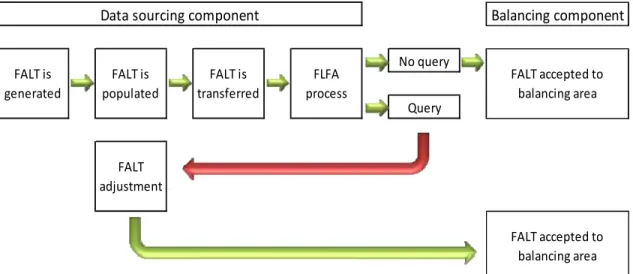
7.4.1.2 First Level Financial Asset and Liability Analysis
25
No query
Query
Data sourcing component
FALT accepted to balancing area
FALT accepted to balancing area
Balancing component
FALT is generated
FALT is populated
FALT is transferred
FLFA process
FALT adjustment
The FLFA process is a once-off validation tool used to ensure that the building block datasets for each sector is as sound as possible.
Figure 7.3 illustrates that the FLFA process is positioned as a validation protocol between the first finalization of a specific template by the sector compiler and the acceptance of this sector FALT into the balancing component. The FLFA process analyses data generated for the eight quarters from Q1 2010 to Q4 2011. Once the FALTS for this period for a specific sector has been populated with OS, CS and OVC data and has been marked as complete (FIN1) by the sector compiler it is subjected to the FLFA process for that sector. Two sets of analysis are done within the FLFA process - both possibly yielding queries - which are then directed to the responsible sector compiler as part of the FLFA query process. The queries that are generated address the following issues:
mapping errors;
level anomalies; and
classification issues (sector and/or instrument).
The first step in the FLFA process is for the sector compiler to complete all 8 FALTS for the 2010 and 2011 period. Once this is done a FIN1 status is awarded to the specific sector and the FLFA process for that sector is activated. The FLFA process then identifies areas of concern to be raised with the sector compiler in the form of queries. Once these queries have been satisfactorily dealt with and the unbalanced FALTS adjusted by the sector compiler - where applicable - the FALTS are resubmitted and marked as FIN2 – indicating that the level of integrity of the specific unbalanced FALTS are as good as possible at the sector compiler level.
Figure 7.3 - FLFA process within the building block component