doi: 10.1590/0101-7438.2014.034.02.0347
A SUPPLIER SELECTION MODEL BASED ON CLASSIFYING ITS STRATEGIC IMPACT FOR A COMPANY’S BUSINESS RESULTS
Thomas Edson Esp´ındola Gonc¸alo and Luciana Hazin Alencar*
Received January 9, 2013 / Accepted December 1, 2013
ABSTRACT.One of the most important aspects for companies’ success is the relationship between com-panies and their suppliers. Consequently, the way that a supplier is selected is crucial to the outcome of the business. Thus, we propose a multicriteria decision support model with two phases: the analysis of the products/services from suppliers that need to be evaluated, using PROMSORT, and the analysis of the suppliers of such products/services which is considered critical, using PROMETHEE II. The model was applied to a Distribution Center of an important Brazilian retailer which serves stores in the North and Northeast regions of Brazil. Using the proposed model, companies can focus their attention on those products or services that have the greatest impact on their business results. The model predicts that differ-ent decision-making processes should be applied, in accordance with the class of importance into which the products or services are classified.
Keywords: supplier selection, Brazilian retail market, Promethee.
1 INTRODUCTION
According to Osman & Demirli (2010), improving the efficiency of supply chain partners has become a major requirement of any supply chain due to the highly competitive nature of the current marketplace. Due to this increase in competitiveness, companies are also adopting strate-gies to concentrate on their core business by outsourcing other activities related to the business. Therefore, the relationship between companies and their suppliers is gaining increasing impor-tance, as are the characteristics of the partnership necessary for the supply chain. Thus, the way that a company selects its suppliers has an impact on the results of all companies in the chain.
This competitive environment points to the need to seek a closer relationship with suppliers that will improve the results for both parties. Ho, Xu & Dei (2010) show that the management of the supply chain requires the maintenance of long-term partnerships with suppliers, and uses fewer and more efficient suppliers. Punniyamoorthy, Mathiyalagan & Parthiban (2011) explain that
*Corresponding author
the selection of suppliers is one of the most important stages of the supply chain and has an important impact on the success of any organization or supply chain.
According to Saen (2007), supplier selection is the process in which suppliers are inspected, evaluated and selected to eventually become part of the supply chain of an organization. The selection and evaluation of suppliers is an area which has attracted the attention of most studies, and there are several approaches to support decision making on this issue.
To Vinodh, Ramiya & Gautham (2011), the supplier selection problem is a multicriteria decision-making problem in the presence of various criteria and sub-criteria, be they quantitative or qual-itative. Due to this characteristic, there arises the need to use more robust tools for decision support.
Basnet & Weintraub (2009) assert that, in the current context of globalization, companies are increasing the focus on their core business and outsourcing their other activities. This behavior increases the importance of the process for selecting suppliers. While small firms select partners based on criteria which determine the lowest costs, large companies must select their suppliers more carefully, by considering different criteria that seek a long-term relationship with their suppliers.
This trend shows up in various areas of activity in the market, including in the retail market, which is characterized by a highly competitive and dynamic environment. The fact that there are so many competitors in the market requires retailers to reduce their profit margins so they can offer their products at a competitive price to customers. The environment described requires supplier selection to be effective. All details have an important impact on the results produced by the supply chain.
In most cases, however, companies do not have an overview of the importance of the raw ma-terials and/or services that have been outsourced to their suppliers. In such cases, the company may be focusing its attention on products or services that are not the most critical to its results. Thus, it is important that the company conducts an analysis of the importance of its raw materi-als and/or third party services, and then reviews the configuration of its suppliers. After having assessed which products or services are most critical to it, the company can direct its efforts towards evaluating the aspects of the critical supply. And thereafter, it can proceed to selecting suppliers for its most critical products or services.
Within this context, this paper aims to propose an integrated model for classifying suppliers in accordance with decision makers’ preferences and for supplier selection, in accordance with the class into which the supplier was sorted, taking into account the multiple criteria that should be considered when choosing a business partner. The model was applied in a distribution center of a large retail chain, which sells a wide range of households and personal products, in Brazil.
a Distribution Center (DC). The model was applied on the Operations Manager of the company who was deemed to be the decision maker (DM). Three interviews were conducted on the spot. In the first interview, data were obtained to characterize the DC. In the second step, the first phase of the model was applied, which involves classifying the outsourced services. In the third step, the second phase of the model was applied. The supplier who was able to provide the transport alternatives in accordance with the DM’s needs was selected.
The paper is organized as follows: Section 2 discusses the issue of vendor selection as presented in the literature, and emphasizes the tools used by the authors to deal with the problem. In Section 3, multicriteria approaches to support supplier selection decisions are discussed as is the technique chosen to tackle the problem in this study. In Section 4, a model for supplier selec-tion is proposed that can be used in companies from various sectors. Secselec-tion 5 gives the results obtained from applying the model in a DC of an important retailer in Brazil. Finally, there are closing remarks in which the contributions and limitations of the study are pointed out as is the need for further research on the topic.
2 SUPPLIER SELECTION PROBLEM
The problem of selecting suppliers has been extensively debated in the literature, as follows.
Several studies were developed using programming models for decision support. Aguezzou & Ladet (2007) propose a non-linear programming model for supplier selection that takes into ac-count the transport of materials in order to select the best supply configuration. Osman & Demirli (2010) proposed a model using bilinear programming goals to achieve a compromise solution that allocates the demands of the company among the suppliers, thus minimizing the distribu-tion cost. Wu et al. (2010) propose a multi-objective programming model for decision making on selecting suppliers, taking into account risk factors. For this purpose, the authors designed a fuzzy multi-objective programming model to deal with this problem. Mansini, Savelsbergh & Tocchella (2012) proposed integer programming based heuristics to solve the problem of select-ing a set of suppliers to satisfy product demand at minimal total costs, takselect-ing purchasselect-ing and transportation costs into account. A computational analysis was developed considering a single purchaser, 29 suppliers and 50 products.
suppliers. Ishizaka (2012) proposed the use of clusters and pivots to facilitate the use of AHP use in supplier selection. This advance is useful when the numbers of pairwise comparisons becomes overwhelming. The model was applied in the selection process by twelve suppliers based on three criteria. Ting & Cho (2008) combine the AHP tool with a linear programming model with multiple objectives and a set of system constraints. The programming model is developed to solve the problem and allocate optimal orders quantities of resources to selected suppliers.
Gomes, Rangel & Leal Junior (2011) dealt with the supply selection problem, considering uncer-tainty, by using the MAUT method, combined with the Interval Smart/Swing Weighting Method. The second method was used in the weights definition process, when making judgments by in-tervals. The model was applied in the selection of a printing service supplier.
Schramm & Morais (2012) proposed a multi-criteria decision model for supplier selection in the Brazilian construction industry. The model was based on the Simple Multi-Attribute Rating Technique Exploiting Ranking method (SMARTER).
The ANP (Analytic Network Process) was the tool selected by other scholars to deal with the problem. Gurpinar & Gencer (2007) used an ANP tool in order to evaluate the relationship between the criteria for selecting suppliers in a company in the electronics field. Kirytopoulos, Leopoulos & Voulgaridou (2008) also used an ANP to support the selection of the best compro-mise solution in the environment of the pharmaceutical industry. Verdecho et al. (2012) present an approach based on an ANP to manage collaborative relationships by considering not only the elements of inter-enterprise performance, but also the factors that influence collaboration. The approach was applied in a network of collaborating enterprises from the renewable energy sector in Spain.
Basnet & Weintraub (2009) dealt with the problem of supplier selection where there are several suppliers with limited capabilities. To solve the problem, the authors propose a genetic algorithm be used in the search for Pareto optimal solutions.
Alencar & Almeida (2010) used PROMETHEE VI method in order to select suppliers (project team members) based on group decision, considering the preference structure of each member. The model was applied in a construction environment.
A large number of other studies on this area have been published including those by: Kahraman, Cebeci & Ulukan (2003), Narasimhan, Talluri & Mahapatra (2006), Bansal, Karimi & Srinivasan (2007); Chen & Huang (2007); Yang et al. (2008); Ordoobadi (2009), Golmohammadi et al. (2009); Sawik (2010); Barker & Zabinsky (2011); Bai & Sarkis (2012), and Qin et al. (2012).
These studies include the following industries and markets: White good manufacturers, elec-tronic firm, widget manufacturer, computer industries, and civil construction. The models pro-posed range from those that use multi-objective programming to a neural network and genetic algorithms and they also include the use of various members of the MCDA family. Note that no studies were found in our review of the literature that rank suppliers according to the class to which the product/service was allocated.
3 MULTICRITERIA DECISION METHODS
In the field of decision support tools, multicriteria approaches are gaining attention because of their robustness and to facilitate the analysis of more complex cases in a very effective way. Vincke (1992) says that multicriteria decision analysis aims to give a decision maker (DM) the tools to solve decision problems where different, often contradictory points of view must be taken into consideration.
Vincke (1992) points out there are three families of multicriteria methods:
• The first is characterized by aggregating different viewpoints into a single function. The
most important methods are MAUT, SMART, SMARTS and AHP.
• The second aims to start building what is deemed an outranking relationship and to explore
these relationships to assist the DM. The most widely known methods are ELECTRE and PROMETHEE.
• The third family, known as interactive methods, alternates calculation and dialogue steps.
The PROMETHEE method is the one used in the model proposed in this article. According to Brans et al. (1998), the PROMETHEE method is important because it involves concepts and parameters that have some physical or economical interpretation that is easy for most DMs to understand.
Brans & Vincke (1985) point out that assigned weightspjrepresenting the degree of importance of each criteria, the degree of outrankingπ(a,b)are computed in accordance with the equation below:
π(a,b)= 1
P
n
j=1
pjFj(a,b), where P= n
j=1
pj.
Where the functionFj(a,b)is a number between 0 and 1 that increases when the values of
gj(a)−gj(b)increases and is equal to zero ifgj(a)=gj(b), wheregj(a)is the evaluation of the alternativeain the criterionj. In order to find the value of the functionFj(a,b), the DM can choose, for each criterion, one of six types of function as follows (Brans and Vincke, 1985):
• Usual criteria: No threshold needs to be defined;
• U-shape criteria: theqthreshold should be defined;
• V-shape criteria: thepthreshold should be defined;
• Level criteria: theqandpthresholds should be defined;
• Linear criteria: theqand pthresholds should be defined;
Where q is the indifference threshold, a value at which a valuation gap between the alterna-tives makes the DM indifferent, and pis the preference threshold, a value from which the DM expresses a preference between two alternatives.
To Brans & Vincke (1985),Fj(a,b)is a type of “intensity of preference”. After having obtained the values ofπ(a,b), two complete preorders can be obtained, as per the equations shown below:
ϕ+(a) = 1
n−1
b∈A
π(a,b).
ϕ−(a)
= 1
n−1
b∈A
π(b,a).
The intersection of these two streams produces a partial preorder, resulting from the application of the PROMETHEE I method. The PROMETHEE II method, in turn, ranks the alternatives based on the flowϕ(a)such that:
ϕ(a)=ϕ+(a)−ϕ−(a).
Thus, the complete preorder of the alternatives is obtained.
Araz & Ozkarahan (2007) proposed PROMSORT (a PROMETHEE Sorting method) which con-sists of a multicriteria method based on PROMETHEE, which ranks alternatives in predefined categories. In order to classify the alternative, PROMSORT follows the steps shown below:
According to Araz & Ozkarahan (2007), in order to determine the reference alternatives, all the alternatives are compared with the limit profiles by using the outranking relation obtained from using PROMETHEE. Thus, the comparison of a particular alternativeawith the profile defined limitbhis defined as per the relations determined below:
– ais preferred tobh:
(a Pbh) if ⎧ ⎪ ⎨
⎪ ⎩
φ+(a) > φ+(b
h)eφ−(a) < φ−(bh) or
φ+(a)=φ+(b
h)eφ−(a) < φ−(bh) or
φ+(a) > φ+(b
h)eφ−(a)=φ−(bh).
– ais indifferent tobh:
(a I bh) ifφ+(a)=φ+(bh)eφ−(a)=φ−(bh).
– ais incomparable tobh:
(a Rbh) if
φ+(a) > φ+(b
h)eφ−(a) > φ−(bh) or
φ+(a) < φ+(b
The classification of the alternatives into certain categories is obtained by the direct use of out-ranking relations obtained in the previous step. The following steps should be followed to allo-cate the alternatives to the respective allo-categories:
After this phase, some alternatives may not yet have been allocated to a category. In the third stage, the process of allocation uses the alternatives that have been allocated to a class as the reference point of the classes, in order to allocate the alternatives which have not yet been put into some class. For an alternativea that has not been allocated to a class, the procedure for doing so is as follows:
• Determine the distance from the cut-off point. The cutoff value ofbcan be set with the values 0 or 1 for optimism and pessimism, respectively. If the value of b is zero, the alternatives that were not allocated will be placed in categories according to their distance function. Ifb=1, these unallocated alternatives will be placed in the lower classes.
dk = 1
nt
dk+− 1
nt+1
dk−.
where:
dk+measures the outranking character ofaon all the alternatives allocated to categoryCt, and:
dk+=
x∈Xt
((a)− (x)).
d−
k measures the outranking character ofa on all the alternatives allocated to category
Ct+1, and:
dk−=
x∈Xt
((x)− (a)).
nt is the number of reference alternatives in categoryCt.
• Allocate the cutoff pointb. If the distance is greater than the cutoff pointb, the alternative a is allocated to categoryCt+1; otherwise, it is allocated to categoryCt. The cutoff point
bcan be specified by the DM and reflects his/her point of view, whether this is pessimistic or optimistic.
In the next section, the model for supplier selection is proposed.
4 SUPPLIER SELECTION MODEL
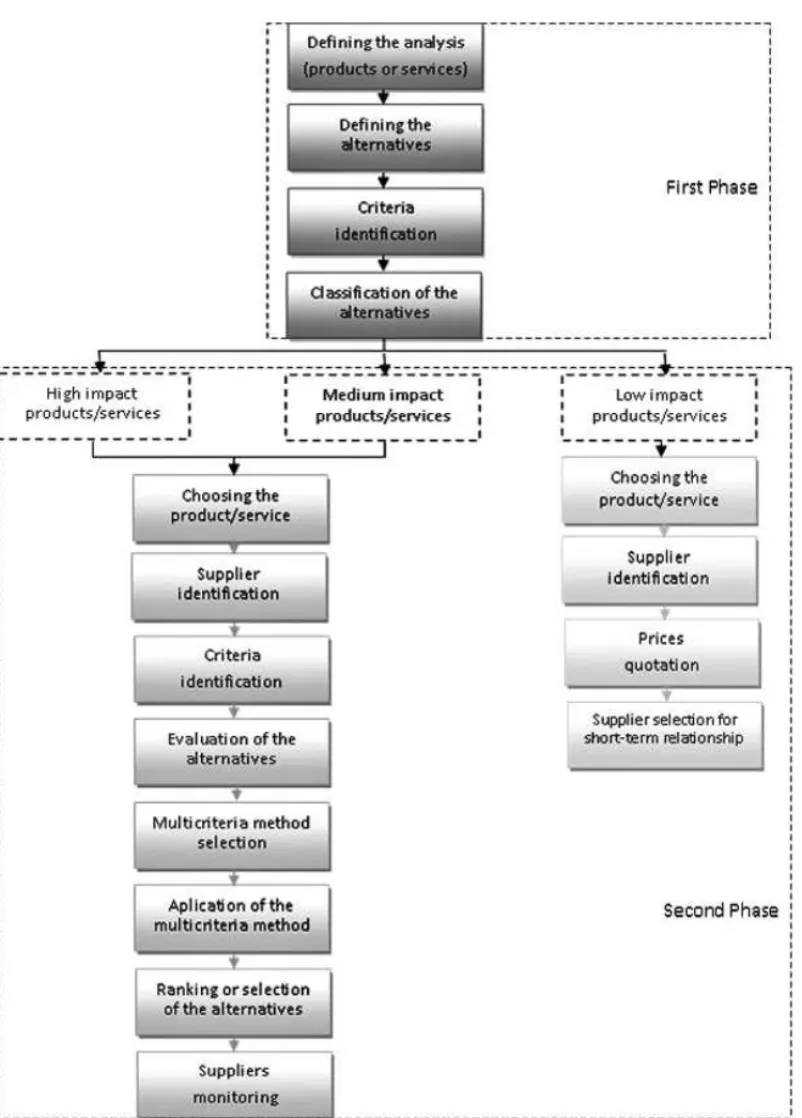
The model for supplier selection proposed is divided into two phases: in the first, the products or services being focused on and used by the agent are placed into classes; in the second, having selected the most critical product or service, the best supplier can be chosen. The model is shown in Figure 1.
classify the goods or services supplied in accordance with the level of their strategic impact on the company’s business.
First of all, the focus of the analysis is defined, whether for products or services, given the company’s needs. After making this definition, the alternatives should be selected, i.e., the prod-ucts or services to be considered in the analysis. The next step involves applying a multicriteria method so as to classify the alternatives according to the DM’s preferences. Then, the alterna-tives have to be classified into one of the three pre-defined classes: a high, medium or low impact on the company’s strategic objectives.
In the second phase, one of three approaches is chosen which is suited to the respective class of products or services determined in the first phase.
Depending on the class, the approach to follow is different. For products or services of lesser strategic impact, the selection can be performed more simply, by means of considering the cost criteria. For the products or services that are most important for the business results, a multicri-teria analysis for ranking suppliers is proposed.
The first class discussed is that of products or services that have a high impact. The products or services that are arranged in this class have a direct impact on the company’s results and more attention should be given to aspects of their supply. Initially, among the alternatives classified as high-impact, the product or service for which the analysis will be performed must be selected. Then the alternatives (suppliers) must be defined. The next step involves determining the criteria to be considered in the analysis. It is important to take into account the need for a partnership between the company and the suppliers of the service or product considered. Then, as per busi-ness needs, the analyst has to determine the most appropriate issue to be considered: selection, sorting or classifying suppliers. In accordance with the nature of the problem, the characteristics of the scenario, the profile of the issue and the DM’s views, the multicriteria decision support method needs to be selected. The method chosen shall be applied, considering the various alter-natives with respect to the criteria selected.
The products or services of medium impact on business results will be allocated into the second class. Their level of importance is lower than those that were allocated to the high impact class, but they should also be considered carefully. The subsequent steps are similar to those for an-alyzing high-impact products, i.e.: all of the following must be done – selecting the product or service that will be evaluated and defining who the potential suppliers will be, considering which criteria will be the most appropriate for the problematic, defining the multicriteria method and, finally, applying the method, and selecting, sorting or ranking such suppliers.
5 APPLYING THE MODEL
The company studied is one of the most traditional retailers in Brazil. It was founded in the 1930s, and it currently has over 600 stores in almost every state in the country and three distri-bution centers: two in the Southeast and one in the region Northeast.
The company sells over 60,000 SKUs (Stock Keeping Units) from 4,000 different suppliers; this demonstrates the wide variety of products that are distributed by the company and the im-portance of its maintaining good relationships with all of its suppliers.
Currently, the company has adopted a very aggressive expansion strategy and opened new stores, usually small ones, in line with the tendency to decentralize its outlets. This strategy, in turn, demands investing more in logistics and, at this point, the company’s distribution centers are the key elements of its strategy for maintaining a good overall performance. It therefore needs to pay greater attention to critical points related to the performance of its distribution centers, which includes its relationships with the various service providers it contracts.
Over the years, many methods have been proposed to address the problem of classifying alter-natives, amongst which are: ELECTRE TRI; the THESEUS method, proposed by Fernandez & Navarro (2011); and the PROMSORT method, proposed by Araz & Ozkarahan (2007). We selected PROMSORT as the tool for the first phase of the application. This uses the concepts of both “limit profiles” and a “reference alternative” to deal with the DM’s judgment, thus giving the DM the flexibility to define his/her (optimistic or pessimistic) point of view, and guarantees ordered categories, as per Araz & Ozkarahan (2007). Thus, when there is some hesitation in allocating a certain alternative to a class, the method compares it to a reference alternative, which has been allocated in a class based on comparison with the limit profiles. This process also considers whether the DM is being optimistic or pessimistic. Moreover, the PROMSORT method uses the PROMETHEE structure to address the DM’s preferences with the support of the preference functions. Therefore, the DM choose the function that best suits his/her preference structure, thereby facilitating the definition of the parameters for modeling the problem. These technical features facilitated the contact with the DM and the results proposed being achieved. Furthermore, by having used the PROMSORT Method in the first step of the application, it became easier for the DM to understand the meaning of the method’s parameters in the second phase.
5.1 First Phase of the Application
First of all, the decision maker (DM) chooses to analyze the services outsourced by the distribu-tion center (DC). Thus, in the first phase, the classificadistribu-tion of the services is obtained.
5.1.1 Defining alternatives
Several subcontractors carry out activities to support operations in the DC. The DM therefore listed the services that are currently outsourced by the DC. So, the eight services that have been outsourced were considered and are shown in Table 1.
Table 1– Characterization of the outsourced services in the company’s distribution center.
Service Attributions Number of
suppliers Cleaning Responsible for cleaning and maintenance of internal
2 (A1) and external areas of the Distribution Center.
Armed security Responsible for protecting the DC from the actions
1 (A2) of external agents. Work in the guardhouse and
do the rounds in external areas.
Property security Responsible for internal security on the premises
2 (A3) of the DC. Perform rounds and oversee the receipt
and shipment of goods of high value. Loading and unloading Responsible for loading and unloading of vehicles
1 (A4) both in receiving and in dispatch
Separation of goods.
Separation of the goods to be shipped to the stores. 2 (A5)
Maintenance Responsible for maintenance of the machinery
1
(A6) used in the DC.
Maintenance of the
Responsible for maintenance of the cameras
1 monitoring system
monitoring the DC. (A7)
Transport Responsible for the transportation of goods
7 (A8) from the DC to each store.
Refectory
Responsible for providing food for the employees. 1 (A9)
5.1.2 Defining criteria
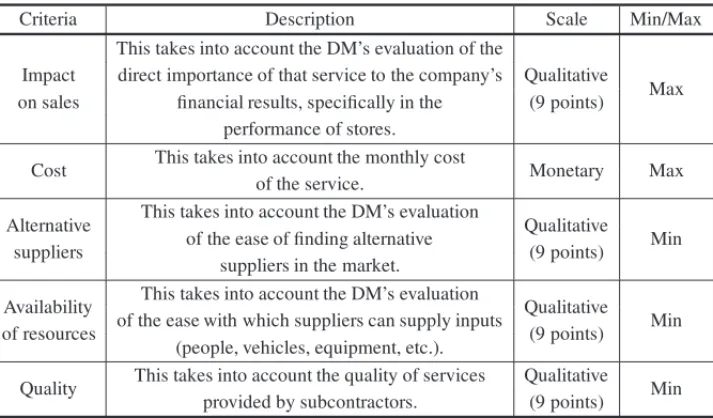
The DM defined a set of criteria in order to consider how critical the outsourced services are to the outcomes of the distribution center. Thus, five criteria were defined, which are given in Table 2.
Table 2– Characterization of the criteria.
Criteria Description Scale Min/Max
Impact
This takes into account the DM’s evaluation of the
Qualitative
Max on sales
direct importance of that service to the company’s
(9 points) financial results, specifically in the
performance of stores.
Cost This takes into account the monthly cost Monetary Max of the service.
Alternative This takes into account the DM’s evaluation Qualitative
suppliers of the ease of finding alternative (9 points) Min suppliers in the market.
Availability This takes into account the DM’s evaluation Qualitative
of resources of the ease with which suppliers can supply inputs (9 points) Min (people, vehicles, equipment, etc.).
Quality This takes into account the quality of services Qualitative Min provided by subcontractors. (9 points)
be noted also that the goal of analysis is to evaluate the impact that services have on business results. The DM directly assigned a weight to each criterion and was advised that a weight of 2x
attributed to certain criteria means that these criteria are twice as important as any criteria which are given a weight ofx. Thus, the weight represents the DM’s preference for any given criterion.
In order to classify the outsourced services into categories that represent their importance to the business, according to the DM’s needs, the PROMSORT method was chosen. The steps to obtain the configuration of these classes are as follows.
5.1.3 Apply PROMSORT
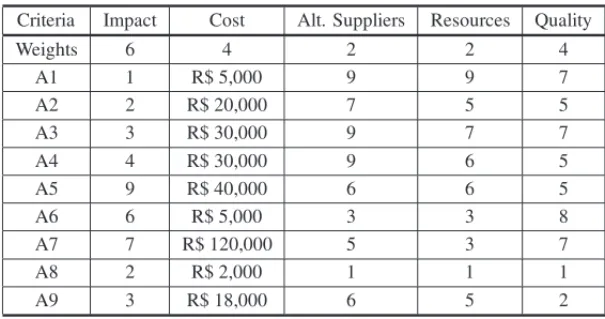
Having determined the criteria and their weights, a table was drawn up and the DM evaluated the alternatives considered, based on the chosen scales. Table 3 gives the matrix of the evaluations obtained and the weights assigned to each criterion.
The next steps involved defining the other parameters needed to perform the analysis. Thus, the DM selects the functions based on the usual criteria for the alternatives evaluated by using a qualitative scale. For the cost criteria, represented by the Brazilian unit of currency, the real (R$), the DM used a pseudocriterion function, for which the DM has adopted an indifference threshold of R$ 3,000 and a preference threshold of R$ 10,000.
In accordance with the model proposed, however, the alternatives needed to be allocated into classes in line with the critical role that they have for the company. PROMSORT was, therefore, used to allocate the alternatives into classes, based on the DM’s preferences.
Table 3– Evaluation matrix of the alternatives.
Criteria Impact Cost Alt. Suppliers Resources Quality
Weights 6 4 2 2 4
A1 1 R$ 5,000 9 9 7
A2 2 R$ 20,000 7 5 5
A3 3 R$ 30,000 9 7 7
A4 4 R$ 30,000 9 6 5
A5 9 R$ 40,000 6 6 5
A6 6 R$ 5,000 3 3 8
A7 7 R$ 120,000 5 3 7
A8 2 R$ 2,000 1 1 1
A9 3 R$ 18,000 6 5 2
limits may be regarded as fictitious alternative profiles used to determine the boundaries of the classes.
It should be noted that the DM showed sufficient understanding of the meaning of the concepts that underpin the model. He questioned the analyst during the elicitation process whenever he had any doubts.
Table 4 gives the evaluation matrix in which the parameters determined for the PROMSORT application are included:
Table 4– Matrix of the limit profiles.
Criteria Impact Cost Alt. suppliers Resources Quality
Limit Profile 1 3 R$ 10,000 7 7 7
Limit Profile 2 6 R$ 40,000 4 4 5
PROMETHEE I was applied and the values shown in Table 5 were obtained.
Following the application of the PROMSORT method, comparisons were made between the al-ternatives and the limit profiles of the classes. Thus, at the end of this stage, there is the following configuration of the classes of critical services that the company outsourced:
After this step, hesitation in allocating the transport alternative was detected. This alternative provided further input streams and output streams that were greater than the threshold profileb2.
Thus, doubt arises as to whether the service should be allocated to the high impact or medium impact class.
Table 5– Matrix of the values forϕ,ϕ+andϕ−.
ϕ+ ϕ− ϕ A1 0.7111 0.1778 0.5333 A2 0.7111 0.2111 0.5000 A3 0.4889 0.3889 0.1000 A4 0.4778 0.4000 0.0778 A5 0.4778 0.4333 0.0044 A6 0.4222 0.4778 -0.0556 A7 0.3222 0.5333 -0.2111 A8 0.2667 0.5444 -0.2778 A9 0.0222 0.8333 -0.8081 Limit Profile 1 0.2000 0.6000 -0.4000 Limit Profile 2 0.6889 0.1889 0.5000
Table 6– Partial results of the classification process.
High impact Medium impact Low impact
Incomparabilities services services services
[A5] [A9] [A1] [A8]
[A4] [A7] [A6] [A2] [A3]
The calculations resulted indk+=3,3623 anddk−=0,0333. Thus, we have the distance function
dk =0,527. The DM has identified his view as being optimistic. Therefore, the alternative was allocated in accordance with the distance function. Ifdk >b =0, the alternative of transport is allocated to the class of services most critical to the company’s results, in line with the DM’s preferences. The final allocation is shown in Table 7.
Table 7– Final results of the classification process.
High impact Medium impact Low impact services services services
[A5] [A9] [A1]
[A8] [A4]
5.1.4 Sensitivity analysis
A sensitivity analysis was conducted in order to assess the robustness of the results when small variations in the values of the parameters are considered.
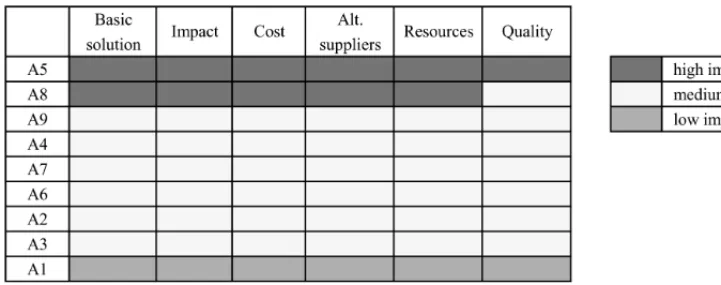
For the sensitivity analysis, the authors adjusted the weights assigned to each criterion. There-fore, the analysis took into account an increase of 15% in the weight of each of the criteria, and a proportionate reduction in the others. The results are shown in Figure 2. The color key shows which alternative classes were allocated to each of the scenarios tested.
Figure 2– Results of the Sensitivity analysis.
The sensitivity analysis was used to evaluate the robustness of the results arising from applying the method. For C1, C2, C3 and C4, increasing the values of the weight did not change the configuration of the classes and the services remained in the positions observed in the optimal solution. For criteria C5, however, the Freight service ended up being classified as a medium strategic impact, due to varying the values of the weights.
5.2 Applying the Second Phase
The results obtained from implementing the first phase of the model were shown to the DM and he suggested that the second phase be applied to the service of transporting goods. Note that is the manager interviewed who acts directly on the DC’s relationship with hauliers.
As previously assessed, transport is one of the most critical services to the performance of the DC, as per the DM’ preferences. Thus, it became necessary to perform an analysis taking into account important criteria with regard to selecting and improving the hauliers’ performance.
5.2.1 Defining alternatives
Table 8– Characterization of the transport alternatives.
Supplier Type Description
CMT Private Large haulier with nationwide operations. Specializes in medium-sized and large vehicles.
FLG Private Medium haulier with regional operations. Specializes in medium-sized vehicles
CTVL Cooperative Large cooperative with nationwide operations. Specializes in medium-sized and large vehicles
VTR Private Large haulier with nationwide operations. Specializes in medium-sized and large vehicles
DNM Private Medium haulier with regional operations. Specializes in medium-sized and small vehicles
NLG Private Small haulier with regional operations. Specializes in medium-sized and small vehicles
OLG Private Small haulier with regional operations. Specializes in medium-sized and small vehicles
5.2.2 Defining criteria
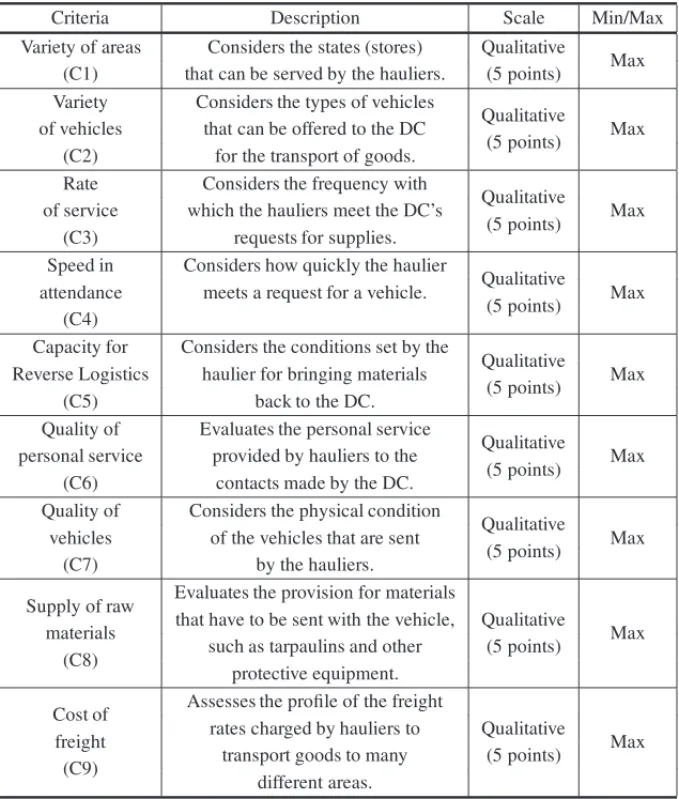
The DM then defined a set of criteria in order to obtain the ranking of the hauliers. These are shown in Table 9.
The DM, unlike in the first phase, selected a five-point scale to evaluate the alternatives according to the criteria. This change happened because the DM felt more comfortable about using that scale. Similarly to the first stage, the verbal scale is translated into a 5-point ordinal scale.
The DM highlighted the difficulty in measuring an average value for the service cost of each haulier. Thus, the DM used his experience and his day-to-day contact with the setting of freight rates to conduct a subjective assessment of costs related to each of the hauliers.
5.2.3 Applying PROMETHEE II
Table 10 shows the evaluation matrix evaluated by the DM and the values of the weights assigned to criteria.
The DM then defined his preference function for each criterion, in accordance with his assess-ment profile and considering his hesitation regarding his preference and indifference between the alternatives. Table 11 summarizes the parameters defined for applying the PROMETHEE method.
Then, PROMETHEE II was used to rank the transport alternatives, as per the preference of the manager of the area.
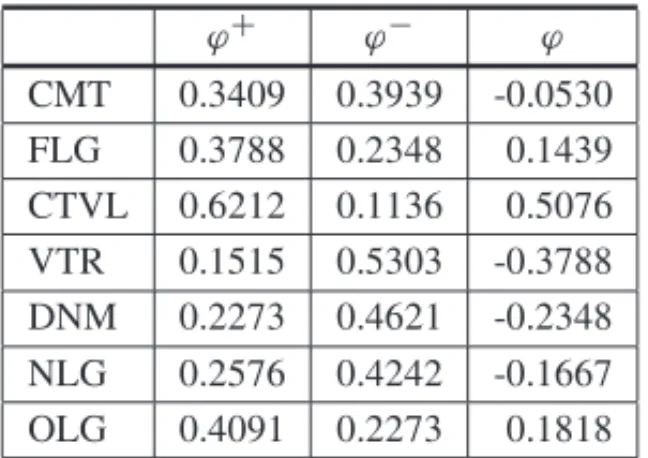
By applying PROMETHEE II, the following values forϕ,ϕ+andϕ−were obtained, as shown
Table 9– Characterization of the criteria considered by the decision maker.
Criteria Description Scale Min/Max
Variety of areas Considers the states (stores) Qualitative
Max (C1) that can be served by the hauliers. (5 points)
Variety Considers the types of vehicles
Qualitative
Max of vehicles that can be offered to the DC
(5 points) (C2) for the transport of goods.
Rate Considers the frequency with
Qualitative
Max of service which the hauliers meet the DC’s
(5 points) (C3) requests for supplies.
Speed in Considers how quickly the haulier
Qualitative
Max attendance meets a request for a vehicle.
(5 points) (C4)
Capacity for Considers the conditions set by the
Qualitative
Max Reverse Logistics haulier for bringing materials
(5 points) (C5) back to the DC.
Quality of Evaluates the personal service
Qualitative
Max personal service provided by hauliers to the
(5 points) (C6) contacts made by the DC.
Quality of Considers the physical condition
Qualitative
Max vehicles of the vehicles that are sent
(5 points) (C7) by the hauliers.
Supply of raw Evaluates the provision for materials
Qualitative
Max materials that have to be sent with the vehicle,
(5 points) (C8) such as tarpaulins and other
protective equipment.
Cost of Assesses the profile of the freight
Qualitative
Max freight rates charged by hauliers to
(5 points) (C9) transport goods to many
different areas.
Table 10– Evaluation matrix of the alternatives.
Service/Criteria C1 C2 C3 C4 C5 C6 C7 C8 C9 Weight 20 10 15 10 5 5 10 5 30
CMT 5 5 4 4 3 5 3 4 2
FLG 4 4 5 4 4 3 3 3
CTVL 5 5 4 4 3 3 3 5
VTR 1 2 3 3 3 3 2 3
DNM 3 4 3 2 3 2 3 3
NLG 2 2 5 5 4 4 4 2
Table 11– PROMETHEE II parameters.
Function Criteria
Usual (any difference in valuation
C1, C2, C3, C4, C7 and C9 is considered a preference)
Pseudo-criteria (with indifference thresholds
C5, C6 and C8
q=1 and preference thresholdsp=2)
Table 12– Matrix of the values forϕ,ϕ+andϕ−.
ϕ+ ϕ− ϕ CMT 0.3409 0.3939 -0.0530 FLG 0.3788 0.2348 0.1439 CTVL 0.6212 0.1136 0.5076 VTR 0.1515 0.5303 -0.3788 DNM 0.2273 0.4621 -0.2348 NLG 0.2576 0.4242 -0.1667 OLG 0.4091 0.2273 0.1818
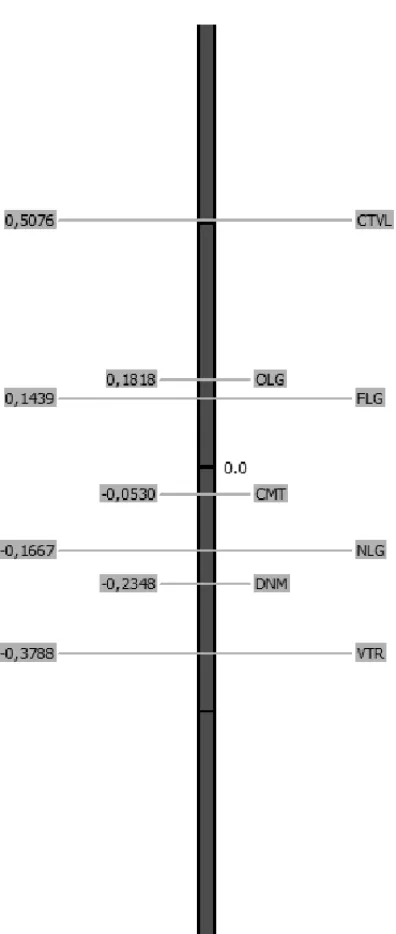
The results were expressed in Figure 3. On analyzing the results obtained, it is observed that haulier CTVL had the best performance in comparison with the other hauliers, followed by OLG and FLG. Then in descending order, come the suppliers CMT, NLG, DNM, and finally the haulier VTR.
With these results, the DM has information regarding the performance of hauliers that work with the Distribution Center and can take actions to intensify the relationship with the best hauliers, while looking for new suppliers of transport for the areas served by hauliers with the worst performance and, more importantly, can take measures to improve their performance.
The DM found the results very satisfactory. He was surprised, however, with the performance of haulier CMT, which meets most of the demand for vehicles and has an important history with the company. But it is pointed out that there are problems in that supplier’s performance, which justifies the result.
5.2.4 Sensitivity analysis
In order to assess the consistency of results achieved, the sensitivity analysis was conducted using the walking weights methods. The weight of each criterion, in turn, was increased by 15% and thus the overall importance of the others was reduced.
6 DISCUSSION
Figure 3– Representation of the PROMETHEE II results.
phases. In the first phase, an important analysis of the critical aspects of the various products or services is conducted. Thus, companies can obtain an overview of the impact that these have on their business results and this can be used when designing the company’s strategy. Therefore, the classification of products or services was proposed so that the company would then pay greater attention to those products/services that are the most critical ones for their results.
DM. Other methods can be used in the model, but the problem analysis demands a lot of infor-mation and the method to be used should facilitate the analysis. During the process of assigning weights, the DM understood the importance of weights for the results and sought to determine them in the most faithful way as to his preference structure At this point, the information that a certain alternative, which was assigned a weight 2x, is twice as important as another alternative, with weightx, facilitated the assignment process. There was no great difficulty with the other parameters of the methods used. The DM, in turn, always requested examples to understand the meaning of each parameter for both PROMSORT, and for PROMETHEE.
For the case described in this study, the DM proved to be very interested in the benefits that the application could yield with regard to results. Furthermore, it was pointed out that the DM understood the concepts involved in applying the methods.
The results somewhat surprised the manager as to the performance of some suppliers. These partners had an inferior performance when compared to the size of the share in outsourced ser-vices that they have. Thus, the DM stated that the results obtained will be used to draw up the company’s strategy, by increasing partnerships with those vendors with the best performance, while seeking while seeking to negotiate improvements from those whose performance was lower than expected and to seek new suppliers to fill the gaps detected in this study.
In particular, the situation of the carrier CMT was the most critical one for the DM. This was the only carrier when the distribution center began operations but, over the years, it had been losing share to other carriers that were emerging. In the past, CMT alone had transport for some regions, but the retailer is seeking to diversify the delivery destinations of the other hauliers to ensure its stores are supplied, especially in periods of high demand.
7 CONCLUSIONS AND FURTHER RESEARCH
The retail market is characterized by the strong competition between the various entities. There-fore, companies are increasingly reducing their profit margins, thus offering products at a lower price to their customers. This trend requires the efficiency of the retailer’s supply chain to be increased which requires a better relationship between the various agents in the supply chain.
Thus, it is important to consider how retailers select their suppliers. This paper proposed a model to address the problem of supplier selection, taking into account the DM’s preferences. It con-siders the strategic role that the product or service offered plays in the success of a supply chain.
The proposed model can be adapted to companies from different sectors and is applicable to both products and services. The model was applied to the distribution center of one of the largest retailers in Brazil.
In this paper, a model for supplier selection in a real situation was applied. In this context, the proposed model has been shown to be well suited to this case, providing an interesting tool for decision support in that environment. It was also observed that the methods used can be applied in real situations without the need for more resources, but rather all that is required is greater interaction with the decision maker. The application of the PROMETHEE method is given by software. Otherwise, the application of PROMSORT was undertaken without any software support, but was nevertheless conducted quite satisfactorily.
As to suggestions for future studies, investigations should be made of how the distribution centre could apply the proposed model to selecting suppliers of products and evaluating other service providers it uses, ranging from those assessed as most critical to those with less impact, where relevant. Furthermore, how the model could be extended to the stores should be examined as it is the stores which are the points of interface between the company and the customer, and they should seek partnerships with various service providers.
More generally, further studies should explore how the model proposed can be applied to compa-nies in other sectors, not only the retail one, thus leading to the same benefits that were observed to arise from compiling the model proposed in this study.
ACKNOWLEDGMENTS
This study is part of a research program funded by the Brazilian Research Council (CNPq).
REFERENCES
[1] ALENCARLH & ALMEIDAAT. 2010. A model for selecting project team members using multicri-teria group decision making.Pesqui. Oper.,30: 221–236.
[2] AGUEZZOUA & LADETP. 2007. A nonlinear multi-objective approach for the supplier selection, integrating transportation policies.J. Model. Manag.,2: 157–169.
[3] ARAZC & OZKARAHANI. 2007. Supplier evaluation and management system for strategic sourcing based on a new multicriteria sorting procedure.Int. J. of Prod Econ.,106: 585–606.
[4] BAIC & SARKISJ. 2007. Integrating sustainability into supplier selection with grey system and rough set methodologies.Int. J. Prod. Econ.,124: 252–264.
[5] BANSALM, KARIMIIA & SRINIVASANR. 2007. Optimal Contract Selection for the Global Supply and Distribution of Raw Materials.Ind. Eng. Chem. Res.,46: 6522–6539.
[6] BARKERT & ZABINSKYZB. 2011. A multicriteria decision making model for reverse logistics using Analytical Hierarchy Process.Omega,39: 558–573.
[7] BASNETC & WEINTRAUBA. 2009. A genetic algorithm for a bicriteria supplier selection problem.
Int. Trans. Oper. Res.,16: 173–187.
[8] BRANS JP & VINCKEP. 1985. A preference ranking organization method: The PROMETHEE method.Manag. Sci.,31: 647–656.
[10] CHANF & CHANHK. 2010. An AHP model for selection of suppliers in the fast changing fashion market.Int. J. of Adv. Manuf. Technol.,51: 1195–1207.
[11] CHENYM & HUANGP. 2007. Bi-negotiation integrated AHP in suppliers selection.Int. J. of Oper.
Prod. Manag.,27: 1254–1274.
[12] EL-SAWALHIN, EATOND & RUSTOMR. 2007. Contractor pre-qualification model:
State-of-the-art.Int. J. of Proj Manag.,25: 465–474.
[13] FERNANDEZE & NAVARROJ. 2011. A new approach to multi-criteria sorting based on fuzzy out-ranking relations: The THESEUS method.Euro. J. of Oper. Res.,213: 405–413.
[14] GENCERC & GURPINARD. 2007. Analytic network process in supplier selection: A case study in an electronic firm.Appl. Math. Model,31: 2475–2486.
[15] GOLMOHAMMADID ET AL. 2009. Supplier Selection based on a Neural Network Model Using Genetic Algorithm.Trans. on neural netw.,20: 1504–1519.
[16] GOMESLFAM, RANGELLAD & LEALJUNIORMR. 2011. Treatment of uncertainty through the interval smart/swing weighting method: a case study.Pesqui. Oper.,31(3): 467–485.
[17] HOW, XUX & DEYPK. 2010. Multi-criteria decision making approaches for supplier evaluation and selection: a literature review.Eur. J. of Oper. Res.,202: 16–24.
[18] ISHIZAKAA. 2012. Clusters and pivots for evaluating a large number of alternatives in AHP.Pesqui.
Oper.,32: 87–101.
[19] KAHRAMANC, CEBECIU & ULUKANZ. 2003. Multi-criteria supplier selection using Fuzzy AHP.
Logist Inf. Manag.,16: 382–394.
[20] KIRYTOPOULOSK, LEOPOULOSV & VOULGARIDOUD. 2008. Supplier selection in the pharma-ceutical industry: An analytic network process approach.Benchmark: An. Int. J.,15: 494–516.
[21] MANSINIR, SAVELSBERGM & TOCCHELLAB. 2012. The supplier selection problem with quantity discounts and truckload shipping.Omega,40: 445–455.
[22] ORDOOBADISM. 2009. Application of Taguchi loss functions for supplier selection.Supply Chain
Manag: An. Int. J.,14: 22–30.
[23] OSMANH & DEMIRLIK. 2010. A bilinear goal programming model and a modified Benders de-composition algorithm for supply chain reconfiguration and supplier selection.Int. J. of Prod. Econ., 124: 97–105.
[24] NARASIMHANR, TALLURIS & MAHAPATRASK. 2006. Multiproduct, Multicriteria Model for Supplier Selection with Product Life-Cycle Considerations.Decis. Sci.,37: 577–603.
[25] PUNNIYAMOORTHYM, MATHIYALAGANP & PARTHIBANP. 2011. A strategic model using struc-tural equation modeling and fuzzy logic in supplier selection.Expert Syst. with Appl.,38: 458–474.
[26] QINHET AL. 2012. The freight allocation problem with all-units quantity-based discount: A heuris-tic algorithm.Omega,40: 415–423.
[27] RAMANATHANR. 2007. Supplier selection problem: integrating DEA with the approaches of total cost of ownership and AHP.Supply Chain Manag.,12: 258–261.
[29] SAENRF. 2010. Developing a new data envelopment analysis methodology for supplier selection in the presence of both undesirable outputs and imprecise data.Int. J. Adv. Manuf. Technol., 51: 1243–1250.
[30] SAWIK T. 2010. Single vs. multiple objective supplier selection in a make-to-order environment.
Omega,38: 203–212.
[31] SCHRAMMF & MORAISDC. 2012. Decision support model for selecting and evaluating suppliers in the construction industry.Pesqui. Oper.,32(3): 643–662.
[32] TINGS & CHOD. 2008. An integrated approach for supplier selection and purchasing decisions.
Supply Chain Manag.,13: 116–127.
[33] VERDECHOMET AL. 2012. A multi-criteria approach for managing inter-enterprise collaborative relationships.Omega,40: 249–263.
[34] VINCKEP. 1992. Multicriteria decision aid. John Wiley and Sons, New York.
[35] VINODHS, RAMIYARA & GAUTHAMSG. 2011. Application of fuzzy analytic network process for supplier selection in a manufacturing organization.Expert Syst. Appl.,38: 272–280.
[36] WUDET AL. 2010. Fuzzy multi-objective programming for supplier selection and risk modeling: A possibility approach.Eur. J. Oper. Res.,200: 774–787.