(Perciformes, Scombridae) from the Northern and
Northeastern coast of Brazil
Santa Brígida, EL., Cunha, DB., Rego, PS., Sampaio, I., Schneider, H. and Vallinoto,M.*
Laboratório de Genética e Biologia Molecular, Instituto de Estudos Costeiros – IECOS,Campus de Bragança, Universidade Federal do Pará – UFPA, Alameda Leandro Ribeiro, sn, CEP 68600-000, Aldeia, Bragança, PA, Brazil
*e-mail: [email protected]
Received May 30, 2007 – Accepted August 30, 2007 – Distributed December 1, 2007 (With 3 figures)
Abstract
Scomberomorus cavalla is a pelagic fish species widely distributed on the Atlantic west coast, and a noticeable
de-crease in its capture level in the USA and Gulf of Mexico is occurring, compared to the levels reached by the species in the past. Likewise, in some areas of Brazil, there has been indication of over-harvesting. However, there are no mo-lecular studies focusing on the management of such an important item. Thus, in the present study, 380 nucleotide base pairs of the mitochondrial DNA D-Loop region of samples from Macapá, Bragança, and Fortaleza were sequenced. Phylogenetic and population analyses revealed that there is only one panmitic population, and low levels of genetic variability were verified. These results, as well as the noticed over-harvesting of S. cavalla, represent very important
data to determine the management of such stock in order to prevent a collapse or the risk of future extinction.
Keywords:Scomberomorus cavalla, D-loop, population analysis.
Análise populacional de
Scomberomorus cavalla
(Cuvier, 1829)
(Perciformes, Scombridae) da costa Norte e Nordeste brasileira
Resumo
Scomberomorus cavalla é uma espécie de peixe pelágico amplamente distribuído na costa oeste do Atlântico, e uma
diminuição no seu nível de captura tem sido verificada nos E.U.A e Golfo do México, comparada com os níveis al-cançados pela espécie no passado. Da mesma forma, em algumas áreas do Brasil, há indícios de sobre-exploração. Entretanto, não existem estudos moleculares que visam o manejo deste importante item. Desta forma, no presente estudo, foram seqüenciados 380 pares de bases nucleotídicas da região da Alça-D do DNA mitocondrial de amostras provenientes de desembarque em Macapá, Bragança e Fortaleza. As análises filogenéticas e populacionais revelaram que há apenas uma população panmítica e baixos níveis de variabilidade genética foram observados. Estes resultados, assim como a observada sobre-exploração de S. cavala, representam dados muito importantes para o estabelecimento do manejo deste estoque a fim de prevenir um colapso ou risco de extinção no futuro.
Palavras-chave:Scomberomorus cavalla, alça-D, análise populacional.
1. Introduction
Scomberomorus cavalla (Cuvier, 1829), commonly
known as cavalla or king mackerel, is a pelagic fish spe-cies widely distributed along the West Atlantic. It is dis-tributed from Massachusetts, USA, all the way to Santa Catarina State, in Brazil, and it is restricted to coastal waters closer to the ocean (Collete and Nauen, 1983; Cervigón et al., 1993; Fonteles-Filho, 1998; Carvalho-Filho, 1999). This species has a great importance for rec-reational and commercial fishing along the southwest-ern portion of the USA and Gulf of Mexico (Deuel and Clark, 1968; Deuel, 1973; Manooch, 1979).
Bragança (Pará State), and 24 from Fortaleza (Ceará State) (Figure 1). The samples from Macapá and Bragança were collected from fish unloaded as industrial catch, whereas the ones from Fortaleza came out of sub-sistence fishing catch.
2.2. DNA extraction, PCR amplifying and sequencing
Total DNA was extracted from muscle tissues of all samples using the standard method of phenol-chloroform, followed by precipitation by sodium acetate (Sambrook et al., 1989). The primers used for amplification of the D-loop mitochondrial DNA (mtDNA) region were de-signed for this study based on sequences of Perciformes obtained in the Genebank: L1 (5’-CCT AAC TCC CAA AGC TAG (GT) AT TC -3’) and H1 (5’-TGT TTA TCA CTG CTG (AG) (AG) T TCC CT -3’). The PCR was performed on a thermocycler using in each reaction, 10 ng of genome DNA, 10 nM Tris-HCI pH 8.85, 25 mM KCl, 5 mM (NH4)2SO4, 0.2 nM of dNTP, 5 pM of each primer, and 1 unit of Taq DNA polymerase (Invitrogen). The utilized program was composed of an initial cycle of 94 °C for 3 minutes, followed by 30 cycles of 94 °C for 1 minute, 50 °C for 1 minute, 72 °C for 1 minute, with a final extension period of 72 °C for 5 minute. A re-amplification was performed with the same reagent concentrations, as well as the same program, utilizing, however, the amplified DNA samples, the L1 primer, and another internal one, Perc 12S 1R (5’- GCG GAT ACT TGC ATG TGT AA -3’). Re-amplification products were then sequenced using the “dynamic dye terminator cycle sequencing” kit in the automated sequencer ABI 377, in accordance to the protocols supplied by the manufactur-For a long time, the northeastern region of Brazil
de-livered the highest output of S. cavalla and S. brasiliensis
Collette, Russo and Zavala-Camin, 1978(serra Spanish mackerel), whereas for the period of 1980-1984 the State of Ceará had the most outstanding deliveries in the country, with about 41% of the total fish unloaded (Fonteles-Filho, 1988). However, on the northern coast, the output has exceeded more than one half of that of the Northeast in the past five years, with approximately 52% of the country output. During the period of 1998 through 2004, there has been a decline in production from 12.6 to 6.6 thousand tons in the Northern (State of Pará), and in this latter year those species accounted for the third high-est exploited resource (7.4%) of all marine and high-estuary fish in the above mentioned region (CEPNOR/IBAMA, 2006).
There are clear signs of stock decline in the north-eastern region and, furthermore, those populations are probably close to the maximum limit of exploitation for a sustainable yield (Nóbrega, 2002). In other regions, such as in Mexico, Arreguín-Sanchez (1995) has re-ported indications of over-exploitation of S. cavalla,
al-though agencies in charge of fishing management do not currently assume such a status for this species as there are effective management policies for the region (Gold and De Vries, 2002).
Phylogeographical studies have been conducted on S. cavalla in the USA and Gulf of Mexico based on
migration, mark-and-recapture, and otolith shape analy-sis (Fable et al., 1987; Sutter et al., 1991; Schaefer and Fable, 1994), wherein results suggest that there is a stock in the southwest portion of the USA and another one in the Gulf (Johnson et al., 1993; Gold et al. 1997). However, microsatellite data (Broughton et al., 2002; Gold and De Vries, 2002) suggest that the population of the Florida Keys could not be assigned unequivocally to either genetic stock, and thus the data are not consist-ent with the currconsist-ent spatial-temporal barriers that are at-tributed by the management agencies (Gulf of Mexico Fishing Management Council-GMFMC). Yet, plans cur-rently implemented by GMFMC, under whose jurisdic-tion is also the fishing carried out in southwestern USA, still consider the two above referred stocks.
There is no study regarding the genetic variability of this important fishing item on the coast of South America and, given that there is indication of over-exploitation in the Northeast, as well as the reduced fishing of S. cavalla
and S. brasiliensis in Northern Brazil, the present study
aimed to investigate the genetic variability of S. cavalla
in these regions, through the analysis of the D-loop re-gion of the mitochondrial DNA.
2. Material and Methods
2.1. Sampling
A total of 64 samples of S. cavalla were collected
in three cities of the northern and northeastern coast of Brazil: 17 from Macapá (Amapá State), 23 from
Macapá Bragança
Fortaleza
–80°
Km
Km
0 200400
0°
–20°
–40°
–60° –50° –55° –60°
–10° –5° 0°
5° –45° –40° –35° –30°
–40°
0 1000
N
S
W E
ple presented haplotype and nucleotide diversities above 70% and 0.5%, respectively. However, analyses on the Bragança samples showed moderate haplotype diver-sity values (0.55) and low levels of nucleotide diversi-ties. Regarding the neutrality test, Fs values were not significant in any of the analyzed localities, except for the entire population and Fortaleza in which we found a negative and significant value.
Phylogenetic analysis (the selected model by Modeltest was the HKY85 + I + G – Base = (0.3100 0.1820 0.2214), Nst = 2, TRatio = 7.8242, Rates = gam-ma, Shape = 0.0001, Pinvar = 0.7565) obtained by the three utilized methods generated similar trees in which basically only one branch was supported in all analyses by values higher than 80% of bootstrap, while the other present low levels (Figure 2a). On such trees, the clade composed by haplotypes H_1, H_5, H_9 and H_12 is sister group of the clade made up by the remaining hap-lotypes. Genetic divergence among haplotypes using the Kimura two parameter algorithm varied between 0.3 and 2.1%; however, the divergence between the two haplo-type groups was of 1.4% (data not shown).
On the haplotype network (Figure 2b), two well repre-sented haplotypes were noticed (H_4 and H_6), whereas the other ones are singletons or shared by two individu-als (except H_3, shared by 5 individuindividu-als). Closer haplo-types are singled out by no more than two mutations. It is important to highlight that no separation in groups of ers (Applied Biosystems, Foster, CA, USA), utilizing
only the primer Perc 12S 1R (all the samples were se-quenced twice for variable sites confirmation).
2.3. Population analyses
Sequences were aligned using the CLUSTAL W program (Thompson et al., 1994) implemented in the BIOEDIT program (Hall, 1999). Deletions resulting from the alignment were handled as lost data and not included in the analyses.
Phylogenetic relationships among mitochondri-al haplotypes were obtained through PAUP* 4.0b10 (Swofford, 2002) using neighbor joining, maximum likelihood, and maximum parsimony methods. The pro-gram Modeltest 3.06 (Posada and Crandall, 1998) was used to select the best evolutionary model fitting the data set. The program Network 4.2 (Bandelt et al., 1999) was utilized for construction of the haplotype network. The genetic divergence within (intra haplotypes) and be-tween pairs of populations was calculated on Mega 3.1 (Kumar et al., 2004).
The genetic diversity, haplotype (h; Nei, 1987), and nucleotide diversities (π; Nei 1987) were calculated on Arlequin 3.1 (http://cmpg.unibe.ch/software/arlequin3) and on DNAsp 4.0 (Rozas et al., 2003). Pairwise genetic divergences between populations were estimated using the Fst (Excoffier et al., 1992) and the test significance was tested by 10,000 permutations. Partitioning of ge-netic variability among populations was tested using hierarchical analysis of molecular variance, AMOVA (Excoffier et al., 1992) implemented in Arlequin 3.01.
Inferences on demographic history of S. cavalla
samples were analyzed through mismatch distribution (Slatkin and Hudson, 1991; Rogers and Harpending, 1992). The result of the distribution was tested against the population growth-decline or constant population size model implemented on DNAsp 4.0 and Arlequin 3.1. The parameters θ0, θ1 (θ before and after population
growth), and τ (date of the growth in units of mutational time) (Schneider and Excoffier, 1999), as well as their confidence intervals were estimated on Arlequin 3.1. In addition, Fu’s Fs test (Fu, 1996, 1997) was carried out in order to ascertain possible neutrality deviations, as well as to infer population dynamics on Arlequin 3.1.
3. Results
Sequences of a total of 380 base pairs (bp) of the 3’ D-Loop region were obtained from 64 samples of S. cavalla of three different localities (Macapá,
Bragança, and Fortaleza). Twelve variable sites (only one transversion), seven parsimonious ones (not includ-ing deletions), and a total of 14 haplotypes were identi-fied (Table 1) (GenBank accession numbers: EU117391 – EU117404).
The genetic diversities and neutrality tests for the samples of the analyzed localities, as well as for the entire sample are presented on Table 2. It was ascer-tained that the Macapá, Fortaleza, and the entire
sam-Table 1. Variable nucleotide sites within a 380 bp amplified region of the mtDNA of Scomberomorus cavalla. BG means Bragança, MP Macapá, and FO Fortaleza.
Haplotypes Position/Sites Number of
samples
222222222222
122334566799 636494456015
H_1 GACTTCAGTAAC 2 (1 BG, 1 MP)
H_2 ..TC.T.ACGGG 1 (1 MP)
H_3 ..TC.T.A.GGG 5 (1 BG,
2 MP, 2 FO) H_4 ..TC.T.A.G.G 16 (4 BG,
8 MP, 4 FO) H_5 ...C... 1 (1 MP)
H_6 ..TC...A.G.G 31 (15 BG,
4 MP, 12 FO) H_7 .GTC.T.A. G.G 1 (1 MP)
H_8 ..TCCT.A.G.G 1 (1 BG)
H_9 ...T 1 (1 FO)
H_10 ..TC.T.A...G 1 (1 FO)
H_11 ..T..T.A.G.G 1 (1 FO)
H_12 ...G 1 (1 FO)
H_13 A.TC.T.A.G.G 1 (1 FO)
lies in the differences within each locality, that is, basi-cally, the existing variation that arises from the variability of each of the three sampled localities.
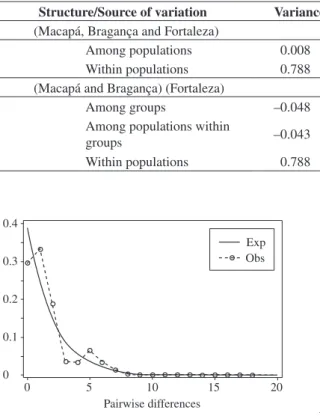
For the analysis of population demographic expan-sion, in accordance with prior data, only the entire data was utilized, and the graph of mismatch distribution shows a bimodal curve (Figure 3). The second observed mode, with low frequency, is a result of the most diver-gent samples composed by the haplotypes previously distinguished on the phylogenetic tree. In regards to the expansion parameters, values of θ0 and θ1 are not
statisti-cally different, which denies the population expansion hypothesis (data not shown).
4. Discussion
In the present study, according to the differentiation analyses of the samples, the non significant values of Fst show that there is an intense genetic flow among the ana-lyzed samples. This is confirmed by AMOVA, as well as by haplotype network and phylogenetic analyses, wherein there is no assemblage of haplogroups or clades bounded by regional localities. Besides the geographical distance among the states of Amapá, Pará, and Ceará, S. cavalla is a pelagic species that possesses high performance in lo-comotion, which provides it with a great migrating ability (Walters, 1962). Interestingly, the phylogenetic analyses, haplotype networks as well as mismatch distribution, evi-denced two haplogroups. This may be the result of haplo-type presence from other populations in the northern hemi-sphere (or other regions), by the extinction of intermediate haplotypes between the two groups, or simply that these intermediate haplotypes were not sampled.
Besides the moderate values of haplotype diversity and low values of nucleotide diversity found for the en-tire sample, it is interesting to note that the great majority of mutations correspond to transitions, which added up to the number of mutations among haplotypes (usually one single mutation differentiating them) may be char-acteristic of a relatively recent evolutionary process. According to Grant and Bowen (1998), high values of h (above 0.5) and low values of π (below 1%) arise on populations that have suffered a bottleneck followed by population growth and accumulation of mutations. Such a condition is attributed to expansion after a period of actual low population size (Avise et al., 1984; Rogers and Harpending, 1992). However, in spite of the negative geographic samples was noticed (Macapá, Bragança, and
Fortaleza), and that the most representative haplotypes are found in all three localities. This is reaffirmed by analy-ses of population differentiation, in which the values of Fst obtained for the localities were not significant (data not shown), as well as in the AMOVA (Table 3), since there is no structuring among the samples. Most of the variation
H_1
H_12 H_6 H_13
H_13
H_11
H_11 H_10
H_10 H_8
H_8 H_6
H_7
H_7
H_4
H_4
H_14
H_14
H_3
H_3
H_2
H_2 H_9 H_5
H_5 H_12
H_1 H_9 H_10
H_12 H_9 86/86/91
0.0030
mv1
mv2 2
a
b
Figure 2. a) Maximum likelihood tree (–ln L = –620.322) with bootstrap values (maximum parsimony/likelihood/ neighbor joining); and b) Median-joining haplotype net-work. The haplotypes are represented by circles, with the width proportional to their frequencies. Each branch cor-responds to a single mutation, except between the median vectors (mv1 and 2), which possess two mutations (repre-sented in this branch). Black circles correspond to Bragança samples, white to Macapá, and gray to Fortaleza.
Table 2. Haplotype diversity, nucleotide diversity, and the neutrality test (Fs) of the analyzed Scomberomorus cavalla populations.
Populations n NH h π Fs
Macapá 17 7 0.794 ± 0.783 0.005 ± 0.004 –1.52
Bragança 23 5 0.545 ± 0.104 0.003 ± 0.002 –0.808
Fortaleza 24 9 0.735 ± 0.087 0.005 ± 0.003 –3.28*
Total 64 14 0.704 ± 0.0469 0.005 ± 0.004 –6.72**
and low nucleotide diversity. Such results ought to be taken into consideration in future management plans, since such a level of variability may compromise popu-lation stock in the future, which has already been sug-gested to be undergoing an overfishing status (Nóbrega, 2002). Future management actions for the northern and northeastern regions are evidenced as necessary in or-der to prevent this “over-exploitation”. Lack of action for a sustainable management of S. cavalla fishing, as
occurred in other countries, may impact the stocks and compromise their evolutionary potential.
Acknowledgments — This study was supported by CNPq-PADCT/MCT (Millenium Project, grant N. 62.0052/01-5) and CT-Hidro/CNPq (N. 0552621/2005-5).
References
ARREGUÍN-SÁNCHEZ, S., 1995. Population dynamics of the king (Scomberomorus cavalla) of Campeche Bank, Mexico. Sci. Mar., vol. 59, no. 3-4, p. 637-645.
AVISE, JC., NEIGEL, JE. and ARNOLD, J., 1984. Demographic influences on mitochondrial DNA lineage survivorship in animal populations. J. Mol. Evol., vol. 20, no. 20, p. 99-105.
BANDELT, HJ., FORSTER, P. and ROHL, A., 1999. Median-joining networks for inferring intraspecific phylogenies. Mol. Biol. Evol., vol. 16, no. 1, p. 37-48.
BROUGHTON, RE., STEWART, LB. and GOLD, JR., 2002. Microsatellite variation suggests substantial gene flow between king mackerel (Scomberomorus cavalla) in the western Atlantic Ocean and Gulf of Mexico. Fish. Res., vol. 54, no. 3, p. 305-316
CARVALHO-FILHO, A., 1999. Peixes: costa brasileira. 3ª edição. São Paulo, Editora Melro, 320p.
CEPNOR/IBAMA - Centro de Pesquisa e Gestão de Recursos Pesqueiros do Litoral Norte, 2006. www.ibama.gov.br/cepnor/ index.php?id_menu=52 [Access: January 23, 2006].
CERVIGÓN, F., CAPRIANI, F., FISCHER, W., GARIBALDI, L., HENDRICKX, M., LEMUS, AJ., MÁRQUEZ, R., POUTIERS, JM., ROBAINA, G. and Rodriguez, B., 1993. Field Guide to the Commercial marine and Brackish-water Resources of the Northern Coast of South America. FAO species identification sheets for fishery purpose. Rome FAO, 513p. COLLETE, BB. and NAUEN, CE., 1983. Scombrids of the world. FAO. Fish Sinopses, vol. 125, no. 2, p. 1-37
value of Fs, the values of θ0 and θ1 are not statistically
different, that is, the effective population size before and after a possible expansion do not differ, thus denying the demographic expansion hypothesis.
These results also could indicate that the entire sam-ple is undergoing some other type of evolutionary proc-ess, deviating from the neutral model of molecular evolu-tion, such as hitchhiking or selection. However, although models point towards such processes, interpretation of the results may become confounding due to the com-plexity of evolution events acting upon the evolutionary time scale (Tajima, 1989). That is, different processes may leave the same markers in DNA sequences.
As there are instances of over-exploitation of
S. cavalla stocks in the Brazilian territory (Nóbrega,
2002), the data herein may indeed be indicative of over-fishing. The fact that the entire sample bears a moder-ate value of haplotype diversity may be explained by the condition that in a bottleneck process usually the impact will be greater on the allelic diversity (only 14 alleles were found) than over the heterozygosity (or heterogene-ity) (Frankham et al., 2004).
The obtained results in this study show that the ana-lyzed samples represent a single panmitic population, which presents moderate values of haplotype diversity Figure 3. Mismatch distribution of the 64 mtDNA D-loop sequences of S. cavalla under a constant population size model (expected values). Exp and Obs means expected and observed values, respectively.
Table 3. Results of AMOVA with different population structures.
Structure/Source of variation Variance % of variation F statistics P value
(Macapá, Bragança and Fortaleza)
Among populations 0.008 1.02 Fst = 0.01 > 0.05 Within populations 0.788 98.98
(Macapá and Bragança) (Fortaleza)
Among groups –0.048 –6.24 Fct = –0.06
> 0.05 Among populations within
groups –0.043 –5.48 Fsc = 0.05
Within populations 0.788 100.77 Fst = –0.01
0.4
0.3
0.2
0.1
0
0 5 10 15 20
Pairwise differences
DEUEL, DG., 1973. The 1970 salt-water angling survey. U.S. Department of Commerce, National Marine Fisheries Service, Curent Fishery Statistics Number, vol. 6200, 54p.
DEUEL, DG. and CLARK, JR., 1968. The 1965 salt-water angling survey. U.S. Department of the Interior, Fish and Wildlife Service, Resource Publication vol. 67, 51p.
EXCOFFIER, L., SMOUSE, PE. and QUATTRO, JM., 1992. Analysis of molecular variance inferred from metric distances among DNA haplotypes: application to human mitochondrial DNA restriction data. Genetics, vol. 131, no. 2, p. 479-491. FABLE, WA., TRENT, GW. and ELLSWORTH, SW., 1987. Movements of king mackerel, Scomberomorus cavalla, tagged in southeast Louisiana, 1983-1985. Mar. Fish. Ver., vol. 49, no. 2, p. 98-101.
FONTELES-FILHO, A., 1988. Sinopse de informações sobre a cavala, Scomberomorus cavalla (Cuvier) e a serra, S. brasiliensis Collette, Russo and Zavalla-Camim (Pisces: Scomberomorus) no estado do Ceará, Brasil. Arq. Ciên. Mar, vol. 27, p. 21-48. FRANKHAM, R., BALLOU, J., BRISCOE, D. and MCINNES, KH., 2004. A primer of conservation genetics. Cambridge, Cambridge University Press, 617p.
FU, YX., 1996. New statistical tests of neutrality for DNA samples from a population. Genetics, vol. 143, no. 1, p. 557-570.
-, 1997. Statistical tests of neutrality of mutations against population growth, hitchhiking and background selection. Genetics, vol. 147, no. 2, p. 915-925.
GOLD, JR., PAK, E. and DE VRIES, DA., 2002. Population structure of king mackerel (Scomberomorus cavalla) around Peninsular Florida, as revealed by microssatelite DNA. Fish. Bull., vol. 100, no. 3, p. 491-509.
GOLD, JR., KRISTMUNDSDÓHIR, AY. and RICHARDSON, LR., 1997. Mitochondrial DNA variation in king mackerel (Scomberomorus cavalla) from the western Atlantic Ocean and Gulf of Mexico. Mar. Bio., vol. 129, no. 2, p. 221-232. GRANT, WS. and BOWEN, BW., 1998. Shallow population histories in deep evolutionary lineages of marine fishes: Insights from sardines and anchovies and lessons for conservation. J. Hered., vol. 89, no.5, p. 415–426.
HALL, TA., 1999. BioEdit: a user-friendly biological sequence alignment editor and analysis program for Windows 95/98/NT. Nucl. Acids. Symp. Ser., vol. 41, p. 95-98.
JOHNSON, AG., FABLE JR., WA., GRIMES, CB. and TRENT, L., 1993. Evidence for distinct stocks of king mackerel, Scomberomorus cavalla in the Gulf of Mexico. Fish. Bull., vol. 92, no. 1, p. 92-101.
KUMAR, S., TAMURA, K. and NEI, M., 2004. Mega3: Integrated Software for Molecular Evolutionary Genetics Analysis and Sequence Alignment. Bioinformatics, vol. 5, no. 2 p. 150-163.
MANOOCH III, CS., 1979. Recreational and commercial fisheries for king mackerel, Scomberomorus cavalla, in the South Atlantic Bight and Gulf of Mexico, USA. In Proceedings of the
Colloquium on the Spanish and King Mackerel Resources of the Gulf of Mexico. Edited by NAKAMURA, EL. and BULLIS, Jr. HR. Publ. Gulf States Mar. Fish. Comm., vol. 4, p. 33-41 NEI, M., 1987. Molecular Evolutionary Genetics. New York, USA, Columbia University Press, 512p.
NÓBREGA, FM., 2002. Idade, crescimento e avaliação de estoques da serra Scomberomorus brasiliensis (Teleostei: Scombridae), na plataforma continental do nordeste do Brasil. (Dissertação de Mestrado) – Universidade Federal Pernambuco, Recife, PE.
POSADA, D. and CRANDALL, KA., 1998. MODELTEST: testing the model of DNA substitution. Bioinf., vol. 14, no. 9, p. 817-818.
ROGERS, AR. and HARPENDING, H., 1992. Population growth makes waves in the distribution of pairwise genetic differences. Mol. Biol. Evol., vol. 9, no. 3, p. 552-569. ROZAS, J., SÁNCHEZ-DELBARRIO, JC., MESSEGUER, X. and ROZAS, R., 2003. DnaSP: DNA polymorphism analyses by the coalescent and other methods. Bioinformatics, vol. 19, no. 18, p. 2496-2497.
SAMBROOK, J., FRITSCH, EF. AND MANIATIS, T., 1989. Molecular cloning: a laboratory manual. 2nd. ed. Cold Spring Harbor Laboratory, New York, Could Spring Harbor Laboratory Press, 1659p.
SCHAEFER, HC. and FABLE JR., WA., 1994. King mackerel, Scomberomorus cavalla, mark-recapture studies off Florida’s east coast. Mar. Fish. Rev., vol. 56, no. 3, p. 13-23.
SCHNEIDER, S. and EXCOFFIER, L., 1999. Estimation of past demographic parameters from the distribution of pairwise distances when the mutation rates vary among sites: application to human mitochondrial DNA. Genetics, vol. 152, no. 3, p. 1079-1089.
SLATKIN, M. and HUDSON, RR., 1991. Pairwise comparisons of mitochondrial-DNA sequences in stable and exponentially growing populations. Genetics, vol. 129, no. 2, p. 555-562. SUTTER, FC., WILLIAMS, RO. and GODCHARLES, MF., 1991. Movement patterns of stock affinities of king mackerel in the southeastern United States. Fish. Bull., vol. 89, no. 2, p. 315-324.
SWOFFORD, DL., 2002. PAUP: Phylogenetic Analysis Using Parsimony and other Methods Version 4. Sundeland, Massachusetts: Sinauer Associates, Inc. Publisher.
TAJIMA, F., 1989, Statistical method for testing the neutral mutation hypothesis by DNA Polymorphism. Genetics, vol. 123, no. 3, p. 585-595.
THOMPSON, JD., HIGGINS, DG. and GIBSON, TJ., 1994. Clustal W: improving the sensitivity of progressive multiple sequence alignment through sequence weighting, position-specific gap penalties and weight matrix choice. Nucleic Acids Res., vol. 22, no. 22, p. 4673-4680.