DYNAMIC SYSTEMS APPROACH TO ASSESS AND
MANAGE WATER RESOURCES IN RIVER BASINS
Rodrigo Máximo Sánchez-Román1; Marcos Vinicius Folegatti2*; Alba María Guadalupe Orellana González3; Rogério Teixeira da Silva1
1
USP/ESALQ - Programa de Pós-Graduação em Irrigação e Drenagem. 2
USP/ESALQ - Depto. de Engenharia Rural, C.P. 9 - 13418-900 - Piracicaba, SP - Brasil. 3
USP/ESALQ - Programa de Pós-Graduação em Ecologia Aplicada-Interunidades. *Corresponding author <[email protected]>
ABSTRACT:The Piracicaba, Capivari and Jundiaí River Basins (RB-PCJ) are located in the States of Minas Gerais and São Paulo, Brazil. By 2005, 5.8% of Brazil’s General National Product-GNP was produced there. Such economic development has created a huge demand for water resources. The availability of water resources was assessed by running a dynamic systems simulation model to manage these resources in the RB-PCJ (WRM-PCJ), considering five 50-year simulations. WRM-PCJ was developed as a tool to aid the RB-PCJ Watershed Committee. The model computes water supply, demands, and contamination load from several consumers. When considering a Business-as-Usual scenario, by 2054, water demands will have increased up to 76%, 39% of the available water will come from wastewater reuse, and the contamination load will have increased by 91%. The Falkenmark Index started at 1403 m3 person–1 year–1 in 2004, ending at 734 m3 P–1 yr–1 in 2054; the Xu Sustainability Index started at 0.44 and ended at 0.20; and Keller’s River Basin Development Phases started as Phase II, and ended at final Phase III, of Augmentation. The three criteria used to evaluate water resources showed that RB-PCJ is at a crucial management turning point. The WRM-PCJ performed well, and proved to be an excellent tool to assess water resources availability.
Key words: water stress, water management, watershed, modeling
APROXIMAÇÃO USANDO DINÂMICA DE SISTEMAS PARA
ESTIMAR E MANEJAR OS RECURSOS HÍDRICOS EM
BACIAS HIDROGRÁFICAS
RESUMO:As Bacias Hidrográficas dos Rios Piracicaba, Capivari e Jundiaí (BH-PCJ) estão localizadas, nos Estados de Minas Gerais e São Paulo, Brasil. Em 2005 produziu 5.8% do PIB brasileiro. Este desenvolvimento econômico demanda grandes volumes de água. Com o Modelo para a Gestão dos Recursos Hídricos das BH-PCJ (MRH-PCJ), desenvolvido em dinâmica de sistemas, cinco cenários para 50 anos foram simulados. O MRH-PCJ foi desenvolvido para ser uma ferramenta de gestão do Comitê de Bacia Hidrográfica. O modelo estima a oferta e demandas de água, e a carga contaminante dos diversos consumidores. No cenário Business as Usual, para 2054, as demandas de água incrementaram em 76%, 39% da água disponível terá origem em águas de reuso, e a carga contaminante incrementará 91%. O Índice de Falkenmark, que em 2004 era de 1403 m3 pessoa–1 ano–1, será 734 m3 P–1 ano–1
em 2054; o Índice de Sustentabilidade de Xu iniciou em 0.44 e chegou até 0.20; quando consideradas as Fases de Desenvolvimento das Bacias Hidrográficas, propostas por Keller, iniciou-se na Fainiciou-se II, e terminou-iniciou-se na Fainiciou-se III, de Aumento. Os três critérios utilizados para avaliar os recursos hídricos mostraram que as BH-PCJ encontram-se num ponto de tomada de decisões importante. O MRH-PCJ mostrou-se uma excelente ferramenta para avaliar a disponibilidade de recursos hídricos. Palavras-chave: estresse hídrico, manejo de água, bacia hidrográfica, modelagem
INTRODUCTION
There are many perspectives, interests, perceptions, and alternatives for the use of water resources due to the diversity, positions, incomes, priorities, and loca-tions of the people involved. However, the management of water resources should be associated with
Turton, 1999). The basic principle of any systemic study is connectivity. A system is a set of elements with connections between each other. Any system is composed of subsystems, each being autonomous and open, directly interrelated and integrated with its envi-ronment (Santos, 1982).
The systemic approach is used in water resources management to analyze and improve water resources systems knowing that they are part of a dynamic and complex system, where many activities and exploita-tions coexist and interact. Each of these will require inputs (labor, power, capital etc.), and will produce outputs (agricultural and industrial goods and contami-nants, residues etc.) (Costa, 1993).
Three watersheds form the Piracicaba, Capivari and Jundaí river basins (RB-PCJ), supplying water to 9% of Brazil’s population in 0.18% of the Brazilian terri-tory, producing 5.8% of Brazil’s General National Prod-uct-GNP (IBGE, 2007). Water supply and demand, sustainability and environmental contamination are im-portant issues to be studied here. However, water re-sources sustainability should be linked to the users’ capacity to conserve or increase life quality, maintain-ing and ensurmaintain-ing the resources for future generations (Turton, 1999). Ergo: Until when is it possible to main-tain the productive activities, and satisfy population’s growing demands without harming the sustainability of water resources? At what level of river basin devel-opment is the RB-PCJ?
MATERIAL AND METHODS
Characterization of the Study Area
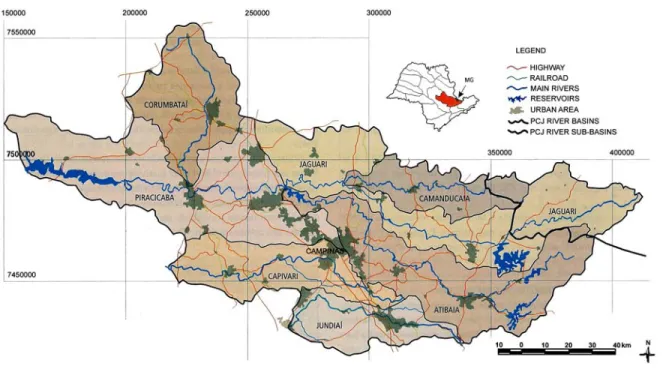
Three watersheds form the RB-PCJ system, re-ferred to as Water Resources Management Unit 5 (UGRHI-5), covering 64 municipal districts: 60 belong-ing to the State of São Paulo and four to the State of Minas Gerais (PERH, 2005). The RB-PCJ has a total area of 15,414 km2.
The three rivers (Figure 1) flow toward the Tietê River and belong to the Tietê River Basin. The esti-mated population at UGRHI-5 in 2004 was 4434937 inhabitants in the urban area and 223998 inhabitants in the rural area (PERH, 2005). The main economic activities include manufacturing, agriculture, agro-in-dustry, mining, recreation and landscaping, trading and services.
Evolution of Water Resources Management in the Piracicaba, Capivari and Jundiaí Watersheds
The state of São Paulo had been involved restruc-turing the water resources system since 1983. In 1986 the discussion began on the usefulness of looking at water resources from multiple aspects, causing an in-stitutional and technical debate. The debate thus began to develop, and the resulting participation made 1987 a landmark year in the modernization of the water re-sources sector, as examples: Carta de Salvador (ABRH, 2008) and Decree No. 27576 (Comitê PCJ, 2008).
In 1989, in another pioneering initiative, several towns within the Piracicaba and Capivari river basins joined efforts to form the Inter-municipal Consortium of the Piracicaba and Capivari Watersheds, with the idea of encouraging, not only the environmental reha-bilitation of the rivers, but establishing a regional inte-gration and a development plan for the river basins. This initiative consolidated a new vision among local governments increasing the participation of the civil society in the water resources decision-making pro-cess. In 1993, the state of São Paulo established a col-legial committee, Piracicaba, Capivari and Jundiaí River Basins Committees.
In 1997 Brazil faces the challenge of solving in-creasing water demands for urban, industrial and ag-ricultural growth, potential conflicts generated by the supply versus demand status, and the advance of eco-system degradation implementing Law 9433/97, which defines water as a good in the public domain, with its economic value, and priority uses for human and live-stock consumption, and whose management is based on the watershed as a territorial unit. Its overall guide-line is an integrated management, and the instruments they are to use in implementing the water resources plans, classifying bodies of water according to their main uses, the concession of water rights, water charges, public participation and the water resources information system. In this way, National Water Re-sources Policy was defined and the National Water Resources Management System created. In 2000, Law 9984 created the National Water Agency (ANA).
Consumers’ water demand
Water demands were defined based on in situ
stud-ies of water consumption habits in the area. All infor-mation was collected and presented in several Water Resources State Plans, or came from many second-ary information sources linked to agencies that sup-port productive sectors, or from the water resources administration (DAEE, 2007; IBGE, 2007; IEA, 2007; INMET, 2007; INPE, 2007; IPEA, 2007; SIRGH, 2007; SAA-SP, 2007; PERH, 2005; UNICA, 2007).
In order to be effective and precise when model-ing irrigated agriculture and animal breedmodel-ing, it is nec-essary to have a detailed knowledge of water use con-sumption and wastewater generation. To accomplish that, it is necessary to conduct a water user census, with detailed information on water habits. The lack of information on these topics creates some uncertain-ties during the simulations.
In relation to ecological flow, several methodolo-gies were considered to define a value for the simula-tions. To be on the safe side, it was decided that the smallest value that could be computed would be used;
this consideration was based on the fact that the eco-logical flow value should be a decision made at the Piracicaba, Capivari and Jundiaí River Basins Commit-tee (RBC-PCJ). A French method for existing water systems uses a value equal to 1/40 of the average daily flow (Souchon & Keith, 2001). According to PERH (2005), the average daily flow for the RB-PCJ is 64 m3 s–1; therefore, the ecological flow used during the
WRM-PCJ runs was 1.6 m3 s–1.
Relationship Between Dynamic Systems and Wa-ter Resources
The Dynamic Systems (DS) methodology is based on and derived from the Theory of Control developed by Forrester (1961). The fundamental principle of this methodology is that every dynamic behavior is a con-sequence of the system structure (Powersim, 1996). It is characterized by changes occurring along time.
DS simulation models are real-world abstract de-scriptions. They allow the modeler to represent com-plex problems characterized by its dynamics, non-lin-earity, feedback relationships, and discrepancies in time and space (Wiazowski et al., 1999). A DS model should capture only the essential factors of a real system, dis-regarding all other factors. The main use of the models is to communicate a point of view of the world on spe-cific problems; they do not try to be the reality, but to be as close as possible to it, and predict its behavior (Pérez Maqueo et al., 2006). The user should always be conscious of the model limitations he/she is using.
When focusing on a problem, there are several ways by which simulation models can be used. The objectives that guided the dynamic systems simulation model to manage water resources at the RB-PCJ (WRM-PCJ) construction defined the structure. Con-sidering this, and based on other countries’ experiences and other watershed development trends, a DS simu-lation model was developed and run in order to define the RB-PCJ developmental stage to date, and assess the availability of water resources and agriculture sustainability for the next 50 years.
To analyze the sustainability impact of water re-sources due to water supply and demand, WRM-PCJ uses: the Sustainability Index (Xu et al., 2002), which defines the relationship between total consumption and total available water; and the Falkenmark Index (Falkenmark, 1989; Falkenmark et al., 2007) which relates use-to-availability (Level of exploitation) and the number of people that have to share a unit of water (water shortage).
Water Resources Systems Structures
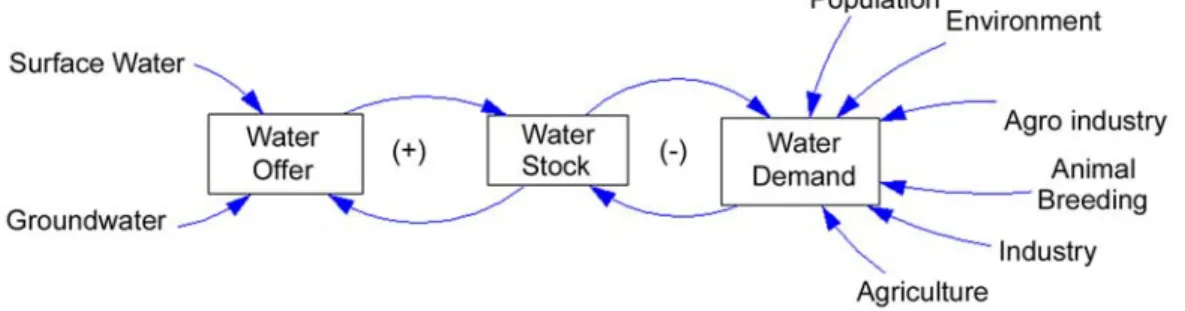
Figure 2 is the causal diagram for the water re-sources system structure that was modeled to analyze the water resources sustainability in the study area, the RB-PCJ. The Water Supply variables are: surface wa-ter and groundwawa-ter; both variables warrant the Wa-ter Stock from where waWa-ter is drawn by consumers. Water Demand is the sum of all water demands from the population, environment, agro-industry, animal breeding, manufacturing, and agriculture.
Water Resources Model for the Piracicaba, Capivari and Jundiaí River Basins (WRM-PCJ)
WRM-PCJ is an explicit dynamic simulation model developed to simulate the RB-PCJ water resource sys-tem. The WRM-PCJ has 254 variables in 11 sectors; these sectors can be grouped into: demand, supply, and specific computations. The demand sectors are: Agri-culture, Animal Breeding, Agro-industry, Environment, Population, and Manufacturing. The Supply Sector pro-vides surface water and groundwater as a product of annual precipitation; precipitation is thus a variable that can change annually. The Computation Sector com-prises: Volume of Returned Wastewater, Total Water Demand, Water Allocation Incomes, and Equivalent Population.
The water balance equation (1) and the total de-mand equation (2) for the RB-PCJ, expressed as dif-ferential equations in WRM-PCJ are:
WaterBalan(t) = WaterBalan(t - dt) + (SUPPLY
-WaterVolRunoff_RB-PCJ
- TotalWaterDemand_PCJ) * dt (1)
TotalWaterDemand_PCJ = VTRAG + VTRAI + VTRamb + VTRInd + VTRpop + VTRPEC +
(RMSP_Demand * 86400 * 365) (2)
where: WaterBalan(t): Water balance for year t (m3
year–1); SUPPLY: Water Supply for year
t (m3 year–1);
WaterVolRunoff_RB-PCJ: Water Volume that runs off the Piracicaba, Capivari and Jundiaí Watershed Ba-sin (m3 year–1); TotalWaterDemand_PCJ: Total Water
Demand by consumers at the Piracicaba, Capivari and Jundiaí Watershed Basin (m3 year–1); VTRAG: Total
Water Volume demanded by the agriculture sector (m3
year–1); VTRAI: Total Water Volume demanded by the
agro-industry sector (m3 year–1); VTRamb: Total
Wa-ter Volume demanded as ecological flow (m3 year–1);
VTRInd: Total Water Volume demanded by the manu-facturing sector (m3 year–1); VTRpop: Total Water
Volume demanded by the rural and urban population (m3 year–1); VTRPEC: Total Water Volume demanded
by the animal breeding sector (m3 year–1);
RMSP_Demand: Total Water Volume diverted to sup-ply water to the São Paulo Metropolitan Area (m3
year–1).
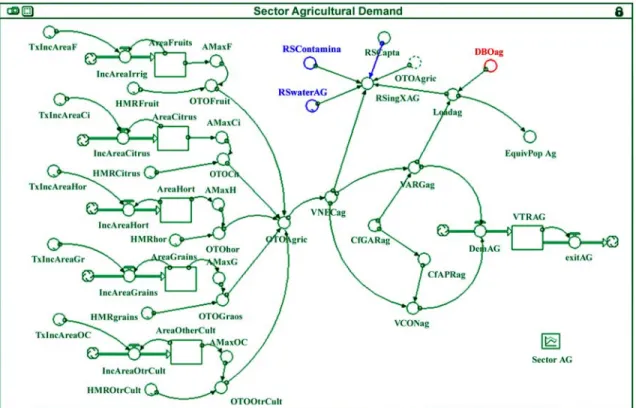
Figure 3 represents the structure of the water re-sources system linked to the Agriculture Sector in the study area as proposed in WRM-PCJ. The variable representing irrigation is HMRxi (L s–1 ha–1), the
irri-gated areas are Areaxi (ha), and Total Volume De-manded by Agriculture is VTRAGi (m3 year–1);
i
rep-resents the year and x the annual value for each crop.
The required water volume takes into consideration the crop’s net demand plus irrigation system ineffi-ciencies. Agriculture was modeled in five groups, rep-resenting a total of 60 different irrigated crops grown in the RB-PCJ.
Figure 4 represents the water resources supply structure linked to the Water Supply Section in the study area as proposed in WRM-PCJ.
The water supply variable is SUPPLY (106 m3 year–1
= Mm3 year–1), representing precipitation volumes that
became runoff volume (VolRunoff) or percolated and infiltrated volume annually (VolInf); additionally, return
Figure 4 - Water Supply Sector represented by the Water Resources Model for the Piracicaba, Capivari and Jundiaí River Basins (WRM-PCJ).
Figure 3 - Agricultural Sector represented by the Water Resources Model for the Piracicaba, Capivari and Jundiaí River Basins (WRM-PCJ).
waters (VolARetorn) are also accounted as water sup-ply. All these volumes are expressed as Mm3 year–1.
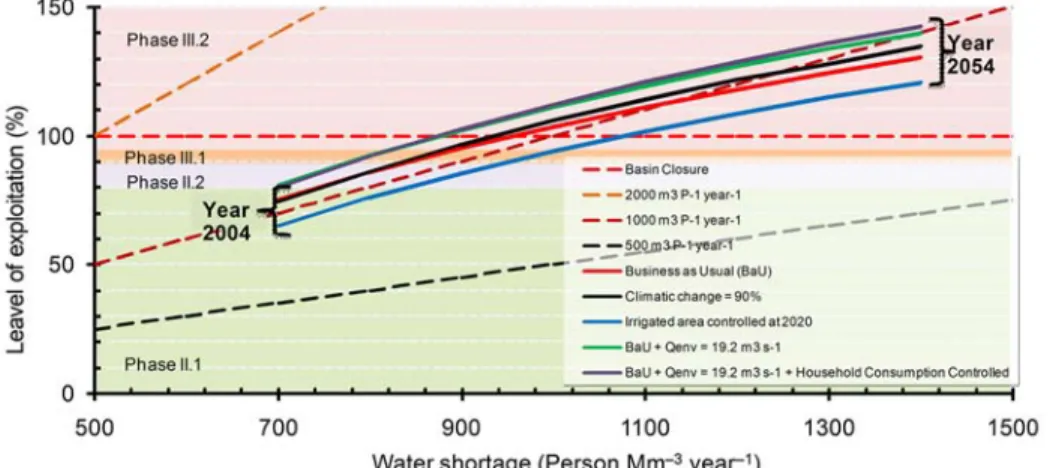
The use-to-availability (Use2Av) parameter is also known as Water Resources Vulnerability Index by Raskin et al. (1997), and is used in the graphic pro-posed by Falkenmark et al. (2007) as the y axis in Fig-ure 6.
Simulation stage: application of the dynamics simulation model
year–1 (IRRIGART, 2004), throughout the simulation.
Scenario 2 considers a 10% reduction in precipitation due to climatic changes, without variation in all other variables. Scenario 3 considers that the total irrigated area will stop growing by the year 2020, without varia-tion in all other variables. Scenario 4 considers the same conditions as in scenario 1 except for ecologi-cal flow, which is here equal to 19.2 m3 s–1. Scenario
5 considers the conditions established in scenario 4 and changes in population water demand habits as shown in Figure 5 (Table 1). According to RB-PCJ Plan (PBH, 2006) urban water consumption in the RB-PCJ is around 400 L person–1 day–1, while for EU countries
urban water consumption is less than 270 L person–1
day–1 (UNEP, 2007).
RESULTS AND DISCUSSION
For a 50-year simulation period (Table 2), consid-ering a BaU scenario for the RB-PCJ, there was an ≈76% increase in total water demand. Under the BaU scenario, in 2004 the total demand represented ≈74% of the total available water volume without consider-ing the reuse of waters; in 2007 it goes up to ≈82%, and for 2024 it is expected that the RB-PCJ will be-come a closed basin for two years (Figure 6). House-hold water consumption changes were foreseen by PERH (2005), and would produce a change in water demand conditions for about six years in the basin; however, by 2032 the basin would be closed again, this time on a permanent basis. From this point
for-ward, reused water will be the only available water source to supply new consumers. These waters will represent ≈39% of the available water by 2054. The other four scenarios showed the same tendency to-ward a closed watershed situation before the end of the simulation time frame.
New wastewater treatment plant stations should be built, since it is expected that the total load will in-crease by up to ≈93% by 2054 when considering the BaU scenario. For this scenario in the 50-year simula-tion time frame, water demands will increase up to ≈24% by 2030 when compared against demands in 2004, and ≈31% of the available water volume will come from wastewater reuse, whereas ≈98% of all available water resources will be used. The total con-tamination load by 2030 was estimated to increase by up to ≈39%. By 2054, conditions will be more stress-ful considering that water demand will have increased by up to ≈76% when compared with 2004; ≈39% of the available water volume will come from wastewa-ter reuse. The total wawastewa-ter resources demand will rise by up to ≈131% of the available volume. Meanwhile, the contamination load will have increased by up to ≈91% when compared with 2004.
Wastewater reuse will increase water supply, but the water volume required to ensure water dilution and
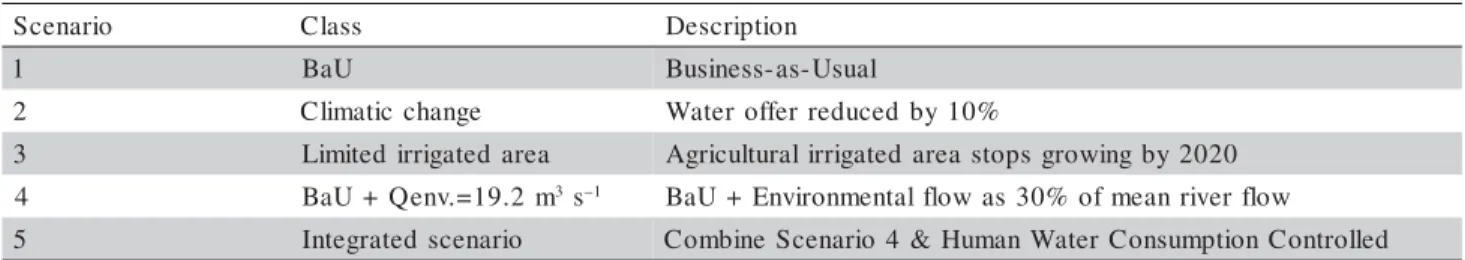
Table 1 - Proposed and evaluated scenarios using the Water Resources Model for the Piracicaba, Capivari, and Jundiaí River Basins (WRM-PCJ) in a 50-year time frame.
o i r a n e c
S Class Description
1 BaU Business-as-Usual
2 Climatic change Wateroffer reducedby10%
3 Limited irrigatedarea Agriculturalirrigatedarea stops growingby2020
4 BaU+Qenv.=19.2m3s–1 BaU+Environmentalflowas30%ofmeanriver flow
5 Integratedscenario CombineScenario4&HumanWaterConsumptionControlled
0 50 100 150 200 250 300 350 400 450 500
2004 2014 2024 2034 2044 2054
W
a
te
r
C
o
n
s
u
m
p
ti
o
n
(L
p
e
rs
o
n
–1
da
y
–1
)
Year
Urban Water Consumption Rural Water Consumption
Figure 6 - Use-to-availability for the Piracicaba, Capivari and Jundiaí River Basins estimated using the Water Resources Model (WRM-PCJ) for the Piracicaba, Capivari and Jundiaí River Basins under five scenarios and a 50-year time frame simulation.
40 60 80 100 120 140 160
2000 2010 2020 2030 2040 2050 2060
U
s
e
-to
-a
v
a
il
a
b
il
ity
(%
)
Year
Climatic Change = 90% mean precipitation Irrigated Area Controlled by 2020 BaU + Qenvironmental
BaU+ Qenv+Human Consumption Controlled Business as Usual (BaU)
Watershed closure
r a e
Y Supply TotalDemand Balance
-- 106m3year–1--------------
-4 0 0
2 8734 4865 3869
7 0 0
2 8900 5350 3551
0 1 0
2 9182 5488 3693
0 2 0
2 9653 6279 3375
0 3 0
2 9563 6394 3169
0 4 0
2 10017 7216 2801
0 5 0
2 10539 8164 2375
4 5 0
2 10769 8583 2186
Table 2 - Supply, Total Demand and Balance simulated using the Water Resources Model for the Piracicaba, Capivari and Jundiaí River Basins (WRM-PCJ) in a 50-year time frame under the BaU scenario.
) % ( n o i t a t i o l p x e f o l e v e L ' s o i r a n e c S e g a t r o h s r e t a W m n o s r e P
( –3year–1)
l a u s U s a s s e n i s u B ) U a B ( = e g n a h c c i t a m i l C n a e M % 0 9 n o i t a t i p i c e r P a e r a d e t a g i r r I t a d e l l o r t n o c 0 2 0 2 = v n e Q + U a B m 2 . 9
1 3s–1
m 2 . 9 1 = v n e Q + U a
B 3s–1
n o i t p m u s n o C d l o h e s u o H + d e l l o r t n o C 0 0
7 75.19† 74.19† 75.99† 80.91† 80.05†
0 0
8 85.85 86.04 85.61 92.3 92.1
0 0
9 95.25 96.48 94.1 102.35 102.73
0 0 0
1 103.66 105.83 101.69 111.34 112.23
0 0 1
1 111.27 114.28 108.56 119.47 120.83
0 0 2
1 118.22 122 114.83 126.89 128.68
0 0 3
1 124.6 120.59 133.72 135.9
0 0 4
1 130.52‡ 134.67 125.93‡ 140.05‡ 142.59‡
0 0 5 1 0 0 6
1 147.52‡
Note: †Values for year 2004; ‡Values for year 2054.
Table 3 - Relationship between Water shortage and Level of exploitation estimated using the Water Resources Model for the Piracicaba, Capivari and Jundiaí River Basins in a 50-year time frame simulation under five scenarios.
the sustainability of water body ecosystems will be under great stress, since more wastewater reuse will become a water source for human activities. Without any doubt, this situation will increase water treatment prices, and foreseen alternatives to solve this situation are a must.
River basin water resources develop through a se-quence, conceptualizing the development phases that all river basins will tend to pursue. This tendency, ac-cording to Keller et al. (1998), follows a general pro-gression through three development phases (each with two sub-phases): Exploitation (<60% of the ratio Use/ Net Withdraws – U/NW), Conservation (<90% U/NW) and Augmentation (>90% U/NW). As basins progress throughout development phases, they would approach closure.
When basin development was analyzed using Keller et al. (1998), it was noticed that in 2007 the RB-PCH was at Phase II, stage 1: Conservation Phase (Figure 7). During this stage of development policies to reduce water demand and to increase water use efficiency should be taken. Under the BaU scenario, by 2008 the RB-PCJ will be entering Phase II, stage 2, the final stage of this phase. By 2016 the RB-PCJ will be at the initial stage of Phase III, the Augmentation Phase. This is the final basin development phase, when wa-ter resources will have to come from wawa-ter transfers or by desalting water. In this particular regard, the other scenario predictions are also not very encour-aging.
The Falkenmark Index for the year 2004 (Figure 7 and Table 3) under the BaU scenario started at 1403 m3 inhabitant–1 year–1 (713 inhab Mm–3 year–1) in the
RB-PCJ; by 2030 it will have gone down to 1008 m3
inhab–1 year–1 (992 inhab Mm–3 year–1); and by 2054 it
will end up at 734 m3 inhab–1 year–1 (1363 inhab Mm–3
year–1). Water stress exists when values are between
1000 and 1600 m3 inhab–1 year–1, and chronic water
shortage occurs when water available volume is be-tween 500 and 1000 m3 inhab–1 year–1; for values
smaller than 500 m3 inhab–1 year–1, water resources are
beyond the management capacity barrier (Falkenmark, 1989). Table 3 confirms the watershed’s tendency to-wards basin closure.
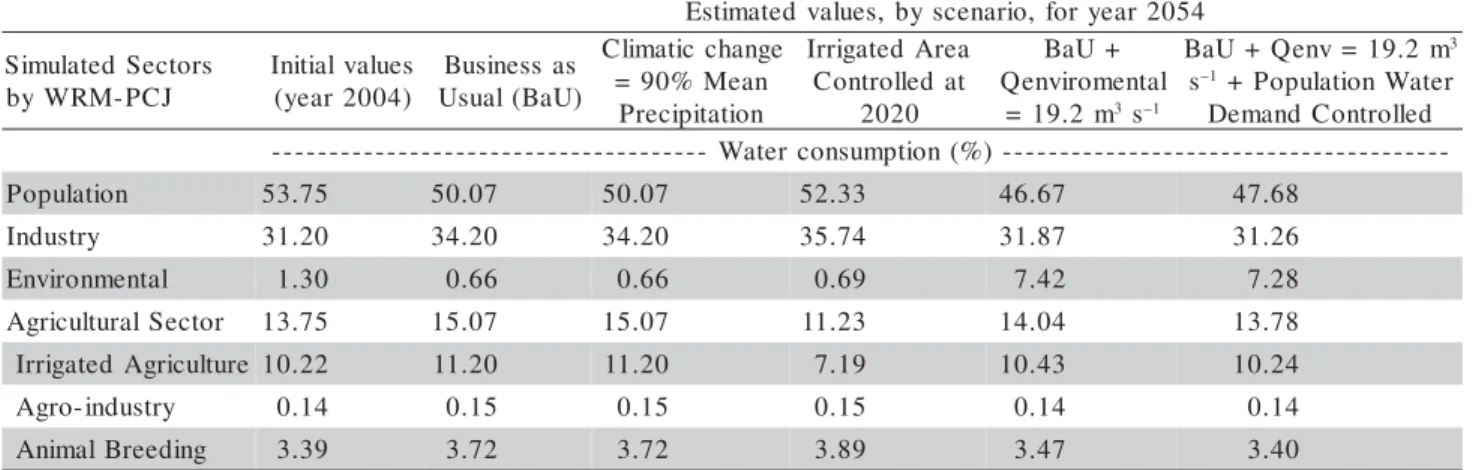
The watershed’s predisposition is confirmed (Table 4) as a highly populated watershed that contains a very important industrial sector in Brazil, inspite of the sce-nario considered. Regardless of the analyzed scesce-nario the main consumers in the RB-PCJ are Population and Manufacturing. During the modeling and simulation process it was noticed that urban household water con-sumption at the RB-PCJ is high when compared with other countries, even developing countries such as those that belong to the European Union (EU).
Poli-Table 4 - Water Consumption by Sector, in percentage, computed for five scenarios using the Water Resources Model for the Piracicaba, Capivari and Jundiaí River Basins from 2004 to 2054.
4 5 0 2 r a e y r o f , o i r a n e c s y b , s e u l a v d e t a m i t s E s r o t c e S d e t a l u m i S J C P -M R W y b s e u l a v l a i t i n I ) 4 0 0 2 r a e y ( s a s s e n i s u B ) U a B ( l a u s U e g n a h c c i t a m i l C n a e M % 0 9 = n o i t a t i p i c e r P a e r A d e t a g i r r I t a d e l l o r t n o C 0 2 0 2 + U a B l a t n e m o r i v n e Q m 2 . 9 1
= 3s–1
m 2 . 9 1 = v n e Q + U a B 3
s–1+PopulationWater d e l l o r t n o C d n a m e D -) % ( n o i t p m u s n o c r e t a W -n o i t a l u p o
P 53.75 50.07 50.07 52.33 46.67 47.68
y r t s u d n
I 31.20 34.20 34.20 35.74 31.87 31.26
l a t n e m n o r i v n
E 1.30 0.66 0.66 0.69 7.42 7.28
r o t c e S l a r u t l u c i r g
A 13.75 15.07 15.07 11.23 14.04 13.78
e r u t l u c i r g A d e t a g i r r
I 10.22 11.20 11.20 7.19 10.43 10.24
y r t s u d n i -o r g
A 0.14 0.15 0.15 0.15 0.14 0.14
g n i d e e r B l a m i n
A 3.39 3.72 3.72 3.89 3.47 3.40
cies toward the management of water resources should take into consideration these two sectors to be really effective to ensure water resources sustainability.
The Sustainability Index (SI) as proposed by Xu et al. (2002) (Figure 8) and estimated using WRM-PCJ shows that under the BaU scenario, by 2004 the SI is 0.44; it will have decreased to 0.33 by 2030, and to 0.20 by 2054. The WRM-PCJ considers wastewater reuse as part of available water when SI is computed, in contrast with the result presented by the use-to-availability relation on the y-axis in Figure 6. If the SI value is greater than 0.2, then there is low or no stress with regard to water supply; if the SI value is smaller than 0.2 then the water resources are vulnerable. SI values equal to zero indicates that the water supply is unsustainable.
The various methods to assess water resources and basin development at the RB-PCJ show that appropri-ate and urgent decisions should be made to stop the deterioration of the available water resources. By 2030 the RB-PCJ water resources situation will be extremely demanding and stressful, as shown by the estimated
-0.1 0.2 0.3 0.4 0.5
2000 2010 2020 2030 2040 2050 2060
S u st ai nab il it y I nde x (d im ensi o n less) Year Climatic Change = 90% mean precipitation Irrigated Area Controlled by 2020 BaU + Qenvironmental
BaU+ Qenv+Human Consumption Controlled Business as Usual (BaU)
coefficients. Additionally, by 2054, the situation will be on the verge of becoming unsustainable. Therefore, appropriate steps must be taken now seeking a water resources management policy to avoid an ecological chaos in the RB-PCJ.
CONCLUSIONS
All scenarios also showed that the RB-PCJ will be at a chronic water shortage situation by 2054. The model and system dynamics methodology herein de-veloped proved to be a useful tool to plan, analyze and assess water resources systems and policies towards water resources sustainability. WRM-PCJ could be of great importance to the local government, watershed conservation planners and watershed committee mem-bers to develop sustainable water resources manage-ment practices and policies considering state and re-gional development, environmental concerns and eco-logical needs at RB-PCJ.
ACKNOWLEDGMENTS
The authors thank CNPq (151864/2007-1), INCTEI and FAPESP (2006/60954-4) for financial support and scholarships awarded.
REFERENCES
ASSOCIAÇÃO BRASILEIRA DE RECURSOS HÍDRICOS – ABRH. Available at: http://www.abrh.org.br/cartasalvador.doc. Accessed 26 May 2008.
COMITÊ DAS BACIAS DOS RIOS PIRACICABA, CAPIVARI E JUNDIAÍ – COMITÊ CPJ. Available at: http:// www.comitepcj.sp.gov/download/Decreto-27576-87.pdf. Accessed 26 May 2008.
COSTA, M.P.B. Agroecologia: uma alternativa viável às áreas reformadas e à produção familiar. Revista Reforma Agrária, v.23, p.53-69, 1993.
DEPARTAMENTO DE ÁGUAS E ENERGIA ELÉTRICA – DAEE. Available at: http://www.daee.sp.gov.br/. Accessed 06 May 2007. FALKENMARK, M.; MOLDEN, D. Wake up to realities of river basin closure. International Journal of Water Resources Development, v.24, p.201-215, 2008.
FALKENMARK, M.; BERNTELL, A.; JÄGERSKOG, A.; LUNDQVIST, J.; MATZ, M.; TROPP, H. On the verge of a new scarcity: call goes good governance and human ingenuity; Stockholm: Stockholm International Water Institute, 2007. 20p. FALKENMARK, M. The Massive water scarcity now threatening africa-why isn’t it being addressed? Ambio, v.18, p.112-118, 1989.
FORRESTER, J.W. Industrial dynamics. Cambridge, M.I.T. Press, 1961. 464p.
INSTITUTO BRASILEIRO DE GEOGRAFIA E ESTATÍSTICA – IBGE. Available at: http://www.ibge.gov.br/home/. Accessed 30 May 2007.
INSTITUTO DE ECONOMIA AGRÍCOLA - IEA. Available at: http://www.iea.sp.gov.br/. Accessed 14 May 2007.
INSTITUTO NACIONAL DE METEOROLOGIA - INMET. Available at: http://www.inmet.gov.br/. Accessed 12 May 2007.
INSTITUTO NACIONAL DE PESQUISAS ESPACIAIS – INPE. Available at: http://www.inpe.br/. Accessed 22 May 2007. INSTITUTO DE PESQUISA ECONÔMICA APLICADA - IPEA.
Available at: http://www.ipea.gov.br/. Accessed 28 May 2007. IRRIGART. Relatório da situação dos recursos hídricos das
bacias hidrográficas dos rios Piracicaba, Capivari e
Jundiaí – 2002/2003. Piracicaba: Comitê das Bacias
Hidrográficas dos Rios Piracicaba, Capivari e Jundiaí, 2004. 496p. KELLER, J.; KELLER, A.; DAVIDS, G. River basin development phases and implications of closure. Journal of Applied Irrigation Science, v.33, p.145-163, 1998.
OHLSSON, L.; TURTON, A.R. The turning of screw: social resource scarcity the the bottle-neck in adaptation to water scarcity. London: University of London, 1999. 8p. (SOAS Occasional Paper, 19).
PÉREZ MAQUEO, O.; DELFÍN, C.; FREGOSO, A.; COTLER, H. Modelos de simulación para la elaboración y evaluación de los programas de servicios ambientales hídricos. Gaceta Ecológica, v.78, p.65-84, 2006.
PBH. Plano de bacias hidrográficas 2004-2007 dos rios Piracicaba, Capivari e Jundiaí: síntese do relatorio final. São Carlos: SHS Consultoria e Projetos de Engenharia, 2006. 48p.
PERH. Plano Estadual dos Recursos Hídricos 2004-2007 do Estado de São Paulo:- relatório síntese do plano. Piracicaba: Consórcio JMR Engecorps, 2005. 47p.
POWERSIM. Introduction to system dynamics. Reston: Powersim Press, 1996. 44p.
RASKIN, P.; GLEICK, P.; KIRSHEN, P.; PONTIUS, G.; STRZEPEK, K. Water futures: assessment of long-range patterns and prospects. Stockholm: Stockholm Environment Institute, 1997. 77p.
SANTOS, M. O espaço e os seus elementos: questões de método. Revista Geografia e Ensino, v.1, p.19-30, 1982.
SECRETARIA DE AGRICULTURA E ABASTECIMENTO DO ESTADO DE SÃO PAULO.- SAA-SP Available at: http:// www.agricultura.sp.gov.br/. Accessed 03 May 2007.
SIRGH. Sistema de Informações para o Gerenciamento de Recursos Hídricos do Estado de São Paulo Available at: http:// www.sigrh.sp.gov.br/cgi-bin/bdhm.exe/plu . Accessed 25 Apr. 2007.
SIMONOVIC, S.P.; FAHMY, H. A new modeling approach for water resources policy analysis. Water Resources Research, v.35, p.295-304, 1999.
SOUCHON, Y.; KEITH, P. Freshwater fish habitat: science, management and conservation in France. Aquatic Ecosystem Health and Management Society, v.4, p.401-412, 2001. TURTON, A.R. Water scarcity and social adaptive capacity:
towards an understanding of the social dynamics of water demand management in developing countries. London: University of London, 1999, 23p. (SOAS Occasional Paper, 9).
UNIÃO DA INDÚSTRIA DE CANA-DE-AÇÚCAR - UNICA. Available at: http://www.portalunica.com.br. Accessed 12 May 2007.
UNITED NATIONS ENVIRONMENT PROGRAMME - UNEP. Freshwater in Europe, 2007. Available at: http:// www.grid.unep.ch/product/publication/freshwater_europe/ consumption.php. Acessed 28 Sept. 2007.
WIAZOWSKI, B.A.; SILVA, C.A.B; LOURENZANI, W.L. O uso de sistemas dinâmicos como ferramenta de aprendizagem. Economia Rural, v.3, p.29-33, 1999.
XU, Z.X.; TAKEUCHI, K.; ISHIDARA, H.; ZHANG, X.W. Sustainability analysis for Yellow River water resources using the system dynamics approach. Water Resources Management, v.16, p.239-261, 2002.