Acta Limnologica Brasiliensia
Influence of net-cage fish farming on zooplankton
biomass in the Itá reservoir, SC, Brazil
Influência da piscicultura em tanque-rede sobre a
biomassa do zooplâncton no reservatório de Itá, SC, Brasil
Bruna Roque Loureiro1,3, Christina Wyss Castelo Branco2 and Evoy Zaniboni Filho1,3 1Programa de Pós-graduação em Aquicultura, Universidade Federal de Santa Catarina – UFSC,
Itacorubi, CEP 88034-001, Florianópolis, SC, Brazil, e-mail: brunaroqueloureiro@gmail.com 2Núcleo de Estudos Limnológicos – NEL, Departamento de Zoologia,
Universidade Federal do Estado do Rio de Janeiro – UNIRIO, Av. Pasteur, 458, Urca, CEP 22290-240, Rio de Janeiro, RJ, Brazil
e-mail: cbranco@unirio.br
3Laboratório de Biologia e Cultivo de Peixes de Água Doce – LAPAD, Departamento de Aquicultura, Centro de Ciências Agrárias, Universidade Federal de Santa Catarina – UFSC,
Rod. SC 406, Km 3, 3532, Lagoa do Perí, CEP 88066-000, Florianópolis, SC, Brazil e-mail: evoy@lapad.ufsc.br
Abstract: Objectives: This study aimed to verify the influence of net-cage fish farming on zooplankton biomass in the Itá reservoir (Uruguay River, Brazil). Methods:
Samples were collected monthly from October/2009 to May/2010 at the surface and at the bottom in two sampling stations, the net-cage area and in a control area using a Van Dorn bottle and a plankton net (68 µm). Results: The Cladocera and Copepoda biomass was estimated by dry weight using a micro-analytical balance, and the Rotifera biomass by Biovolume. Total zooplankton biomass varied between 6.47 and 131.56 mgDW.m–3 Calanoida copepod presented the highest value of biomass (127.56 mgDW.m–3) and rotifers, despite having an important contribution to total density, showed a maximum biomass of 2.01 mgDW.m–3. Zooplankton biomass at the net-cage area surface was higher when compared with the control area during the months of October to January. However, the zooplankton biomass was similar at the bottom of the two areas throughout the studied period. From February until May, zooplankton biomass decreased in both sampling stations, a fact probably associated with the flushing of the reservoir, followed by an increase in water transparency and a decrease in chlorophyll-a concentration in the following months (February to May). Conclusions: The influence of fish farming on zooplankton biomass was detected at the surface of the net-cage area only from October to January. From February to May this influence was not found, probably by the influence of the flushing of the reservoir.
Keywords: Zooplankton, dry weight, net cage, reservoir.
Resumo:Objetivo: Este estudo teve o objetivo de verificar a influencia da piscicultura em tanque-rede sobre a biomassa da comunidade zooplanctônica no reservatório de Itá (Rio Uruguai, Brasil). Metodologia: Foram realizadas coletas mensais de outubro/2009 a maio/2010 na superfície e no fundo em dois pontos amostrais, ponto tanque-rede e em uma área controle, com o auxílio da garrafa Van Dorn e rede de plâncton (68 µm).
Resultados: A biomassa dos rotíferos foi obtida através do cálculo do biovolume e a dos cladóceros e copépodos por peso seco, a partir da pesagem em balança micro-analítica. Os valores de biomassa total zooplanctônica variaram entre 6,47 e 131,56 mgDW.m–3. Os copépodos Calanoida apresentaram os maiores valores de biomassa (127,56 mgDW.m–3) e os rotíferos, apesar de importantes em termos de densidade, apresentaram uma biomassa máxima de 2,01 mgDW.m–3, contribuindo pouco para biomassa total. A área de cultivo apresentou maiores valores de biomassa zooplanctônica na superfície quando comparada com a área controle, durante os meses de outubro a janeiro. Entretanto, a biomassa zooplanctônica na água do fundo foi semelhante nas duas áreas durante todo o período de estudo. De fevereiro a maio, os valores de biomassa reduziram-se nos dois pontos amostrais, fato esse associado ao incremento do fluxo da vazão efluente do reservatório, através da abertura das comportas no mês de janeiro, o que foi acompanhada pelo aumento da transparência da água e decréscimo nos valores de clorofila-a nos meses seguintes (fevereiro a maio). Conclusão: A influência da piscicultura na biomassa da comunidade zooplanctônica foi detectada na superfície da área dos tanques-rede, no período de outubro a janeiro, entretanto, nos meses seguintes, de fevereiro a maio, não foi observado o efeito, possivelmente explicado pela perda da camada superficial do reservatório.
Palavras-chave: Zooplâncton, peso seco, tanque-rede, reservatório.
communities, as showed by Hardy et al. (1984) in the Camaleão lake (State of Amazonas), where these organisms represented more than 70% of the total biomass. Okano (1994) also found rotifers responsible for 61% of the total biomass of zooplankton in a Brazilian reservoir.
Most studies on zooplankton biomass in Brazil (Esteves and Sendacz, 1988; Matsumura-Tundisi et al., 1989; Rocha et al., 1995; Melão and Rocha, 2000; Sendacz et al., 2006) showed that, even though the rotifers have the highest number of individuals, their contribution to biomass is very low in the community, which often presents a higher contribution of larger organisms such as cladocerans and copepods to the total biomass. Despite these studies considering the diversity and richness of aquatic ecosystems in Brazil, information about freshwater zooplankton biomass is still scarce, especially in reservoirs and the effect of the fish farming in the water quality (Brito, 2010).
The aim of this study was to evaluate the effect of net-cage fish farming on the biomass of the zooplankton community in the Itá reservoir, testing also the hypothesis that the chlorophyll-a and biomass of groups of the zooplankton are directly correlated.
2. Material and Methods
2.1. Study area
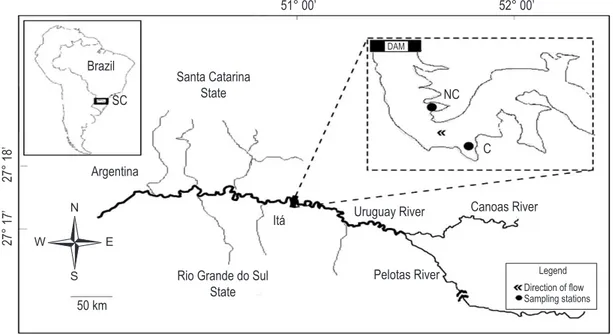
The Itá reservoir is located in the Uruguay River between the cities of Itá (SC) and Aratiba (RS), Brazil. It has a flooded area of 103 km2 (Figure 1) and a power capacity of 1,450 MW. The average time of water residence is approximately 55-60 days. The values of the effluent flow of the Itá reservoir and of the precipitation in the study period are presented in Table 1.
A total of 32 net cages, 20 with a volume of 4 m3 and 12 with a volume of 8 m3, were installed in a small bay (approximately 3 ha). Cages were stocked with juvenile “dourado” (Salminus brasiliensis), silver catfish (Rhamdia quelen) or “suruvi” (Steindachneridion scriptum). The fish were fed daily with commercial feed and provided with an amount of food equivalent to 3% of the biomass in each cage. The (average) biomass of fish stocked in each individual cage was 180 kg over all the study period.
2.2. Sampling procedures
The zooplankton community was studied monthly from October 2009 to May 2010, in two different stations of the reservoir, one
1. Introduction
A better understanding of tropical aquatic ecosystems requires more studies, measuring the actual quantity of matter and energy flowing through the ecosystem. Estimation of the aquatic community biomass constitutes an important contribution to the study of trophic-web structure, providing qualitative information on the organic matter available in different trophic levels and can also characterize the complexity of major biotic interactions such as predation and competition, and natural disturbances, besides permitting inferences on the structure of the aquatic environment independent of taxonomy (Rossa et al., 2007; González et al., 2008).
The zooplankton community represents one of the fundamental links in the food chain of aquatic ecosystems, contributing to both energy flow and nutrient dynamics. According to Bozelli and Huszar (2003), biomass estimates are a priority for brazilian environments since it can lead to advances in real assessments of the role of zooplankton on trophic structure. Such information is essential to comparing environments, especially if the objective of the research is the quantification of trophic interactions.
Considering that biomass evaluation is a measure of the contribution of a food-chain link to the energy flow and also of the available resources in a specific component of the community, the total zooplankton biomass can be useful for estimating the impact of grazers on phytoplankton and also food available for fish. Moreover, grazing rates on phytoplankton vary with zooplankton taxonomic composition, size structure and biomass of the zooplankton communities (Cyr and Pace 1992; Matsumura-Tundisi, 1999; Espíndola et al., 2000).
glass fiber filters (Whatman GF/C 47 mm). Total dissolved phosphorus, organic phosphorus, total phosphorus, ammonium, total nitrogen, and nitrite were determined according to APHA (1992). Water transparency was estimated using a 30 cm Secchi disk. The chlorophyll-a concentration was determined after extraction with 90% acetone solution (Lorenzen, 1967).
2.3. Estimation of density and biomass of zooplankton
Zooplankton density was estimated by counting at least 200 individuals in a Sedgewick-Rafter chamber taken with a Hensen-Stempell pipette under a microscope. The entire sample was inspected for rare species.
For the estimation of microcrustacean adults, the weighing technique was adopted and the dry weight of each individual obtained. Thirty individuals of each species were washed in distilled water to remove all material adhered to the carapace without damaging them, with a washing time of 30 minutes (Culver et al., 1985). Before being weighed, the organisms were separated in small coverslips, which had been previously dried at 60 °C located in the net-cage area, NC (27° 17’ 49.3” S
and 52° 22’ 27.7” W) and another in a region with no fish farming influence, C (Control station – 27° 18’ 17.9” S and 52° 21’ 25” W). Qualitative and quantitative zooplankton samples were collected at the surface and at the bottom (20 m.) in both stations.
Zooplankton samples for qualitative analyses were collected by combining three vertical and three horizontal hauls using 68 µm mesh plankton net. For zooplankton quantitative analysis 150 L of water was collected from the surface with a 20 L collector and the same volume was taken from the bottom with a 10 L Van Dorn bottle (5 L) and filtered also using 68 µm mesh plankton net. Each sample was immediately fixed in 4% buffered formaline.
Water temperature, electrical conductivity, pH and dissolved oxygen (DO) were measured at the surface and at the bottom in the two sampling stations using a multiparametric probe (YSI-6600). Water samples were taken at the surface and the bottom using a Van Dorn bottle, conditioned in acid-washed plastic bottles (HCl 10% solution) and kept frozen. In the laboratory, samples for the dissolved nutrients analysis were filtered using
Table 1. Values of monthly mean effluent flow (m3/s) and mean daily precipitation (mm) between October 2009 and May 2010 in the Itá Reservoir.
Oct. Nov. Dec. Jan. Feb. Mar. Apr. May
Effluent flow (m3/s) 1755 988 956 1093 867 1015 882 1143
Precipitation (mm) 4.71 7.23 3.55 5.77 7.18 4.83 10.8 6.61
variation of the zooplankton biomass related to depths (surface and bottom) and periods (months). A Pearson correlation was performed to investigate associations among zooplankton biomass and other variables: phytoplankton biomass and abiotic data: water temperature (Twa), electric conductivity (Con), pH, dissolved oxygen (DO), total dissolved phosphorus (TDP), total phosphorus (TP), organic phosphorus (OP), ammonium (NH4+), nitrite
(NO2–), total nitrogen (TN) and water transparency,
by the Secchi disk (T). The software used was Statistica version 7.1 (Statsoft Inc., 2005).
3. Results
3.1. Abiotic data
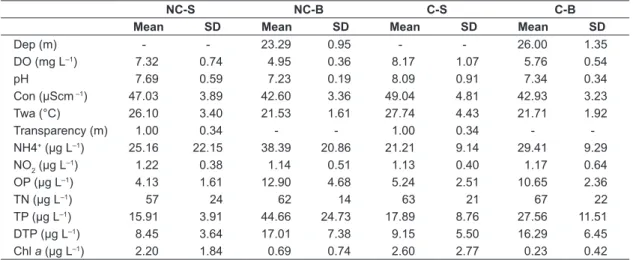
The results of the abiotic variables were similar between the net-cage and control area at both depths (Table 2), except for concentrations of total phosphorus and ammonium that showed higher values at the bottom in both sampling stations, especially in the net-cage area. The mean total phosphorus recorded at the surface in net-cage area was 15.91 (±3.91) µg.L–1 and at the bottom was 44.66 (±24.73) µg.L–1. The mean ammonium concentration was 25.16 (±22.15) µg.L–1 at the surface and 38.39 µg.L–1 (±20.86) µg.L–1 at the bottom.
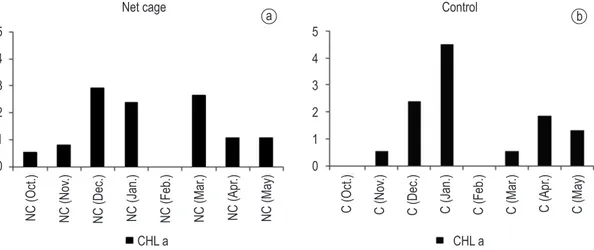
3.2. Chlorophyll-a
The chlorophyll-a was low throughout the study period and the highest value recorded at the surface and at the bottom of the control area was in January for two hours, then cooled in a desiccation chamber
for 1 hour, weighed using a Mettler UMT (MX5) balance and maintained in a desiccation chamber. The coverslips with the organisms were dried at 60 °C for 24 hours, cooled in a desiccation chamber for 1 hour (McCauley, 1984) and immediately weighed (Burns, 1969; Edmondson and Winberg, 1971; Persson and Ekbohm, 1980; Pace and Orcutt, 1981; Rosen, 1981; McCauley, 1984; Culver et al., 1985; Hessen, 1989; Masundire, 1994).
The biomass of rotifers, nauplii and copepodids, was estimated by the biovolume method proposed by Ruttner-Kolisko (1977). This methodology uses mathematical formulas to calculate the volume of the organisms, based on the geometric forms that are most similar to the body shape of the species, and considering the different dimensions of the body. Using this methodology it was possible to calculate the biovolume of other taxa such as nauplii, adapting formulas according to the morphology of the body. Using a micrometrical eyepiece, measurements of at least 20 individuals of each taxon were taken. The dry weight was estimated by biovolume calculations, adopting the assumption that 106 µm3 is equivalent to 1 µg of wet weight (Bottrell et al., 1976; Rossa, 2001), and dry weight as 10% of the wet weight (Pace and Orcutt, 1981). The total biomass was estimated using the number of individuals of each taxa and their mean mass (dry weight), expressed in mgDW.m–3. 2.4. Data analysis
A nonparametric analysis of variance (Mann-Whitney U test, Zar, 1984) was employed to investigate the effect of fish farming on the
Table 2. Mean values and standard deviations of water quality in the Itá reservoir.
NC-S NC-B C-S C-B
Mean SD Mean SD Mean SD Mean SD
Dep (m) - - 23.29 0.95 - - 26.00 1.35
DO (mg L–1) 7.32 0.74 4.95 0.36 8.17 1.07 5.76 0.54
pH 7.69 0.59 7.23 0.19 8.09 0.91 7.34 0.34
Con (µScm –1) 47.03 3.89 42.60 3.36 49.04 4.81 42.93 3.23
Twa (°C) 26.10 3.40 21.53 1.61 27.74 4.43 21.71 1.92
Transparency (m) 1.00 0.34 - - 1.00 0.34 -
-NH4+ (µg L–1) 25.16 22.15 38.39 20.86 21.21 9.14 29.41 9.29 NO2 (µg L–1) 1.22 0.38 1.14 0.51 1.13 0.40 1.17 0.64
OP (µg L–1) 4.13 1.61 12.90 4.68 5.24 2.51 10.65 2.36
TN (µg L–1) 57 24 62 14 63 21 67 22
TP (µg L–1) 15.91 3.91 44.66 24.73 17.89 8.76 27.56 11.51
DTP (µg L–1) 8.45 3.64 17.01 7.38 9.15 5.50 16.29 6.45
Chl a (µg L–1) 2.20 1.84 0.69 0.74 2.60 2.77 0.23 0.42
values were found at the surface of the net-cage area in April (6.47 mgDW.m–3) and at the surface of the
control area in May (6.95 mgDW.m–3) (Figure 3).
There was a monthly zooplankton biomass variation in the two sampling stations during the study. Copepoda were the predominant group in terms of biomass and frequently also in terms of density. The major contribution of this group was at the surface of the net-cage area in October (127.56 mgDW.m–3) corresponding to 97% of the total biomass. This high contribution was also observed at the surface of the control area such as in November (116.07 mgDW.m–3), representing 98% of the total biomass.
Differently, Cadocera presented their maximum values of biomass at the bottom of the control area (respectively, 8.01 and 1.07 µg.L–1). These values
decreased to below the detection limit of the method in February at both sampling stations (Figure 2).
3.3. Zooplankton biomass
The total biomass of zooplankton was higher at the surface of the station influenced by the net-cage fish farming than in the control area, from October to January, (M-W test, p = 0.04). On the other hand, at the bottom of both areas the zooplankton biomass was similar throughout the period studied, as well as at the surface from February to May (p > 0.05). The total biomass presented the highest values at the surface of the net-cage area (131.56 and 118.23 mgDW.m–3 in October and November, respectively). The lowest
a b
Figure 2. Variation of the chlorophyll-a (µg l–1) in the Itá reservoir in the sampling stations. a) net-cage area (NC), b) control area (c), with the period in parentheses.
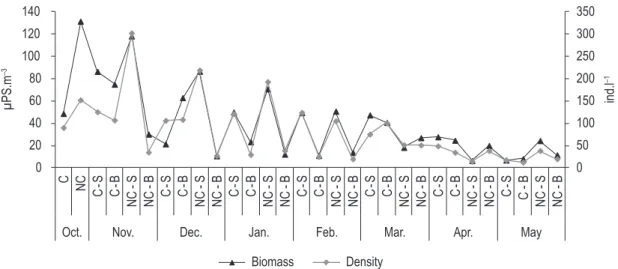
as well, the values of zooplankton biomass were associated with density (Figure 5). When a high value of total density corresponded to a low value of biomass, such as at the surface of the control area in December, explained by the dominance of Rotifera (80% of total density in December).
in November (24.72 mgDW.m–3) and December
(9.58 mgDW.m–3) and the lowest in May, both
in the control area (0.17 mgDW.m–3) and in the
net-cage area (0.37 mgDW.m–3). Rotifera had a
low contribution to total zooplankton biomass, and the highest value was recorded at the surface of the net-cage area in October (2.01 mgDW.m–3) and
the lowest at the bottom of the control area in May (0.038 mg DW.m–3). However, rotifers presented
a high contribution in terms of density when compared to other groups (Figure 4). Copepoda also presented high relative density, mainly because of the nauplii forms and copepodids that showed higher abundance than adults (Table 3). Only adults of Notodiaptomus incompositus and Thermocyclops minutus contributed significantly to increases in the total biomass of zooplankton. Due to the influence of copepods on zooplankton density
Figure 4. Relative density (%) in Itá reservoir (NC-S: Net-cage surface station, NC-B: Net-cage bottom station, C-S: control surface station and C-B: control bottom station).
Table 3. Mean density (ind.L–1) of Copepoda forms (adults, nauplii and copepodid) and the orders (Calanoid and Cyclopoid) in each sample station (C - control area; NC - net-age area).
C NC
Cyclopoida adult 1.21 1.69
Cyclopoida nauplii 11.73 10.57
Cyclopoida copepodid 3.67 3.55
Calanoida adult 1.83 2.19
Calanoida nauplii 23.83 38.38
Calanoida copepodid 2.93 3.80
since the species found Notodiaptomus incompositus is considered of large size. The contribution of small-sized organisms (nauplii and copepodid stages) to total microcrustacean zooplankton biomass in our study was around 94%. The dominance of juvenile forms among copepods has also been reported by other authors in Brazilian reservoirs (Matsumura-Tundisi et al., 1990; Bonecker et al., 2001; Almeida et al., 2009).
The Copepoda play an essential role in energy flow, as a greater number of species are herbivorous throughout their development, such as Calanoida (Almeida et al., 2009). Microcrustacean biomass is influenced by trophic features and in tropical eutrophic reservoirs the values tended to be higher. Blettler and Bonecker (2007), studying microcrustacean biomass in three tropical reservoirs, found a mean biomass of microcrustacean of 101.5 mgDW.m–3 (maximum 261.5 mgDW.m–3) in the eutrophic reservoir and a mean biomass of 6.9 and 7.3 in two other reservoirs with less phosphorus content. A higher biomass of Cyclopoida copepods (236.19 mgDW.m–3) was found during the dry season in a eutrophic reservoir by Sendacz et al. (2006). These authors found a maximum biomass of total zooplankton of 356.8 mgDW.m–3 in the eutrophic reservoir during the dry season. In our study the highest Copepoda biomass in the net cages was compared to eutrophic reservoirs, but the average biomass of this group was similar to oligotrophic systems.
Although the important contribution of Rotifera to total density, they had a low contribution to total zooplankton biomass on the Itá reservoir. The highest value recorded was 2.01 mgDW.m–3. In other studies the values of Rotifera biomass was between 0.9 and 1.5 mg DW.m–3 reported by Melão (1997) and Sendacz et al. (2006), respectively, for oligotrophic reservoirs.
Studies on the biomass of the zooplankton community in different environments can be a common unit to measure zooplankton groups and can also be used to compare different trophic states There was no correlation between chlorophyll-a
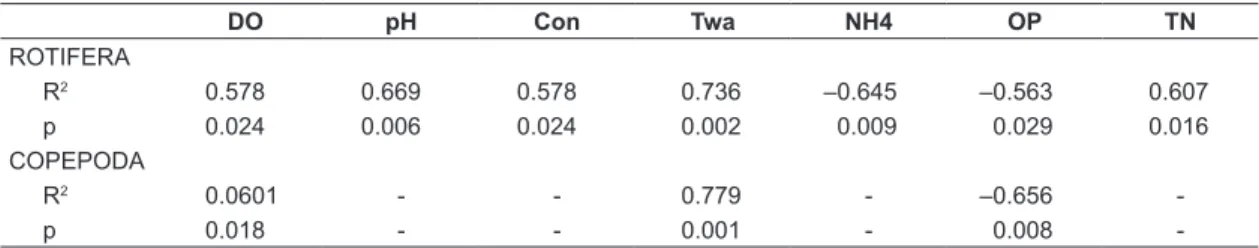
and any zooplankton group (Rotifera, Copepoda and Cladocera, refuting the hypothesis that phytoplankton is a direct source of food for these organisms. Significant correlations (p < 0.05) between biomass of zooplankton groups (Copepoda and Rotifera) and abiotic data were found in the net-cage area (Table 4). Rotifera biomass was correlated with most abiotic data (p < 0.05), differently from Copepoda that only presented significant correlations with dissolved oxygen, water transparency and organic phosphorus. The biomass of Cladocera not shows any correlation with the physical and chemical data.
4. Discussion
According to Beveridge (2004) and Pillay (2004), in aquatic organism farming systems using net cages, 30% of organic material (feed) is not utilized by the stocking species. Therefore, a high quantity of organic matter is available to the aquatic ecosystem (Munday et al., 1992; Pillay, 2004). In our study, the farming activities in the Itá reservoir showed an influence on the zooplankton community on the net-cage area, that showed higher zooplankton density and biomass levels at the surface in comparison at the bottom and when compared to the control area, from October to February. Although differences were not significative between most nutrient concentrations when compared both sampling stations, however the values of total phosphorus were higher at the bottom of the net-cage area, showing an increase of this nutrient from fish farming decay.
The maximum value of total biomass (131.56 mgDW.m–3) was found at the surface of the net-cage area in October. This value was composed mainly of Copepoda biomass (127 mgDW.m–3), as well as most of the zooplankton biomass of all samples. Despite the low density of adult forms in relation to the young forms (nauplii and copepodids), the adults contributed significantly to total biomass
Table 4. Pearson correlation (p < 0.05) between zooplankton groups (rotifers and copepods) and abiotic data.
DO pH Con Twa NH4 OP TN
ROTIFERA
R2 0.578 0.669 0.578 0.736 –0.645 –0.563 0.607
p 0.024 0.006 0.024 0.002 0.009 0.029 0.016
COPEPODA
R2 0.0601 - - 0.779 - –0.656
-p 0.018 - - 0.001 - 0.008
biomass is low, detritus is more important than the primary production.
According to Araújo and Pinto-Coelho (1998), when the aquatic system receives a high load of organic matter from allochthonous input, organic matter may constitute an important food resource for zooplankton filtration. The condition of increased allochthonous organic matter is also associated with aquaculture activities, for example, fish farming in net-cages, which produces solid residue compounds (food supplies, feces, mucus) and soluble compounds (dissolved phosphorus and nitrogen), consequently a large quantity of organic matter is available in the aquatic ecosystem (Munday et al., 1992; Pillay, 2004). Fish farming in the Itá reservoir, due to the input of organic matter, probably also creates conditions favorable to the growth of the bacterial community, supposedly more pronounced near the area of the cage-nets, where zooplankton biomass was also enhanced.
As the contribution of small-sized zooplanktonic organisms (nauplii and copepodid stages) to total microcrustacean zooplankton biomass was around 94%, we suggest that organisms of larger sizes, which biomass values were low compared to other forms, were probably being controlled by fish predation in the area of cultivation, which helps to explain the dominance of small zooplankton at this point. According to the study of Nunes (2009) in the Itá reservoir, food preferences of fish fauna (80%) were the zooplankton of large size. This preference for adult organisms can explain the predominance of nauplii and copepodid forms in the present study. A similar situation was found by Paes (2006), who observed an increase of the accompanying fauna within net cages in the fish farming area, being potential predators of zooplankton.
We concluded that the activity of fish farming in net cages influenced the zooplankton community in the Itá reservoir increasing the biomass at the surface, as noted from October to January. However, from February to May was not detected an effect of fish farming on zooplankton biomass, to us this can be explained by the influence of the flushing of the reservoir that led to a loss of surface water, after this was noted the increase in water transparency and a decrease in phytoplankton biomass (chlorophyll-a) and zooplankton biomass in the following months (February to May). Another secondary impact observed of fish farming on zooplankton biomass not evidenced by our study, but well known from literature, was the presence of accompanying within a reservoir or among different reservoirs.
Eutrophic systems generally have higher values of biomass when compared to less eutrophic systems, both in temperate and tropical regions (Pace, 1986; Esteves and Sendacz, 1988). In the present study, this was also observed since zooplankton biomass was higher at the surface in the net-cage area when compared to the control area, from October to January.
The minimum zooplankton biomass of our study was 6.47 µgDw.m–3, in April, corresponding to the findings in less eutrophic reservoirs. A remarkable decrease in the values of biomass observed in the two studied areas from February to May was associated with the flushing of the reservoir that led a loss of surface water with the opening of the reservoir gates. With this loss in January, in the next month changes were observed in the abundance and biomass of zooplankton, which began to present low values in both sampling stations. Chlorophyll-a concentration was also reduced in February and water transparency doubled when compared to January. These changes can be explain the low values of zooplankton density and biomass observed from February to May, period in which the fish farming did not affect zooplankton.
The shortest retention time associated with the greatest outflow was also associated with low Copepoda densities in Barra Bonita according to Santos-Wisniewski and Rocha (2007). A great reduction in phytoplankton biomass associated with the loss of surface water was also reported by Angelini et al. (2008) in the Paranoá reservoir, consequently also modifying the aquatic communities.
CULVER, DA., BOUCHERLE, MM., BEAN, DJ. and FLETCHER, JW. 1985. Biomass of freshwater crustacean zooplankton from length-weight regressions. Canadian Journal of Fisheries and Aquatic Sciences, vol. 42, p. 1380-1390. http://dx.doi. org/10.1139/f85-173
CYR, H. and PACE, ML. 1992. Magnitude and patterns of herbivory in aquatic and terrestrial ecosystems. Nature, vol. 361, p. 148-150. http://dx.doi. org/10.1038/361148a0
DE MANUEL, J. and JAUME, D. 1994. Zooplankton from reservoirs of the Guadalquivir river basin (Spain). Archiv für Hydrobiologie, vol. 40, p. 107-116. EDMONDSON, WT. and WINBERG, GG. 1971.
A Manual on Methods for the assessment of secondary productivity in fresh waters. Oxford: Blackwell. 358 p. (IBP - Handbook, no. 17).
ESPÍNDOLA, ELG., MATSUMURA-TUNDISI, T., RIETZLER, AC. and TUNDISI, JG. 2000. Spatial heterogeneity of Tucuruí Reservoir (State of Pará, Amazonia, Brazil) and distribution of zooplankton species. Revista Brasileira de Biologia, vol. 60, p. 179-194. PMid:10959101.
ESTEVES, KE. and SENDACZ, S. 1988. Relações entre a biomassa do zooplâncton e o estado trófico de reservatórios do estado de São Paulo. Acta Limnologica Brasiliensia, vol. 11, p. 587-604.
GHADOUANI, A., ZHANG, Y. and. PREPAS, EE. 1998. Relationships between zooplankton community structure and phytoplankton in two lime-treated eutrophic hardwater lakes. Freshwater Biolog y, vol. 39, p. 775-790. http://dx.doi. org/10.1046/j.1365-2427.1998.00318.x
GONZÁLEZ, EJ., MATSUMURA-TUNDISI, T. and TUNDISI, JG. 2008. Size and dry weight of main zooplankton species in Bariri reservoir (Brazil). Brazilian Journal of Biology, vol. 68, no. 1, p. 69-75. http://dx.doi.org/10.1590/S1519-69842008000100010
HARDY, ER., ROBERTSON, B. and KOSTE, E. 1984. About the relationship between the zooplankton and fluctuating water levels of lago Camaleão, Central Amazonian várzea Lake. Amazoniana, vol. 9, p. 43-52.
HESSEN, DO. 1989. Factors determining the nutritive status and production of zooplankton in a humic lake. Journal Plankton Research, vol. 11, p. 649-664. http://dx.doi.org/10.1093/plankt/11.4.649 LORENZEN, CJ. 1967, Determination of chlorophyll
and pheo-pigments: spectrophotometric equations. Limnology & Oceanography, vol.12, no. 2, p. 343-346. http://dx.doi.org/10.4319/lo.1967.12.2.0343 LOUREIRO, BR., COSTA, SM., MACEDO, CF.,
HUSZAR, VLM. and BRANCO, CWC. 2011. Comunidades zooplanctônicas em sistemas de fauna next to the net cages, which seems to have
a predation impact mainly on adult of copepods.
References
ALMEIDA, VLS., DANTAS, EW., MELO-JÚNIOR, M., BITTENCOURT-OLIVEIRA, MC. and MOURA, AN. 2009. Zooplanktonic community of six reservoirs in northeast Brazil. Brazilian Journal Biology, vol. 69, no. 1, p. 57-65. PMid:19347146. American Public Health Association - APHA. 1992.
Standard Methods For The Examination of Water and Waste Water. 18th ed. Washington: Academic Press. p. 214- 218.
ANGELINI, R., BINI, LM. and STARLING, FLRM. 2008. Efeitos de diferentes intervenções no processo de eutrofização do lago Paranoá (Brasília - DF). Oecologia Brasiliensia, vol. 12, no. 3, p. 564-571.
ARAÚJO, MAR. and PINTO-COELHO, RM. 1998. Produção e consumo de carbono orgânico na comunidade planctônica da Represa da Pampulha, Minas Gerais, Brasil. Revista Brasileira de Biologia, vol. 58, p. 405-416.
BEVERIDGE, M. 2004. Cage Aquaculture. 3rd ed. Ames, Iowa: Blackwell Publishing.
BLETTLER, MCM. and BONECKER, CC. 2007. Longitudinal gradient of microcrustacean biomass in three tropical reservoirs (Paraná State, Brazil). Acta Scientiarum - Biological Sciences, vol. 29, no. 3, p. 297-304.
BONECKER, CC., LANSAC-TÔHA, FA., VELHO, LFM. and ROSSA, DC. 2001. The temporal distribution pattern of copepods in Corumbá reservoir, State of Goiás, Brazil. Hydrobiologia, vol. 453-454, no. 1, p. 375-384.
BOTTRELL, HH., DUNCAN, A., GLIWICZ, ZM., GRYGIEREK, E., HERZIG, A., HILLBRICHT-ILKOWSKA, A., KURASAWA, H., LARSSON, P. and WEGLENSKA, T. 1976. Are view of some problems in zooplankton production studies. Norwegian Journal of zoology, vol. 24, p. 419-456. BOZELLI, RL. and HUZSAR, VLM. 2003. Comunidades
Fito e Zooplanctônicas continentais em tempo de avaliação. Sociedade Brasileira de Limnologia. (Limnotemas, no. 3).
BRITO, SL. 2010. Produtividade secundária da comunidade Zooplanctônica e sustentabilidade de Parques Aquícolas dos Reservatórios de Furnas e Três Marias (Minas Gerais). Belo Horizonte: Universidade Federal de Minas Gerais. [Tese de Doutorado em Ecologia - Conservação e Manejo da Vida Silvestre]. BURNS, CW. 1969. Relation between filtering rate,
Federal de Santa Catarina. 36 p.[Dissertação de Mestrado em Aquicultura].
OKANO, WY. 1994. Análise da estrutura e dinâmica populacional da comunidade zooplanctônica de um reservatório artificial (Represa do Monjolinho, São Carlos-SP). São Carlos: Universidade Federal de São Carlos. 128 p. [Tese de Doutorado em Ecologia e Recursos Naturais].
PAES, JVK. 2006. A ictiofauna associada e as condições limnológicas numa área de influência da criação de tilápias em tanques-rede no reservatório de Nova Avanhandava. Botucatu: Universidade Estadual Paulista. [Dissertação de Mestrado em Zoologia]. PACE, ML. 1986. An empirical analysis of zooplankton
community size across lake trophic gradients. Limnology & Oceanography, vol. 31, p. 45-55. PACE, ML. and ORCUTT, JD. 1981. The relative
importance of protozoans, rotifers, andcrustaceans in a freshwater zooplankton community. Limnology & Oceanography, vol. 26, p. 822-830.
PERSSON, G. and EKBOHM, G. 1980. Estimation of dry weight in zooplankton populations: methods applied to crustacean populations from lakes in the Kuokkel Area, Northern Sweden. Archiv für Hydrobiologie, vol. 59, p. 225-246.
PI L L AY, T V R . 2 0 0 4 . Aq u a c u l t u re a n d t h e environment. 2nd ed. United Kingdom: Blackwell Publishing Ltd.
PINTO-COELHO, RM. 2004. Métodos de coleta, preservação, contagem e determinação de biomassa em zooplâncton de águas epicontinentais. In: BICUDO, C. E. M. and BICUDO, D. E. C. Amostragem em limnologia. São Paulo: RiMa. p. 149-166.
PINTO-COELHO, RM., BEZERRA-NETO, JF. and MORAIS-JUNIOR, CA. 2005. Effects of Eutrophication on Size and Biomass of Crustacean Zooplankton in a Tropical Reservoir. Brazilian Journal Biology, vol. 65, no. 2, p. 325-338. PMid:16097736. ROCHA, O., SENDACZ, S. and MATSUMURA-TUNDISI, T. 1995. Composition, Biomass and productivity of zooplankton in natural lakes and reservoirs of Brazil. In TUNDISI, JG., BICUDO, CEM. and MATSUMURA-TUNDISI, T., eds. Limnology in Brazil. Rio de Janeiro: ABC/SBL. p. 151-166. ROSSA, DC. 2001. Abundância e biomassa de rotíferos em
diferentes ambientes lênticos da planície de inundação do alto rio Paraná (PR/MS). Maringá: Universidade Estadual de Maringá. 39 p. [Tese de Doutorado em Ecologia de Ambientes Aquáticos Continentais]. ROSSA, DC., BONECKER, CC. and FULONE,
LJ. 2007. Biomassa de rotíferos em ambientes dulcícolas: revisão de métodos e fatores influentes. Interciencia, vol. 32, no. 4, p. 220-226.
ROSEN, RH. 1981. Length-dry weight relationships of some freshwater zooplankton. Journal of Freshwater criação de peixes. Boletim do Instituto de Pesca,
vol. 37, no. 1, p. 47-60.
MATSUMURA-TUNDISI, T. 1999. Diversidade de zooplâncton em represas do Brasil. In HENRY, R., ed. Ecologia de reservatórios: estrutura, função e aspectos sociais. Botucatu: FAPESP; FUNDBIO. p. 41-54.
MATSUMURA-TUNDISI, T., RIETZLER, AC. and TUNDISI, JG. 1989. Biomass (dry weight) and carbon content of plankton crustacea from Broa reservoir (São Carlos, SP, Brazil) and its fluctuation across one year. Hydrobiologia, vol.179, p. 229-236. http://dx.doi.org/10.1007/BF00006636
MATSUMURA-TUNDISI, T., RIETZLER, AC. and ESPÍNDOLA, ELG. 1990. Predation on Ceriodaphnia cornuta and Brachionus calyciflorus by two Mesocyclops species coexisting in Barra Bonita Reservoir. Hydrobiologia, vol. 198, p. 141-151. http:// dx.doi.org/10.1007/BF00048631
MATSUMURA-TUNDISI, T., NEUMANN-LEITÃO, S., AGUENA, LS. and MIYAHARA, J. 1996. Eutrofização da represa de Barra Bonita: estrutura e organização da comunidade de Rotifera. Revista Brasileira de Biologia, vol. 50, no. 4, p. 923-935. MASUNDIRE, HM. 1994. Mean individual dry weight
and length - weight regressions of some zooplankton of Lake Kariba. Hidrobiologia, vol. 272, p. 231-238. http://dx.doi.org/10.1007/BF00006523
MCCAULEY, E. 1984. The estimation of the abundance and biomass of zooplankton in samples. In: DOWING, JA. and RIGLER, FH., eds. A manual on methods for the assessment of secondary productivity in fresh waters. Londres: Blackwell. p. 228-261. MELÃO, MGG. 1997. A Comunidade planctônica
(fitoplancton e zooplâncton) e Produtividade Secundária do zooplâncton de um reservatório oligotrófico. São Carlos: Universidade Federal de São Carlos. 151 p. [Tese de Doutorado].
MELÃO, MGG. 1999. A produtividade secundária do zooplâncton: métodos, implicações e um estudo na Lagoa Dourada. In HENRY, R., ed. Ecologia de reservatórios: estrutura, função e aspecto sociais. FAPESP, FUNDIBIO. p. 151-183.
MELÃO, MGG. and ROCHA, O. 2000. Productivity of zooplankton in a tropical oligotrophic reservoir over short periods of time. Verhandlungen des Internationalen Verein Limnologie, vol. 27, p. 2879-2887.
MUNDAY, B., ELEFTHERIOU, A., KENTOURI, M. and DIVANACH, P. 1992. The interactions of aquaculture and the environment: A bibliographical review. Greece: Commission of European Communities Directory General for Fisheries. 183 p. NUNES, MC. 2009. Ictiofauna associada ao cultivo de peixes
Copepoda in a tropical reservoir: Barra Bonita, SP, Brazil. Brazilian Journal of Biology, vol. 67, no. 2, p. 223-233. http://dx.doi.org/10.1590/S1519-69842007000200007
SENDACZ, S., CALEFFI, S. and SANTOS-SOARES, J. 2006. Zooplankton biomass of reservoirs in different trophic conditions in the State of São Paulo, Brazil. Brazilian Journal Biology, vol. 66, p. 337-350. http://dx.doi.org/10.1590/S1519-69842006000200016
ZAR, JH. 1984. Biostatistical analysis. New Jersey: Pratice Hall. 718 p.
Received: 29 September 2011 Accepted: 05 April 2012 Ecology, vol. 1, p. 225-229. http://dx.doi.org/10.10
80/02705060.1981.9664034
RULL DEL AGUILA, LM. 2001. Gradiente trófico no Rio Sapucaí (reservatório de Furnas- MG): relação com a distribuição do zooplâncton e os usos do solo. Belo Horizonte: Universidade Federal de Minas Gerais. 75 p. [Dissertação de Mestrado em Ecologia].
RUTTNER-KOLISKO, A. 1977. Suggestions for biomass calculations of plankton rotifers. Archiv für Hydrobiologie, vol. 8, p. 71-76.