ELECTROPHYSIOLOGY ASSESSMENT OF AUDITORY
SYSTEM IN INDIVIDUALS WITH DEVELOPMENTAL
PERSISTENT STUTTERING
Avaliação eletrofisiológica do sistema auditivo em indivíduos
com gagueira desenvolvimental persistente
Simone Fiuza Regaçone(1), Mariana Banzato Stenico(1), Ana Cláudia Bianco Gução(1),
Ana Cláudia Moraes Rocha(1), Ana Carla Leite Romero(1),
Cristiane Moço Canhetti de Oliveira(1), Ana Claudia Figueiredo Frizzo(1)
(1) Universidade Estadual Paulista- Júlio de Mesquita
Filho--UNESP/ Marília-SP, Brasil.
Conlict of interest: non-existent
injury, trauma or diseases at birth2, in addition, it
may even present diferent hearing development in comparison to luent individuals3,4.
Proper neurophysiological processing of speech requires temporal coordination between the execution of motor skills and the cognitive processing performance5; and stuttering individuals subjected
to tests that assess neurological processing showed changes in auditory, temporal, linguistic and motor aspects6-8.
The neuroaudiological processes involved in luency processing can be investigated through the evaluation of central auditory processing9, which is
related to a series of processes that predominantly involve the central nervous system structures
INTRODUCTION
Stuttering is a speech disorder that may be related to several factors, such as genetic predis
-position, oral motor skills, linguistic, cognitive, emotional and environmental factors1.
A luent speech involves both organic aspects and a healthy nervous system. Stuttering may occur during the developmental process of children, when related to physical stressors, as early brain
ABSTRACT
Purpose: to describe the indings of electrophysiological examinations of individuals who stutter
and compare with typically developing individuals. Methods: 34 subjects participated in this study,
both genders, aged between 7 and 31 years. The research group consisted of 13 children (G1a) and 4 adults (G1b) diagnosed with stuttering and the control group of 13 children (G2a) with good academic performance and 4 luent adults (G2b). The auditory potentials assessment was performed on frequency and duration discrimination tests. Result: when compared groups of stuttering children
and control group, it was observed that the stuttering children had the scan frequency, increased latencies of P2, N2 components at Cz in the right ear and N2 and P3 at Fz in the left ear, and the diference amplitude P2 and P3 in the right ear Cz. In the scan duration, decreased the amplitude of the N2 and P3 components in Cz Fz in the right ear. In the group of adult stutterers was observed in the frequency sweep, increased latency P3 component at Cz and Fz in the right ear and reduced P3 amplitude at Cz in the left ear, and scan duration, increased latency of N2 Cz and P3 in the right ear and N2 at Cz in the left ear, when compared to the control group. Conclusion: there are diferences
between the electrophysiological examinations of individuals who stutter compared with those with typical development. However, further studies in this area are still needed for the indings presented here can be conirmed.
for at least 12 months and; (5) stuttering classiied as mild according to the SSI -3 Stuttering Severity Instrument17. For the control group of luent children
and adults (G1a and G1b), the inclusion criteria were: (1) no complaints of current or previous stuttering; (2) negative family history of stuttering; (3) present less than 3% of stuttering disluencies
on a evaluation.
For the control group (G1a and G1b), 17 subjects were matched according to age, gender and educa
-tional level, with good performance.
Exclusion criteria for the groups included the presence of other associated impairments, such as biological, visual, and hearing complaints, audio
-logical risk factors and/or hearing loss. These condi
-tions were detected by the specialized team through history with the leaders and participants, inspection of the external auditory canal, tympanometry and
audiometry.
In the investigation of these audiological risk factors, changes were detected in all cases, both in history and tympanometry, with type A curve in both ears and normal hearing level18.
Initially, the audiovisual recording of the subjects’ self expressive speech sample was performed both for the experimental and control groups, consisting of 200 luent syllables, using a Sony digital camcorder
and tripod.
The transcription and analysis of the speech were carried out according to the ABFW (Child Language Test - Fluency)7, which considers the types of dislu
-encies, speech rate and the frequency of breaks. Subsequently, the Stuttering Severity Instrument (SSI-4)19 was applied to the experimental group to
classify the degree of stuttering as mild, moderate,
severe or very severe.
In the second stage, for LLAEP evaluation, the Biologic Navigator Pro was used and recorded using ive disposable electrodes placed at Fz and Cz in reference to the right lobe (A2) and left (A1), using two recording channels of the equipment, the ground electrode was placed at Fpz. The impedance was kept below 5 KW.
For P300 recording, the components were studied in two scans, i.e., irstly, tone stimuli (tone burst) difering in frequency (standard stimulus: 750Hz and deviation stimulus: 1000Hz), and after (auditory cortex and pathways). The central auditory
processing assessment enables the diagnosis of the auditory gnosic process of an individual and it is performed through the application of tests that show the individual’s performance before the solution of a diicult task.
Long Latency Auditory Evoked Potentials (LLAEP) or Cognitive Potential (CP) are electro
-physiological tests that evaluate the cortical activity involved in discrimination, integration and attention skills10. They also reveal the integrity and capacity
of the central auditory nervous system (CANS)11,12,
therefore these tests have been increasingly used in the investigation of the auditory pathway of individuals with stuttering.
Despite the P300 does not accurately identify the brain activation sites, research results have showed, to some extent, that diferences in interhemispheric activation patterns can be measured pre and post treatment. In addition to issues related to the possi
-bility of diferentiating individuals for whom therapy proves more efective13.
Thus, studies on the cognitive potential in this population should be encouraged in order to clarify possible correlations between auditory aspects and luency. Given the above, this study aimed to describe the electrophysiological indings of the individuals with stuttering and to compare with luent
individuals.
METHODS
This study was approved by the Research Ethics Committee of UNESP Marilia, Sao Paulo under number 0731/2013. All participants and parents were informed about the methodological proce
-dures and signed the Informed Consent prior to any procedure.
A cross-sectional, quantitative and qualitative study, analytical type was performed. The partici
-pants were 34 individuals with and without stuttering, of both genders, aged between 7 and 31 years.
observed in P2 and P3 at Cz in the right ear, in G2a when compared to G1a (Table 1).
Table 2 shows the descriptive and inferential values of the variables studied in LLAEP duration, from the children experimental group (G2a) and the children control group (G1a).
As for the results obtained in relation to the duration test, comparing the child groups (G1a and G2a), a reduction in the amplitude of components N2 in Cz and Fz P3 in the right ear in G2a (Table 2).
Table 3 shows the descriptive and inferential values of the variables studied in the LLAEP frequency from the adult experimental group (G2b) and adult control group (G1b).
In LLAEP for the adult groups (G1b and G2b), regarding the frequency test, it was observed an increase in P3 latency at Cz and Fz in the right ear, in G2b compared to G1b. Regarding the amplitude of LLAEP components, a reduction in P3 at Cz in the left ear was observed, when comparing the two groups (G1b and G2b) (Table 3).
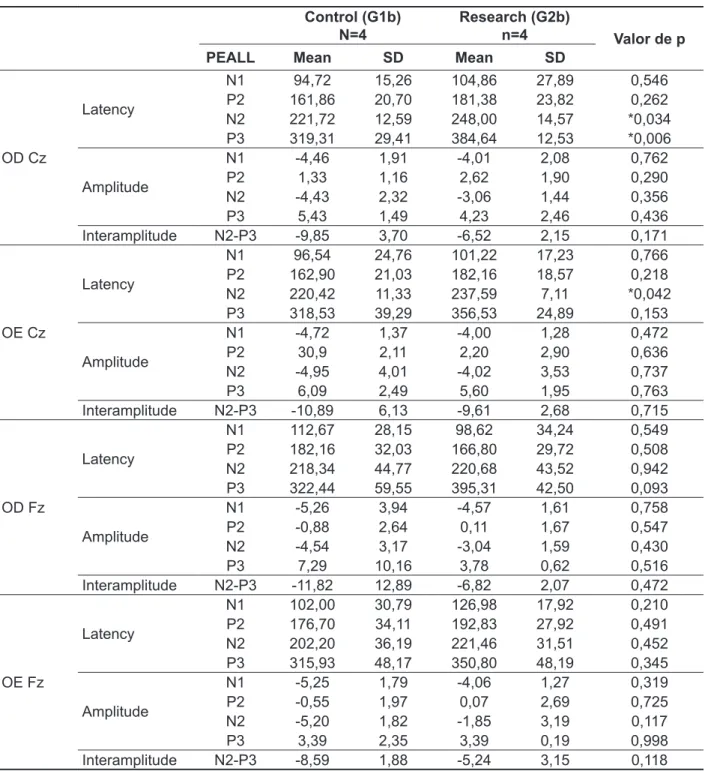
Table 4 shows the descriptive and inferential values of the variables studied in the LLAEP duration test from the adult experimental group (G2b) and adult control group (G1b).
As for the results obtained in relation to the duration study, when comparing the groups of adults (G1b and G2b), there was an increase in N2 and P3 latency at Cz in the right ear, in G2b group (Table 4). with 0.5 ilter at 30 Hz and sensitivity of 50,000 mV
and alternating polarity.
The subject was instructed to perform an active task, paying attention and discriminating the stimuli, naming them as “ine” for the frequency stimuli and “short” for the duration stimuli.
The waves N1, P2, N2 and P3 were identiied through the criteria set by Junqueira and Colafêmina20, adapted.
For the statistical analysis of data, the following was performed: descriptive statistics (mean and standard deviation) of the waves as for the latency (ms) and amplitude (microvolts), and exploratory (Student t test) to compare groups using the software STATISTICA 7.0. The adopted level of signiicance was 5% (p ≤ 0.05 *).
RESULTS
Table 1 depicts the descriptive and inferential values of the variables studied in the LLAEP frequency to the experimental group of children (G2a) and the control group of children(G1a).
The results obtained in LLAEP research from children’s groups (G1a and G2a) in relation to the frequency showed an increase in latency of compo
Table 1 – Descriptive and exploratory statistical analysis of the cognitive potential for the absolute amplitude and latencies of N1, P2, N2 and P3 components in ms, and the interamplitude N2-P3, for the record at Cz and Fz of G1 (a) child and G2 (a) child in the frequency test
Control (G1a) Research (G2a)
n=13 Valor de p
PEALL Mean SD Mean SD
OD Cz
Latency
N1 104,66 16,56 113,86 22,88 0,251 P2 163,36 31,64 192,03 33,71 *0,034 N2 218,37 24,69 244,24 35,89 *0,042 P3 323,04 21,09 339,61 41,36 0,210
Amplitude
N1 -4,41 3,29 -5,26 2,70 0,474
P2 0,76 2,21 3,33 2,41 *0,009
N2 -5,14 3,35 -4,27 4,47 0,580
P3 4,75 2,06 6,42 2,03 *0,049
Interamplitude N2-P3 -8,83 6,22 -9,54 6,79 0,784
OE Cz
Latency
N1 101,38 18,72 105,64 18,98 0,534 P2 151,75 35,68 172,49 35,44 0,150 N2 208,93 26,88 221,50 38,93 0,347 P3 328,88 29,35 348,81 29,42 0,169
Amplitude
N1 -4,10 2,30 -4,55 2,60 0,464 P2 1,35 2,74 2,65 2,71 0,236 N2 -5,02 3,34 -3,22 4,99 0,363 P3 6,15 3,48 8,16 1,80 0,071
Interamplitude N2-P3 -6,62 10,67 -11,68 5,64 0,143
OD Fz
Latency
N1 118,28 24,98 121,88 28,37 0,734 P2 170,89 42,65 191,47 48,19 0,260 N2 213,17 36,83 240,96 36,92 0,066 P3 325,04 25,54 348,90 45,66 0,113
Amplitude
N1 -4,26 2,98 -5,15 2,38 0,408 P2 -0,66 2,19 0,98 2,47 0,085 N2 -4,66 3,02 -4,22 3,62 0,738 P3 3,15 2,03 4,70 3,74 0,199
Interamplitude N2-P3 -5,77 6,53 -8,13 7,28 0,393
OE Fz
Latency
N1 109,63 25,34 112,84 21,24 0,738 P2 154,47 24,70 181,38 45,96 0,051 N2 201,00 19,90 233,17 47,50 *0,023 P3 319,99 23,63 350,98 39,62 *0,032
Amplitude
N1 -4,17 2,72 -6,06 3,14 0,080 P2 -0,72 2,94 0,82 3,08 0,219 N2 -6,04 3,61 -5,00 4,70 0,495 P3 4,53 2,51 5,96 3,02 0,330
Interamplitude N2-P3 -8,27 7,81 -9,04 7,38 0,798
Table 2 – Descriptive and exploratory statistical analysis of the cognitive potential for the absolute amplitude and latencies of N1, P2, N2 and P3 components in ms, and the interamplitude N2-P3, for the record at Cz and Fz GI (a) child and GII (a) child in the duration test
Control (G1a) n=13
Research G2a)
n=13 Valor de p
PEALL Mean SD Mean SD
OD Cz
Latency
N1 104,42 14,00 103,54 20,29 0,898 P2 159,84 19,06 168,08 15,78 0,241 N2 220,62 25,09 237,59 28,56 0,120 P3 337,69 30,13 352,11 38,18 0,295
Amplitude
N1 -3,98 3,19 -4,78 1,67 0,430 P2 1,47 2,76 1,90 2,85 0,700 N2 -6,40 2,52 -4,00 2,45 *0,021 P3 5,45 2,31 5,17 2,31 0,764
Interamplitude N2-P3 -10,01 7,82 -8,07 4,96 0,458
OE Cz
Latency
N1 107,47 24,38 111,20 23,38 0,791 P2 162,72 29,86 184,76 26,36 0,082 N2 226,54 33,14 245,49 23,73 0,148 P3 333,69 31,00 341,17 31,69 0,720
Amplitude
N1 -4,23 2,74 -3,85 1,06 0,663 P2 2,09 2,92 2,26 2,35 0,944 N2 -5,29 3,75 -14,65 64,98 0,305 P3 5,85 2,97 5,54 3,29 0,728
Interamplitude N2-P3 -8,85 9,43 -9,73 3,44 0,752
OD Fz
Latency
N1 117,88 21,20 111,07 23,99 0,450 P2 166,97 36,45 152,47 17,80 0,508 N2 207,16 27,08 211,81 32,81 0,697 P3 333,29 17,36 334,57 44,63 0,924
Amplitude
N1 -5,05 3,71 -3,76 2,65 0,318 P2 -0,31 2,41 0,12 2,51 0,843 N2 -5,50 2,65 -5,42 2,75 0,942
P3 5,93 2,93 3,11 1,89 *0,007
Interamplitude N2-P3 -11,43 4,72 -7,20 5,90 0,054
OE Fz
Latency
N1 113,39 19,92 113,80 25,09 0,870 P2 155,75 25,38 170,79 29,96 0,232 N2 196,27 32,68 210,53 25,09 0,214 P3 320,23 20,61 339,53 40,59 0,428
Amplitude
N1 -4,20 3,22 -5,48 2,05 0,342 P2 -0,79 3,29 -1,51 2,20 0,548 N2 -4,79 3,25 -5,41 3,04 0,753 P3 5,11 2,54 3,92 1,54 0,173
Interamplitude N2-P3 -7,52 8,32 -9,07 3,35 0,538
Table 3 – Descriptive and exploratory statistical analysis of the cognitive potential, for the absolute amplitude and latencies of N1, P2, N2 and P3 components in ms, and the interamplitude N2-P3, for the record at Cz and Fz adult G1B and adult G2B in the frequency test
Control (G1b) n=4
Research (G2b)
N=4 Valor de p
PEALL Mean SD Mean SD
OD Cz
Latency
N1 88,99 16,34 107,21 17,13 0,170 P2 145,98 20,80 182,42 29,20 0,088 N2 203,50 19,22 237,60 37,28 0,155 P3 301,61 19,41 360,69 39,07 *0,035
Amplitude
N1 -5,91 3,24 -4,89 2,05 0,614 P2 2,21 0,77 3,00 2,69 0,592 N2 -4,80 1,57 -3,70 4,73 0,672 P3 8,55 4,00 7,14 2,39 0,569
Interamplitude N2-P3 -13,35 5,24 -10,84 6,89 0,583
OE Cz
Latency
N1 102,78 17,43 106,16 25,42 0,833 P2 152,75 11,29 169,15 12,65 0,101 N2 201,42 18,57 228,49 34,00 0,211 P3 280,79 23,52 337,53 50,73 0,088
Amplitude
N1 -6,77 0,81 -2,32 4,35 0,090 P2 3,66 1,66 2,00 2,02 0,250 N2 -4,03 1,35 -4,69 3,40 0,727
P3 9,89 1,45 6,51 1,22 *0,011
Interamplitude N2-P3 -13,91 2,65 -11,20 4,48 0,336
OD Fz
Latency
N1 93,67 17,57 109,55 21,90 0,301 P2 171,75 24,74 201,16 53,73 0,358 N2 207,93 28,35 256,07 41,65 0,104 P3 300,05 43,62 380,74 34,74 *0,027
Amplitude
N1 -7,21 1,92 -5,96 2,07 0,412 P2 -0,46 1,13 1,01 2,71 0,353 N2 -4,21 2,75 -3,60 3,71 0,802 P3 8,04 7,53 6,52 4,37 0,739
Interamplitude N2-P3 -12,25 7,76 -10,12 8,01 0,715
OE Fz
Latency
N1 113,45 22,54 107,73 19,37 0,713 P2 172,79 17,76 197,77 20,53 0,095 N2 178,37 106,12 235,51 20,94 0,331 P3 290,68 47,14 353,67 50,84 0,119
Amplitude
N1 -3,84 7,37 -5,36 1,90 0,704 P2 1,60 2,75 0,68 1,65 0,587 N2 -3,80 1,42 -3,25 1,67 0,631 P3 6,03 4,11 5,10 2,62 0,714
Interamplitude N2-P3 -9,82 4,27 -8,34 4,27 0,642
Table 4 – Descriptive and exploratory statistical analysis of the cognitive potential for the absolute amplitude and latencies of N1, P2, N2 and P3 components in ms, and the interamplitude N2-P3, for the record at Cz and Fz G1 (b) adult and G2 (b) adult duration test
Control (G1b) N=4
Research (G2b)
n=4 Valor de p
PEALL Mean SD Mean SD
OD Cz
Latency
N1 94,72 15,26 104,86 27,89 0,546 P2 161,86 20,70 181,38 23,82 0,262 N2 221,72 12,59 248,00 14,57 *0,034 P3 319,31 29,41 384,64 12,53 *0,006
Amplitude
N1 -4,46 1,91 -4,01 2,08 0,762 P2 1,33 1,16 2,62 1,90 0,290 N2 -4,43 2,32 -3,06 1,44 0,356 P3 5,43 1,49 4,23 2,46 0,436
Interamplitude N2-P3 -9,85 3,70 -6,52 2,15 0,171
OE Cz
Latency
N1 96,54 24,76 101,22 17,23 0,766 P2 162,90 21,03 182,16 18,57 0,218 N2 220,42 11,33 237,59 7,11 *0,042 P3 318,53 39,29 356,53 24,89 0,153
Amplitude
N1 -4,72 1,37 -4,00 1,28 0,472 P2 30,9 2,11 2,20 2,90 0,636 N2 -4,95 4,01 -4,02 3,53 0,737 P3 6,09 2,49 5,60 1,95 0,763
Interamplitude N2-P3 -10,89 6,13 -9,61 2,68 0,715
OD Fz
Latency
N1 112,67 28,15 98,62 34,24 0,549 P2 182,16 32,03 166,80 29,72 0,508 N2 218,34 44,77 220,68 43,52 0,942 P3 322,44 59,55 395,31 42,50 0,093
Amplitude
N1 -5,26 3,94 -4,57 1,61 0,758 P2 -0,88 2,64 0,11 1,67 0,547 N2 -4,54 3,17 -3,04 1,59 0,430 P3 7,29 10,16 3,78 0,62 0,516
Interamplitude N2-P3 -11,82 12,89 -6,82 2,07 0,472
OE Fz
Latency
N1 102,00 30,79 126,98 17,92 0,210 P2 176,70 34,11 192,83 27,92 0,491 N2 202,20 36,19 221,46 31,51 0,452 P3 315,93 48,17 350,80 48,19 0,345
Amplitude
N1 -5,25 1,79 -4,06 1,27 0,319 P2 -0,55 1,97 0,07 2,69 0,725 N2 -5,20 1,82 -1,85 3,19 0,117 P3 3,39 2,35 3,39 0,19 0,998
Interamplitude N2-P3 -8,59 1,88 -5,24 3,15 0,118
and state of attention and represents the activity of the supratemporal auditory cortex 26-28.
In this study we found changes in the P3 and N2 components for latency and amplitude in the stuttering children group (G1b) and stuttering adult group (G2b). When studied from non-linguistic stimuli using the oddball paradigm, the electrophysi
-ological responses relect the attention and auditory discrimination skills.
Especially in stuttering adult patients, the perception of the acoustic characteristics is performed with less precision and a longer reaction time to the target stimulus due to an impaired non-linguistic processing, which results in abnormal waveform patterns as observed in this study in stuttering in adults and children 29,30.
The P3 is generated from endogenous charac
-teristics related to cognition, more speciically to the identiication task and appointment of stimuli23.
Despite the P300 does not accurately identify the brain activation sites to be related to the associative auditory cortex28 and to be generated from the
activation of diferent areas of the cortex, the results of the study show the diferences in the pattern of inter-hemispheric activation between stuttering and luent people2,25,29. Studies24,25 have showed
diferences especially regarding the latency in P3 component in stuttering and luent.
CONCLUSION
There are diferences between the electrophysi
-ological tests of individuals with stuttering compared to luent ones. However, further studies in this area are still needed before the indings presented here may be conirmed and allow progress to new proposals for evaluation of stuttering.
DISCUSSION
In this study, neuroaudiolpgical processes involved in luency processing were investigated by evaluating auditory evoked potentials. When subjected to the tests that evaluated the neurological processing in the auditory and linguistic aspects7,8,
the individuals with stuttering showed neurophysi
-ological diiculties.
The literature has described functional difer
-ences in stutterers in the pattern of hemispheric activity in response to linguistic and non-linguistic stimuli, diferences in neuro-magnetic response and
P300 amplitude21,22.
When the luent children group (G1a) and stuttering children group (G2a) were analyzed, diferences were observed as to P3 amplitude, regardless of the stimulated ear.
As for the luent adult group (GI1b) and stuttering adult group (G2b), diferences in the P3 amplitude, shorter when right ear was stimulated, identiied to capture electrical activity in the midline of the cortex (Cz). Auditory Evoked Potentials are generated from the activation of thalamic-cortical pathways, primary auditory cortex and cortex. In general, latency spikes of auditory evoked potentials of stuttering people difer from luent ones23-25.
The P2 component is an exogenous potential and its generation is related to the central auditory system responses to physical and acoustic param
-eters of auditory stimuli and represent the activation of the supratemporal laterofrontal auditory cortex. The N2 component is a mixed potential that has characteristics relating to exogenous and endog
-enous responses involved in the reception and interpretation of the physical and acoustic infor
8. Biermann-Ruben K, Salmelin R, Schnitzler A. Right rolandic activation during speech perception in stutterers:a MEG study. Neuroimage.
2005;25(3):793-801.
9. Schiefer A, Barbosa LMG, Pereira LD. Conside-rações preliminares entre uma possível correlação entre gagueira e os aspectos lingüísticos e audi tivos.
Pró-Fono R Atual Cient. 1999;1(1):31-7.
10. Mcpherson DL. Late potentials of the auditory system. San Diego: Singular Publishing Group,
1996.
11. Baran JA, Musiek FE. Behavioral assessment of the central auditory nervous system. In: Rintelmann W. F (Ed). Hearing Assessment. 2nd Ed. Boston:
Allyn & Bacon, 1991.
12. Schochat E, Matas CG, Sanches SGG, Carvallo
RMM, Matas S. Central auditory evaluation in
multiple sclerosis: case report. Arquivos de
Neuro-Psiquiatria. 2006;64(3):872-6.
13. Andrade CRF, Sassi FC, Matas CG, Neves IF, Martins VO. Potenciais evocados auditivos pré e pós-tratamento em indivíduos gagos: estudo piloto.
Pró-Fono R Atual Cient. 2007;19(4):401-5.
14. Riley GD. A stuttering severity instrument for children and adults. SSI-3. 3rd ed. Austin: ProEd;
1994.
15. Yairi E, Ambrose N. Onset of stuttering in
preschool children: select factors. J Speech Lang Hear Res. 1992;35(4):783-8.
16. Bloodstein O. A handbook on stuttering. Chicago:
National Easter Seal Society; 1995.
REFERENCES
1. Smith A, Kelly E. Stuttering: A dynamic, multifactorial model. In: Curlee RF, Siegel GM. (Org) Nature and treatment of stuttering: New directions. Needham Heights: Allyn & Bacon. 1997. P. 204-17. 2. Oliveira CMC, Souza HA, Santos AC, Cunha DS. Análise dos fatores de risco para gagueira em crianças disluentes sem recorrência familial. Rev CEFAC [online]. 2012 [acesso em 2014 abr 24]; 14(6): 1028-35. Disponível em: http://www.scielo.br/ pdf/rcefac/v14n6/212-10.pdf
3. Fox PT, Ingham RJ, Ingham JC, Hirsch TB, Downs JH, Martin C et al. A PET study of the neural systems of stuttering. Nature. 1996;382:158-62. 4. Howel P, Williams SM. Development of Auditory Sensibility in Children who Stutter and Fluent Children.Ear & Hearing. 2004;25(3):265-73.
5. Andrade CRF, Cervane LM, Sassi FC. Relationship between the stuttering severity index and speech rate. Medical Journal. 2003;121(2):81-4.
6. Bosshardt HG, Ballmer W, De Nil LF. Efects of category and rhyme decisions on sentence production. Journal Speech Language Hearing Research. 2002;45(5):844-58.
7. Andrade CRF. Abordagem neurolingüística e motora da gagueira. In: Ferreira, Ferreira, LP; Bei-Lopes, D; Limongi, SC. O.Tratado de Fonoaudiologia. São Paulo: Roca, 2004. P. 1001-16.
RESUMO
Objetivo: descrever os achados dos exames eletroisiológicos de indivíduos com gagueira e compa
-rar com indivíduos com desenvolvimento típico. Métodos: participaram desta pesquisa 34 indivíduos,
de ambos aos gêneros, com idade entre 7 e 31 anos. O grupo pesquisa foi constituído por 13 crianças (G1a) e 4 adultos (G1b) diagnosticadas com gagueira e o grupo controle por 13 crianças (G2a) com bom desempenho acadêmico e 4 adultos (G2b) com desenvolvimento típico. Foi realizada a avalia
-ção dos potenciais auditivos, na varredura de frequência e de dura-ção. Resultado: quando compa
-rados os grupos de crianças gagas e controle, foi observado que as crianças gagas apresentaram na varredura de frequência, aumento da latência dos componentes P2, N2 em Cz na orelha direita e N2 e P3 em Fz na orelha esquerda, e diferença na amplitude de P2 e P3 em Cz na orelha direita. Na varredura de duração, houve redução da amplitude dos componentes N2 em Cz e P3 em Fz na orelha direita. Já no grupo de adultos gagos, observou-se na varredura de frequência, aumento da latência no componente P3 em Cz e Fz na orelha direita e amplitude reduzida no P3 em Cz na orelha esquerda, e na varredura de duração, aumento de latência de N2 e P3 em Cz na orelha direita e N2 em Cz na orelha esquerda, quando comparados ao grupo controle. Conclusão: há diferenças entre
os exames eletroisiológicos de indivíduos com gagueira comparados aqueles com desenvolvimento típico. No entanto, novos estudos neste âmbito ainda são necessários para que os achados aqui apresentados possam ser conirmados.
pós-tratamento em indivíduos gagos: estudo piloto.
Pró-Fono R Atual Cient. 2007;19(4):401-5.
25. Angrisani RMG, Matas CG, Neves IF, Sassi FC, Andrade CRF. Avaliação eletroisiológica da audição em gagos, pré e pós terapia fonoaudiológica.
Pró-Fono R Atual Cient. 2009;21(2):95-100.
26. Hansen JC, Hillyard SA. Temporal dynamics of human auditory selective attention. Psychophysiology. 1988;25:316-29.
27. Oades RD, Dittmann-Balcar A, Schepker R, Eggers C, Zerbin D. Auditory event-related potentials (ERPs) and mismatch negativity (MMN) in healthy children and those with attention-deicit or tourette/tic symptoms. Biological Psychology.
1996;12:163-85.
28. Hall J. Handbook of auditory evoked responses. Boston: Allyn & Bacon, 2006.
29. Hampton A, Weber-Fox C. Nonlinguistic auditory processing in adults who stutter. Journal of Fluency
Disorders. 2008;33(4):253-330.
30. Preibisch C, Raab P, Neumann K, Euler HA, Von Gudenberg AW, Gall V et al. Event-related fMRI for the suppression of speech-associated artifacts in stuttering. NeuroImage. 2003;19(3):1076-84.
http://dx.doi.org/10.1590/1982-0216201517610114 17. Yairi E, Ambrose NG, Cox N. Genetics of stuttering: a critical review. J Speech Lang Hear
Res. 1996;39:771-84.
18. Jerger J. Clinical experience with impedance audiometry. Arch Otolaryngol.1970;92(4):311-24. 19. Riley G. Stuttering severity instrument for young children (SSI-4) (4°ed.). Austin, TX: Pro-Ed. 2009. 20. Junqueira CAO, Colafêmina JF. Investigação da estabilidade inter e intra-examinador na identiicação do P300 auditivo: análise de erros. Rev Bras Otorrinolaringol. 2002;68(4):468-78. 21. Salmelin R, Schnitzler A, Scmitz F, Jancke L, Witte OW, Freund HJ. Functional organization of the auditory cortex is diferent in stutterers and luent speakers. Neuroreport. 1998;13(9-10):2225-9. 22. Morgan MD, Cranford JL, Burk K. P300
event-related potentials in stutterers and nonstutterers.
Journal Speech Language Hearing Research.
1997;40(6):1334-40.
23. Eggermont JJ, Ponton CW. The neurophysiology of auditory perception: From single units to evoked potentials. Audiology and Neuro-Otology.
2002;7(2):71-99.