1,2Mestranda, Laboratório de Mapeamento Cerebral e Integração Sensório-Motora, Instituto de Psiquiatria (IPUB), Universidade Federal do Rio de Janeiro RJ, Brasil (UFRJ); 3D.Sc. em Engenharia Biomédica, COPPE, UFRJ; 4PhD, Department of Kinesiology and Program in Neuroscience and Cognitive Science, University of Maryland, College Park, USA.; 5Professor Adjunto II Doutor, Escola de Educação Física e Desportos (EEFD), UFRJ; 6Professor Adjunto III Doutor, Coordenador do Laboratório de Mapeamento Cerebral e Integração Sensório-Motora, IPUB, UFRJ; 7Professor Adjunto II PhD, EEFD, Laboratório de Mapeamento Cerebral e Integração Sensório-Motora, IPUB, UFRJ; Professor Pesquisador, Universidade Castelo Branco (PROCIMH-UCB).
Received 30 September 2003, received in final form 20 February 2004. Accepted 16 March 2004.
Dra. Heloisa Veiga D. Alves - Instituto de Psiquiatria (IPUB), Laboratório de Mapeamento Cerebral e Integração Sensório-Motora, Universidade Federal do Rio de Janeiro (UFRJ) - Avenida Venceslau Brás 71 / fundos - 22290-140 Rio de Janeiro RJ - Brasil. E-mail: [email protected]
VISUAL EVENT-RELATED POTENTIAL (P300)
A normative study
Heloisa Veiga
1, Andréa Deslandes
2, Maurício Cagy
3, Kaleb McDowell
4,
Fernando Pompeu
5, Roberto Piedade
6, Pedro Ribeiro
7ABSTRACT - The P300 component of the Event-Related Potential (ERP) is a general measurement of “cog-nitive efficiency”. It is an index of the ability of an individual’s Central Nervous System (CNS) to process incoming information. Objective:To develop a normative database for the visual P300. Methodology:
30 right-handed individuals (same number of each sex), between 20 and 30 years of age, healthy, free of any cognitive impairment and not making use of psychoactive substances. Participants were submitted to a visual discrimination task, which employed the “oddball” paradigm. Results: The expected scalp distri-bution trend was seen for latency but not for amplitude values. Conclusion:A high variability of laten-cy and amplitude values was observed across the age span. Mean reaction time for the entire sample of the study was 391.56 + 37.03 ms.
KEY WORDS: event-related potential, P300.
Potencial evocado visual relacionado a evento (P300): estudo normativo
RESUMO - O componente P300 do Potencial Evocado Relacionado a Evento é uma medida geral de “efi-ciência cognitiva” e um índice da qualidade do processamento e armazenamento de informações pelo sis-tema nervoso central. Objetivo: Desenvolvimento de um banco normativo do P300 visual. Metodologia:
30 sujeitos destros (ambos os sexos), entre 20 e 30 anos de idade, sadios e livres de qualquer déficit cogni-tivo. Os sujeitos não estavam fazendo uso de substâncias psicotrópicas ou psicoativas e foram submetidos a uma tarefa de discriminação visual utilizando o paradigma “oddball”. Resultados: O padrão de distribuição cortical esperado foi observado para os valores de latência, mas não para os de amplitude. Conclusão:
Foi observada grande variabilidade dos valores de latência e amplitude no grupo analisado. O tempo de reação médio da amostra foi 391,56 + 37,03 ms.
PALAVRAS-CHAVE: potencial evocado relacionado a evento, P300.
In the late 1960’s, a careful analysis of the elec-troencephalogram (EEG) revealed that the presen-tation of a stimulus produces specific changes in the brain1. During the presentation of a stimulus,
there is a significant increase in synaptic activity in millions of neurons simultaneously. Changes in the membranes’ potentials occur in a fraction of a second, after the stimulus is presented, in distinct regions of the brain. Since these synaptic poten-tials are evoked by a stimulus, they occur in a syn-chronized way. The combined electrical
respons-es of this neuronal population are known as Evoked Potentials2. The Evoked Potentials (EP) or
distinction must be made between the different types of ERP’s. Potentials whose characteristics are controlled by the physical properties of the stimu-lus are classified as “exogenous”. On the other hand, potentials whose characteristics are determi-ned by the nature of the interaction between the individual and the stimulus are classified as “endo-genous”. The Endogenous Evoked Potentials are long-latency potentials related to aspects of cognitive processing4. For this reason, they became the focus
of studies related to cerebral functioning.
The ERP has demonstrated reasonable success among the various electrophysiological techniques as a means to assess disturbances in cognitive func-tion. Specifically, this neuroelectric measure has pla-yed a crucial role in the quantification and under-standing of age-related cognitive changes5. The
mapping of EP provides direct evidences of the rela-tionship between the integrity of the central nerv-ous system (CNS) and aging6. During the aging
process, CNS function slows down due to neurobi-ological modifications7. Along this vein, the P300
component of the EP becomes a valuable tool in the study of this process, because it is thought to result from neural activity associated with attentio-nal and memory processes8,9. Once the P300 is
evo-ked by stimuli that require a higher level of cogni-tive processing, it provides clear evidence of the significant slowing down of the CNS during nor-mal and pathological aging processes10,11.
The need to develop a normative database is mostly due to the lack of a specific P300 database for the Brazilian population. The need to develop such database is also due to the great result variabi-lity within a subject and among subjects, caused by different variables, such as: type of task emplo-yed, subject’s psychophysiological state, attention allocation at the exact moment of the visual stim-ulus display, among others. To achieve this goal, two variables are used in the quantification of the P300: latency, which reflects the time required to allocate resources and engage memory updating for a given task, and amplitude, which indexes at-tentional resource allocation for immediate mem-ory processes. Individual differences in P300 values provide a reliable indication of the variability in neuroelectric processing capability and speed of the brain’s attentional and mnestic mechanisms. The P300 component can assay the mental changes brought on by normal aging and cognitive disea-ses, as well as motor disturbances12,13 associated with
information processing. Therefore, the develop-ment of a normative database provides a more
pre-cise evaluation of psychiatric, neurological and motor disorders and their impact on cognitive functions14,15. Considering that the definition of
nor-mal component values and the most appropriate method for their acquisition have still not been well characterized, the development of a database be-comes essential in the process of enhancing the use-fullness of this neurophysiological tool.
METHOD
Subjects -The sample consisted of 30 individuals, 15 male and 15 female, with ages ranging from 20 to 30 years. Subjects were selected among undergraduate and graduate students from different institutions in Rio de Janeiro. All subjects were healthy, free of cognitive deficits and were not making use of any psychoactive or psychotropic substance at the time of the test. To as-sure that subjects did not present any impairment of their physical and mental health, and to identify and exclude from the experiment any subjects who could contamina-te future results, a questionnaire was applied. The ques-tionnaire also aimed at identifying possible P300 biologi-cal determinants, such as food intake, body temperature, fatigue, drugs, among others. Laterality was used as an exclusion criterion. The Edinburgh Inventory16was used
to assess laterality and exclude left-handed individuals from the experiment. Subjects signed a consent form, where the experimental condition was thoroughly des-cribed. The experiment was submitted to the Psychiatric Institute’s ethics committee for approval.
Experimental procedures - A sound-attenuated room was prepared for data acquisition. Subjects were seat-ed comfortably in a chair with arm-rest to minimize muscular artifacts. During the visual task, lights were tur-ned off for subjects to concentrate exclusively on the mo-nitor screen. A 15” Samsung momo-nitor was placed in front of the individual. The visual stimulus was present-ed on the monitor by the ERP acquisition software, de-veloped in DELPHI 5.0.
To elicit the P300, all subjects were submitted to the same visual discrimination task, which employed the “oddball” paradigm. In this paradigm, two stimuli are presented randomly, with one occurring infrequently17.
appeared on the screen for 0.75 seconds, with the same time interval between stimuli.
Data acquisition - International 10/20 System18for
ele-ctrode placement (referred to linked earlobes) was used with a 20-channel Braintech-3000 (EMSA-Medical Instru-ments, Brazil). The 19 monopolar electrodes were arran-ged in a nylon cap (ElectroCap Inc., Fairfax, VA). Impe-dance for EEG and EOG electrodes were under 5 KΩand 20 KΩ, respectively. Visual inspection was employed for detection and elimination of artifacts. The data acquired had total amplitude of less than 100 µV. The signal was amplified with a gain of 22,000. The EEG signals were acquired between 0.01 and 50 Hz. Eye-movement (EOG) artifact was monitored with a bipolar electrode monta-ge using two 9-mm diameter electrodes attached above and on the external canthus of the right eye. Moreover, Independent Component Analysis (ICA) was applied to remove possible sources of artifacts. The EEG signal was analogically filtered between 0.01 Hz (high-pass) and 100 Hz (low-pass), and sampled at 240 Hz. The software ERP Acquisition (Delphi 5.0), developed at the Brain Mapping and Sensorimotor Integration Lab, was employed with the following digital filters: Notch (60 Hz), high-pass of 0.3 Hz and low-pass of 25 Hz.
Average processing - The program Average(MATLAB 5.3), which implements filter and epoch selection routi-nes, was used to process acquired data. After data were acquired and stored, the average software loaded the data and established different routines. Specific filters were set up: a high-pass filter of 0.1 Hz and a low-pass of 20 Hz. The target stimulus (square) was selected as the trigger-stimulus. Epochs (i.e., visualization windows) were set to begin at the time of stimulus onset until 700 ms after. After specific channels were selected (Fz, Cz, and Pz), data were averaged and represented graphi-cally in terms of latency (x-axis) and amplitude (y-axis).
Component analysis -The P300 component was iden-tified as the most positive component within the laten-cy window of 250-500 ms. Amplitude was measured rel-ative to a pre-stimulus baseline, with peak latency de-fined as the time point of maximum positive amplitude within the specific latency window.
Statistical analysis - In order to develop the normati-ve database, the following statistical analyses were ap-plied: 1) The average of each subject (i.e., 100 trials/block) was calculated individually for amplitude and latency val-ues, in Fz, Cz, and Pz electrodes separately; 2) The aver-age of blocks I and II was then calculated for each sub-ject for the same variables (i.e., amplitude and latency) and in the same electrode sites; 3) A descriptive statisti-cal analysis (mean/sd) was made for the entire sample of the study (20-30 years), following the same parame-ters specified above; 4) A linear regression analysis was
applied to the amplitude and latency variables separate-ly, in relation to age, to describe the rate of decrease (amplitude), increase (latency), and dispersion along the specific age span, in the three electrode sites; 5) P300 amplitude and latency were then assessed by a two-way ANOVA (age group x electrode site). The distinct age groups were divided as follows: 20-23, 24-27, and 28-31 years. A Post Hoc (Scheffé) was applied a posteriori; 6) A one-way (electrode site) ANOVA, followed by a Post Hoc (Tukey) test, was performed for latency and amplitu--de values, in Fz, Cz, and Pz electroamplitu--de sites, to verify whether electrodes were significantly different; 7) Finally, individual Reaction Time averages (blocks I and II) were collapsed, yielding a great mean for the entire sample of the study.
RESULTS
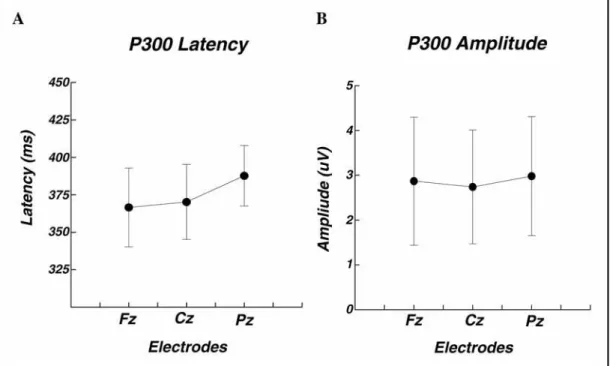
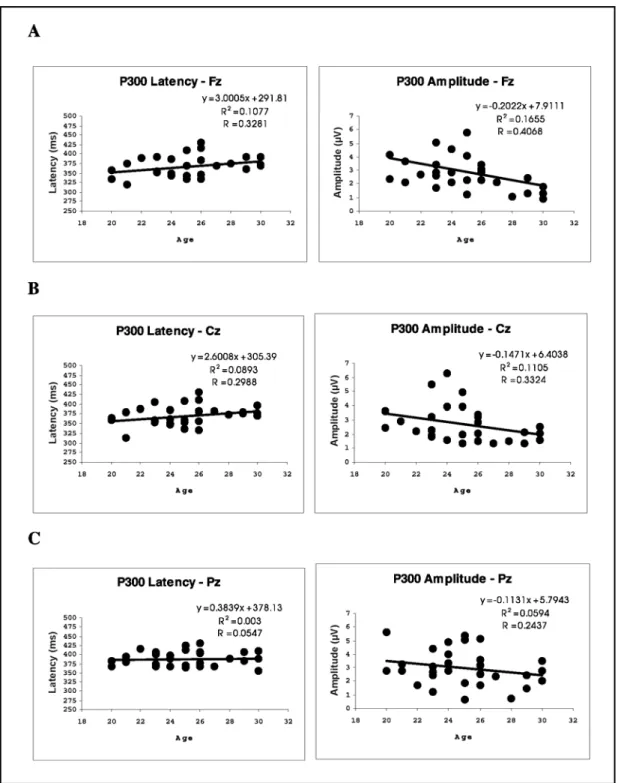
Figure 1 illustrates the grand mean for the enti-re sample of the study in each electrode site. Fig. 1-A shows an increment in latency values: Fz = 366.63 + 26.29 ms, Cz = 370.24 + 25.04 ms, Pz = 387.70 + 20.16 ms. ANOVA results indicated a significant diffe-rence across electrode sites (p = .002). The Post Hoc (Tukey) analysis revealed differences between Fz-Pz (p = .003) and Cz-Pz (p = .016). Fig. 1-B illustrates amplitude variations across electrode sites: Fz = 2.87 + 1.43 µV, Cz = 2.74 + 1.27 µV, Pz = 2.98 + 1.33 µV. No significant differences were observed (p = .790). Figure 2 represents the linear regression analy-sis applied to the amplitude and latency variables separately, in relation to age. The plot describes the rate of decrease (amplitude), increase (laten-cy), and dispersion along the specific age span, for each electrode site separately. Latency R val-ues are: Fz (R = .3281), Cz (R = .2988) and Pz (R = .0547). Amplitude R values are: Fz (R = .4068), Cz (R = .3324) and Pz (R = .2437). The figure also shows linear equations for the regression analysis.
As specified previously, mean reaction time was calculated to ensure subjects’ alertness during the visual task. Mean reaction time for the entire sam-ple of the study was 391.56 + 37.03 ms.
DISCUSSION
The present study aimed at developing a P300 normative database. This ERP component has pro-ven to be a valuable asset to cognitive research as a neuroelectric index of age-related changes. P300 analyses indicate the way in which brain process-es information. In this sense, a normative database is crucial for the comparison between normal sub-jects and distinct patient populations, providing a more precise evaluation of the impact of psychi-atric, neurological and motor disorders on cogniti-ve functions. It is known that with increased age, there is a change in the speed with which the ner-vous system responds to external stimuli19. In
oth-er words, as adults age, thoth-ere is a slowing of neu-ral transmission time, which results in cognitive dis-functions8,17. Specifically, an increase in latency
and a decrease in amplitude are observed in eld-erly adults. Furthermore, it is also known that neu-ro-degenerative diseases affect the anatomy of the brain, and consequently, its function20. Common
neuro-degenerative diseases, such as Alzheimer’s disease, Parkinson’s disease, and multiple sclero-sis often increase P300 latency. Moreover, studies
have reported that some pharmaceuticals affect the latency of ERP’s21. These substances may directly
affect the transmission speed of neurons or the sub-ject’s alertness and, thus, affect component val-ues22,23. In this sense, P300 becomes a useful
neuro-electric measure for evaluating therapeutic strate-gies involving CNS medications.
Although normative studies have shown an in-crease in latency and a dein-crease in amplitude in a given age span11,24,25, the present results did not
con-firm this pattern for the specific sample used in the study (i.e., 20-30 years). The dispersion around the regression line (Fig 2) indicates a considerable vari-ability of both latency and amplitude values. Spe-cifically, the linear regression has high variability and a low level of predictability for the single age decade analyzed. This low level of predictability was constant across electrode sites, suggesting that only one decade is not sufficient to produce chan-ges in P300 latency and amplitude, even though P300 latency showed less variability than amplitude. Moreover, when the age span was divided into three groups (i.e., every three years) (Fig 3), no inter-action between age group and electrode site was found in either variable (i.e., latency and amplitu-de). This finding can be explained by the fact that the pattern of amplitude and latency distribution across different electrodes occurs independently from the individuals’ age. This fact also explains
Fig 2. P300 latency and amplitude as a function of age, in Fz (A), Cz (B), and Pz (C) electrode sites. The scattergram describes the rate of decrease (amplitude), increase (latency), and dispersion along the specific age span (20-30 years).
why the only main effect was found for electrode site. The absence of a main age group effect is related to the study’s design, which analyzed one single decade, as dis-cussed above.
Previous studies have reported that P300 latency increases from the anterior to the posterior scalp areas, i.e., from Fz
(frontal), to Cz (central), and Pz (parietal) electrode sites 8,17,26. This trend was
anterior to the posterior scalp areas8. The trend
observed in the present study is shown in Figure 1-B. The result of the statistical analysis indicated that, despite the contradictory trend, the differ-ences between the amplitude values in the three electrode sites were not significant. Furthermore, amplitude values were similar to previous ex-periments27, where the oddball paradigm was
em-ployed with a visual task. Ambiguous amplitude patterns have been reported by different labora-tories, which can be explained by the specific vari-ables used in the studies. With respect to reaction time, our result is also in agreement with the lit-erature, which states that P300 latency is general-ly unrelated to response selection processes and in-dependent of behavioral reaction time28. Once
la-tency reflects the processing time prior to the motor response, the mean latency at Pz (i.e., 387.70 + 20.16 ms), where the P300 component is more prominent, should be shorter than the mean re-action time (i.e., 391.56 + 37.03 ms). Our findings support this hypothesis.
A large variability is observed within a subject and among subjects. According to Polich8, P300
bio-logical determinants such as body temperature, food intake, drugs, and handedness, affect laten-cy and amplitude values. Interstudy variability is also observed. Such variations may be explained by the
employment of different parameters, which will consequently yield different results. For example, visual and auditory stimuli produce distinct amplitu-de and latency values29. Moreover, the oddball
pa-radigm produces increased latency and amplitude values when compared to the single stimulus par-adigm8,17. Along this vein, the specific parameters
employed in a study, such as: task (i.e., nature of the response, difficulty), paradigm, stimulus fac-tors (i.e., modality, duration, intensity), software, sample characteristics (i.e., size, density of subject numbers within each age decade, proportions of male and female subjects), among others, will di-rectly influence its results26. Therefore, every ERP
study will have a singularity and a specificity that may explain possible controversial results30. In this
context, the P300 normative database developed in the present study is particular for the conditions employed and for the sample selected. Further studies, with larger samples, are necessary to ex-pand the age span and thus, make the P300 norma-tive database even more reliable in the assessment of disorders that impact cognitive capability.
REFERENCES
1. Springer S, Deutsch G. Left brain, right brain: perspectives from cog-nitive neuroscience. New York: Freeman, 1998.
2. Groves P, Schlesinger K. Introduction to biological psychology. Iowa: Brown, 1982.
3. Coles M, Gratton G, Fabiani M. Event-related brain potentials. In Cacioppo JT, Tassinari LG (eds). Principles of psychophysiology: phys-ical, social, and inferential elements.Cambridge: University Press, 1995:413-455.
4. Oken B. Evoked potentials in clinical medicine. 3.Ed. Philadelphia: Lippincott, 1997.
5. Bashore T. Age-related changes in mental processing revealed by analy-ses of event-related brain potentials. In Rohrbaugh J, Parasuraman R, Johnson R (eds). Event-related brain potentials: basic issues and appli-cations. New York: Oxford, 1990:242-278.
6. Maurer K, Dierks T. Atlas de mapeamento cerebral: mapeamento topográfico do EEG e potencial evocado. Rio de Janeiro: Revinter, 1997. 7. Jernigan T, Press G, Hesselink J. Methods for measuring brain morpho-logic features on magnetic resonance images. Arch Neurol 1990;47:27-32. 8. Polich J. P300 in clinical applications. In Niedermeyer E, Lopes da Silva F (eds). Electroencephalography: basic principles, clinical appli-cations and related fields. 4.Ed. Baltimore: Urban & Schwarzenberg, 1999:1073-1091.
9. Salthouse T. Theoretical perspectives on cognitive aging. Hilldale (NJ): Earlbaum, 1991.
10. Beck E, Swanson C, Dustman R. Long latency components of the visual-ly evoked potential in man: effects of aging. Exper Ag Res 1980;6:523-545. 11. Goodin D, Squires KC, Henderson B, Starr A. Age-related variations in evoked potentials to auditory stimuli in normal human subjects. Electroencephalogr Clin Neurophysiol 1978;44:447-458.
12. Praamstra P, Meyer A, Cools A, Horstink M, Stegeman D. Movement preparation in Parkinson’s disease: time course and distribution of movement-related potentials in a movement precueing task. Brain 1996;119:1689-1704.
13. Franco GM. O potencial evocado cognitivo em adultos normais. Arq Neuropsiquiatr 2001;59:198-200.
14. Schochat E, Scheuer, CI, Andrade ER. ABR and auditory P300 findings in children with ADHD. Arq Neuropsiquiatr 2002;60:742-747. 15. Visioli-Melo JF, Rotta NT. Avaliação pelo P300 de crianças com e sem
epilepsia e rendimento escolar. Arq Neuropsiquiatr 2000;58:476-484.
16. Oldfield R. The assessment and analysis of handedness: the Edinburgh inventory. Neuropsychologia 1971;9:97-113.
17. Polich, J. P300 clinical utility and control of variability. J Clin Neurophy-siol 1998;15:14-33.
18. Jasper H. The ten-twenty electrode system of the international feder-ation. EEGClin Neurophysiol 1958;10:371-375.
19. Polich J. Evoked potentials in aging. In Albert ML (ed). Clinical neu-rology of aging. New York: Oxford, 1984:149-177.
20. Toda K. Cognitive processes in Parkinson’s disease: an event-related potential analysis. Nippon Ronen Igakkai Zasshi 1991;92:107-114. 21. Abe K, Sawada T, Horiuchi M, Yoshimura K. Effects of S-8510, a
ben-zodiazepine receptor partial inverse agonist, on event-related poten-tials (P300) in monkeys. Psychopharmacology 1999;141:71-76. 22. Heinze H, Münthe T, Steitz J, Matzke M. Pharmacopsychological effects
of oxazepam and kava-extract in a visual search paradigm assessed with event related potentials. Pharmacopsychiatry 1994;27:224-230. 23. Lorist M, Snel J, Kok A. Influence of caffeine on information
process-ing stages in well rested and fatigued subjects. Psychopharmacology 1994;113:411-421.
24. Polich J. EEG and ERP assessment of normal aging. Electroencephalogr Clin Neurophysiol 1997;104:244-256.
25. Emmerson R, Dustman R, Shearer D, Turner C. P3 latency and symbol digit correlations in aging. Exper Ag Res 1990;15:151-159.
26. Polich J. Meta-analysis of P300 normative aging studies. Psychophysio-logy 1996;33:334-353.
27. McDowell K, Jeka J, Schöner G, Hatfield B. Behavioral and electrocor-tical evidence of an interaction between probability and task metrics in movement preparation. Exper Brain Res 2002;144:303-313. 28. Verleger R. On the utility of P3 latency as an index of mental
chronom-etry. Psychophysiology 1997;34:131-156.
29. Comerchero M, Polich J. P3a and P3b from typical auditory and visu-al stimuli. Clin Neurophysiol 1998;110:24-30.