From the Department of Physiotherapy, Speech, Language and Hearing Sciences, and Occupational Therapy, Faculty of Medicine, University of São Paulo.
E-mail: [email protected]
Received for publication on June 22, 2004. Accepted for publication on December 09, 2004.
ORIGINAL RESEARCH
ANALYSIS OF DISTORTIONS IN CHILDREN WITH
AND WITHOUT PHONOLOGICAL DISORDERS
Haydée Fiszbein Wertzner, Mariana Bonafé Sotelo, and Luciana Amaro
WERTZNER HF et al. Analysis of distortions in children with and without phonological disorders. CLINICS 60(2):93-102, 2005.
PURPOSE: To verify using 4 different tests the incidence of distortions inchildren with and without phonological
disorders.
METHOD: Forty children between 4 and 10.2 years of age, divided into 2 groups: 20 with normal development and 20
with phonological disorders. All children underwent the phonology tests of the Child Language Assessment ABFW and 2 spontaneous speaking tests to assess for phonologic alterations. After recording, the data were printed, analyzed, and classified according to the distortions. Nonparametric (Mann-Whitney) statistical analysis was performed with the significance level being set at P <.05.
RESULTS: The phonological disorder group had significantly more occurrences of distortions in all tests compared to the control group (naming, P = .04; imitation P <.001; spontaneous speaking 1, P = .01; and spontaneous speaking 2, P = .002. The Pearson correlation coefficients of the distortion occurrences among the 4 tests were high.
CONCLUSION: The phonological disorder group presented a greater number of distortions in all tests. The most
frequent ones were /s, z, / and the variability found within the phonological disorder group was very high. The children in this group had unstable phonological systems and so presented a high number of different distortions. Regarding the evaluation of the phonologic system, all the tests were good evaluation methods since the correlations between them were high.
KEYWORDS: Phonologic disorder. Phonetics. Assessment. Diagnosis. Speech.
Phonological disorders occur with a high incidence in children, and their diagnosis is very important for minimiz-ing some possible consequences, such as learnminimiz-ing difficul-ties in reading and writing.
Phonological disorders affect children who seem to have normal intellectual, hearing, psychomotor, and social de-velopment, although they might have linguistic problems.1 These children present some characteristic patterns of speech, such as restricted groups of sounds, limited struc-tures of syllables and words, insistence on altered patterns, different chronology, uncommon types, wide variability of alterations, and little progress in sound acquisition.2
In Brazilian Portuguese-speaking children, one of the main characteristics of phonological disorders is the usage of phonological processes. The most prominent ones are cluster simplification, liquid simplification, final consonant elimination, palatal fronting, fricative devoicing, plosive devoicing, fricative plosivation, velar fronting, and palatal backing.3 In this same study3, most of the subjects used only developmental phonological processes, and often, the proc-esses from the beginning of development appeared together with processes that occur later on. A smaller number of sub-jects used phonological processes that are not often present in typical development but that always appear together with those noticed in typical development.
language of these subjects. Thus, it is important to inter-pret the phonological system, that is, what are the existing rules and the simplified ones, as well as which sounds can the child produce, in which contexts, and which sounds are produced improperly, characterizing distortions. It is very important to use a system that integrates the two analyses, since the distinctive traces are the smallest units of the pho-nemes and are based on acoustic and articulatory charac-teristics, or phonetic units.4
Some studies have reported that children with phono-logical disorders who present unclear speech differ from those with normal development regarding the number of inappropriate phonological patterns and also in the way these patterns were used.5,6 These children present high rates of omissions, substitutions, and distortions.7
The variability found in speech intelligibility of children with phonological disorders has been reported to be deter-mined by the specific patterns of the alteration type, by the language productivity, and by the involved prosody.8 In ad-dition, these authors judged the identification of some crite-ria as important for the classification of the severity of the developmental phonological disorder. Thus, the speech al-teration patterns that were restricted to articulatory distortions were often described as mild, while alteration patterns that involved eliminations and substitutions in several speech sounds were considered moderate or severe.9
Regarding sound production, some inadequate types, as classified by speech and hearing therapists, include omis-sion, substitution, and distortion. Omission is characterized by the absence of the target sound in a word production; substitution is identified when a target sound is exchanged for another in word production. These two alteration forms are generally more easily identified by the therapist and are found in phonological disorders.
Sound distortion is generally considered to be a phonetical alteration that does not concern the phonologi-cal rules of a language and is characterized by some diffi-culty in motor abilities involved in sound production, such as place, time, stress, and speed, resulting in a nonstandardized sound in speech. The distortion of a sound can be considered a mild alteration and, despite affecting the intelligibility of speech, it does not affect the phono-logical contrasts of a language, and therefore, it does not affect the meaning of the words.
The distortions may or may not be classified as speech disorders, and the difference between these two possibili-ties is the social implications they might cause. Distortions can be classified as common, being those observed in nor-mal development, and uncommon, which are all other dis-tortions that may occur in subjects with speech production difficulties.9-13
The phonetic aspects of speech and the maturation proc-ess of the myofunctional oral system are linked to the mechanism of motor production of the phonemes. Thus, speech alterations must be carefully investigated regarding morphophysiology, since many phonetic disorders occur from altered form or function of stomatognathic struc-tures.14,15 Some oral motor abnormalities are related to ar-ticulation imprecision, such as high and narrow palate, open anterior and lateral bite, alveolar edge thickness, protrusion level, teeth rotation, and gaps such as diastemas.16
Among the dysfunctions of the stomatognathic system, atypical deglutition is emphasized because it is often noted as the main cause of disorders in speech sound production, mainly in the disturbance of the sounds /t/,/d/, /l/, /n/, /s/ e /z/17. In 30 subjects between 5 and 14 years of age analyzed to verify the occurrence of phonoarticulatory disorders in people with atypical deglutition, 43.33% of the subjects presented phono-articulation disorders. Out of these, 61.53% presented concomitant alterations of dental and veolar phonemes; 30.77% presented alterations in the al-veolar phonemes /s/ and /z/; and 7.70% had alterations in the dental phonemes /t/, /d/, /l/ and /n/18.
In 1,986 students with normal and malocclusion-analy-sis of the articulation production of the sounds /t/, /d/, /s/, /z/,//,// revealed no statistical differences between groups, with both normal and altered productions being observed in both types of dental occlusion.19
In a group of 1,986 students with normal or with a malocclusion-analysis of the articulation production of the sounds /t/, /d/, /s/, /z/, //,// no statistical differences be-tween groups, (normal vs. altered production) was observed for both types of dental occlusion.19
The relationship between // sound production and tongue praxis was recently investigated in twenty 6-year-old children divided into 2 groups: 10 children with ad-equate /R/ sound production, and 10 with absence of pro-duction of these sounds.20 The results showed that children with absence of production of the // sound presented dif-ficulties in some types of tongue praxis, such as narrow-ing, widennarrow-ing, and/or tongue vibration.
Distortion occurs more often in the fricative alveolar sounds /s/ and /z/ and in the lateral liquid sounds /l, / and in the vibrant // sound.4,21 Examples of these distor-tions in the Portuguese language are: regarding the alveo-lar fricatives, frontal or lateral lisping, produced by the in-terposition of the tongue, as in /sapo/, which is phonologically represented as [s*apu]; regarding the lat-eral liquids /l, / and the vibrant // sound, the distortions cause productions in which the tongue is backed, also phonologically represented as a diacritic.
the presence of liquid distortions characterizes the group of subjects with residual alterations that remained even when they grew older. Regarding the Brazilian Portuguese language, the liquid sounds // and // are the most dis-torted ones23 and may be present in subjects over 12 years of age belonging to the group with residual alterations.
The important point regarding these distortions is that they often follow the phonological alterations that cause the loss of a phonological contrast, and that affects the meaning of the word as a result.3,4,21 In these cases, the sound distor-tion, for example, the use of the dorsal tongue to produce an alveolar lateral liquid and the vibrant liquid, could neutral-ize a phonological contrast, adding a phonologic matter.24
Often the distortion is not analyzed properly, but stud-ies have shown that the use of distorted sounds by chil-dren is expected, and these distortions might disappear as they grow up.9
The probable ages for the spontaneous remission of pho-nological disorders was assessed in 24 children with late speech development, using the Kaplan-Meier analysis: a threshold score of 85% on the percent of consonants cor-rect (PCC), percent of consonants corcor-rect-adjusted (PCC-A), and percent of consonants correct-revised (PCC-R) metrics was used.25 This analysis revealed two different paths to normalization. In Path A, errors of deletion, substi-tution, and omission declined as correct productions in-creased. In Path B, common clinical distortions increased as deletions and substitutions decreased. Children who fol-low Path B are those who retain residual errors in their speech. The distortions are common in consonants with late development, but rare in consonants with early and middle development. The author concluded that omission-substi-tution-distortion-correction reflects the hierarchy in phono-logical development.
An important factor that may interfere in the speech analysis is the method of collection of the sample that will be analyzed. The 3 kinds of tests that are often used for data collection to assess the phonological system are imi-tation, naming, and natural speech.26 The kind of test to be used depends on the kind of information desired and the available time for the test application.27-29 Natural speech is frequently indicated as a way to collect speech samples that reproduce the child’s environmental conditions, pro-viding a general idea about the child’s language, which is not possible in the other tests.9,26,27, 30 However, other au-thors consider that all the tests have advantages and, there-fore, they should be complementary.31
The advantages of evaluating a child by tests of nam-ing and imitation are the speed and the assurance with which the child will produce all the desired phonemes; but, on the other hand, these methods do not provide enough
data about the child’s phonological abilities. The assess-ment through spontaneous speech presents, as an advan-tage, the representation of the child’s speech pattern, al-though it is a longer test that does not guarantee a sample of all desired phonemes, and in cases of children with low intelligible speech, the analysis may be difficult.28
The choice of an instrument must be related to the test aim, and most importantly, the therapist must be aware of the limitations of each test.28,29
The phonetic analysis provides a detailed description of hearing, acoustic, and articulatory characteristics of speech,38 being an important instrument for listing the dis-tortions performed and for differentiating cases in which there are distortions from those where there is phonologi-cal disorder and/or distortions.
As it has been discussed in this short review, the pho-netics alterations (distortions) found in phonological dis-orders are variable. However, the authors are searching for ways of making better distinctions among the types of al-terations found in children’s speech with phonological dis-orders, mainly to observe the distortions. It is important to emphasize that many studies have used spectrographic analysis to complement the identification and the classifi-cation of distortions.22,36,37
The aim of this study was to verify using 4 different tests the occurrence of distortions in subjects with or without phonological disorders.
METHOD
The study was approved by the Ethics Committee in Research of HCFMUSP, number 00/09220-3, and was spon-sored by FAPESP (projects n. 00/09220-3, 02/03099-3 and 03/00159-8). Every responsible parent or tutor signed the Clearing and Free Consent Terms.
To compose the control group (CG), children without lan-guage or speech alteration complaints were invited to par-ticipate, as recommended by teachers of a public school. To compose the group with phonological disorders (GPD), chil-dren with phonological disorders were identified. At first, par-ents or legal guardians were instructed and consulted about the child’s participation in the research; after their consent, they signed the clearing and free consent terms.
Subjects
In the CG group, children were between 5.0 and 9.9 years of age, with 8 girls and 12 boys. In the GPD group, children were between 4 and 10.2 years of age, with 9 girls and 11 boys.
Furthermore, all children underwent the phonology tests of the Child Language Test ABFW29 and 2 spontaneous speech tests to confirm the presence or absence of phono-logical alterations.
After ending the diagnostic process, the children in the GPD group started their treatment or waited for their pho-nological treatment.
Procedure
All children were assessed in individual sessions. A digital audio tape recorder and a digital camcorder were used to collect data. At first, the pictures of the nam-ing test of the ABFW assessment were presented, and after-wards, the imitation test of the same assessment was per-formed. The spontaneous speech 1 (SS1) test was performed through an interview with 10 questions about the child, and the spontaneous speech 2 (SS2) test included a picture of a birthday party about which the child was asked to tell a story.
In the SS1 and SS2 tests, only the nouns produced were selected to be analyzed, and repetitions of the same ones were not considered.
After the data was recorded, it was transcribed accord-ing to protocols of the phonological test ABFW29 and later analyzed for distortions.
In order to guarantee the fidelity of the transcriptions and their analysis, an assessment of agreement between 2 evaluators was performed; one of them being the author and the other a senior student of Language Speech and Hear-ing Science trained to perform the analysis. In order to verify the agreement between the evaluators, 5 subjects were se-lected randomly, and the transcriptions and the distortion analyses were performed by the two evaluators. The
assess-ments were then compared, with an agreement of 90% for the transcriptions and 96.5% for the distortions.
The distortions were classified into common and un-common. The common ones incorporated the productions of alveolar phonemes /s/,/z/,/t/,/d/,/n/,/l/,// and post-alveo-lar phonemes // and // with frontal or lateral inter-dental positioning of the tongue. The uncommon distortions in-cluded productions with secondary articulation such as as-piration and glottalization, which are not common in the Portuguese language.39
Statistical Analysis
A descriptive statistical analysis was performed for the phonemes in which distortions were presented in the CG and GPD groups. Afterwards, The Pearson correlation coef-ficients between the tests were calculated in both groups.
It was necessary to use a proportion for the occurrence of distortions, since the number of distortions expected for each test and for each child was not the same. The propor-tions of distorpropor-tions were calculated by summing up the ac-tual distortions and the expected distortions in the per-formed test.
The nonparametric Mann-Whitney test and ANOVA with repetitive measures were used for comparisons, since the same child was heard in different tests.
RESULTS
Comparison between the CG and GPD groups for the occurrence of distortions
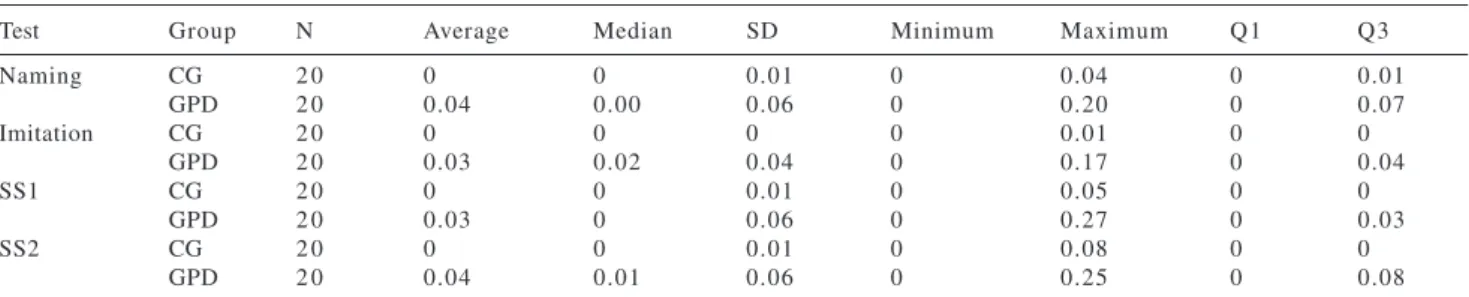
The CG group had a lower proportion of distortions than the GPD group in all tests (Table 1). Although the frequency of distortions was low in both groups, the children in the GPD group presented a higher number of distortions in all the tests when compared to the children in the CG group. The most frequently observed distortions in both groups
Table 1 - Descriptive statistics of proportions of distortion occurrences in the different tests.
Test Group N Average Median SD Minimum Maximum Q1 Q3
Naming CG 2 0 0 0 0.01 0 0.04 0 0.01
GPD 2 0 0.04 0.00 0.06 0 0.20 0 0.07
Imitation CG 2 0 0 0 0 0 0.01 0 0
GPD 2 0 0.03 0.02 0.04 0 0.17 0 0.04
SS1 CG 2 0 0 0 0.01 0 0.05 0 0
GPD 2 0 0.03 0 0.06 0 0.27 0 0.03
SS2 CG 2 0 0 0 0.01 0 0.08 0 0
GPD 2 0 0.04 0.01 0.06 0 0.25 0 0.08
were in the phonemes /s, z, , , /. Of the 20 subjects in the CG group, only 5 presented distortions in the follow-ing phonemes /s,z,,,t/; while of the 20 subjects in the GPD group, 15 presented distortions; and yet among them, 4 pre-sented distortions in only 1 phoneme in 1 specific test (Ta-ble 2).
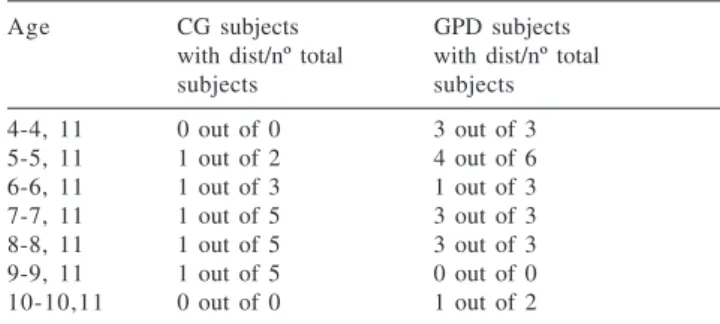
Distortions occurred in almost every age group. In the CG group, a decreasing frequency of distortions with in-creasing age was found (Table 3).
The number of distorted sounds at each age group was lower in the CG group than in the GPD group, and the youngest ages presented a greater number of distorted pho-nemes (Table 4).
In general, the frequency of distortions was low even in the GPD group. In the CG group, a few children presented distortions in the naming, imitation, and SS1 and SS2 tests; therefore, the variability found among them was very low. Regarding the GPD group, the variability of the frequency of distortions in all tests was high (Figures 1, 2, 3, and 4).
The nonparametric Mann-Whitney test revealed signifi-cant differences between the frequency of distortions found in the CG group compared with the GPD group for all the tests: naming (P = .04); imitation (P <.001), SS1 (P = .01), and SS2 (P = .002).
Test Associations
The test with the lowest frequency of distortions was
imitation, and it was also the one that presented the lowest variability (Table 1).
Table 2 - Number of children who presented distortions.
Test Group Distortions
s z t l n d f k g x
Naming CG (20) 2 1 0 0 1 0 0 0 0 0 0 0 0 1 0
GPD (20) 8 4 2 2 2 2 1 1 1 0 0 0 0 0 0
Imitation CG (20) 2 0 0 0 0 1 0 0 0 0 0 0 0 0 0
GPD (20) 9 3 4 3 3 1 3 2 0 1 1 1 1 0 0
SS1 CG (20) 1 0 0 0 0 0 0 0 0 0 1 0 0 0 0
GPD (20) 5 0 1 3 2 0 0 0 0 1 0 0 0 0 0
SS2 CG (20) 1 1 0 0 0 0 0 0 0 0 0 0 0 0 0
GPD (20) 6 2 1 3 1 2 0 1 0 0 0 1 0 1 1
SS1 - Spontaneous Speech 1; SS2 - Spontaneous Speech 2; CG - Control Group; GPD - Group with Phonological Disorders
Table 3 - Number of subjects who presented distortions by age group.
Age CG subjects GPD subjects
with dist/nº total with dist/nº total
subjects subjects
4-4, 11 0 out of 0 3 out of 3
5-5, 11 1 out of 2 4 out of 6
6-6, 11 1 out of 3 1 out of 3
7-7, 11 1 out of 5 3 out of 3
8-8, 11 1 out of 5 3 out of 3
9-9, 11 1 out of 5 0 out of 0
10-10,11 0 out of 0 1 out of 2
CG subjects with dist/nº total subjects - Control group, number of subjects with distortion by total number of subjects.
GPD subjects with dist/nº total subjects - Group with phonological disorders, number of subjects with distortion by total number of subjects.
Table 4 - Distortedphonemes by age group.
Age Control Group Group with Phonological Disorders
4-4,11 s,,l,t,,,k,n,d,
5-5,11 s, s,t,z,n,,
6-6,11 z s,
7-7,11 s,z s,,t,z,,l,x
8-8,11 t, f,k,,s,
9-9,11 s
10-10,11 s,z,,,t
Figure 1 - Points of proportion of the distortion occurrences in the naming test.
The correlations of the frequency of distortions between the 4 tests were high as revealed by the Pearson correlation coefficients, indicating that the variation in the frequency in one of the tests was similar to the variation in the other tests, for both groups. Higher correlations for the propor-tions of distorpropor-tions were found in the naming and SS1 tests (Table 5).
Comparison of the performance of the GPD group in the 4 tests
The averages of proportions of the distortions in the GPD group among the 4 tests were not significantly differ-ent, as revealed by ANOVA with repetitive measures (P = .37) (Figure 5).
The distortion proportions had similar amounts of vari-ability among the 4 tests (Figure 6).
In the GPD group, the most frequent distortions in the 4 tests were in the phonemes /s, z, / (Figure 7).
Regarding the GPD group, the variability of the occur-rence of the number of distortions in all tests was high, and one subject of the group (Subj. 3) presented higher values than the others in all tests (Figure 8).
DISCUSSION
The results of this study showed that there is a variable occurrence of distortions in phonological disorders, as has been demonstrated in other studies regarding the
charac-teristics of phonological disorders reported in the litera-ture.6,7,39
According to some authors,4,21 distortion occurs more often in alveolar fricative sounds /s/ and /z/, and in the Por-tuguese language, the liquid sounds, // e /λ/ and the vi-brant // sound are the most distorted ones.22,23 In this study, we verified that children in the GPD group also presented a higher number of distortions in all tests when compared to children in the CG group, and the most frequent distor-tions in both groups were in the following phonemes: /s, z, /.In the CG group, 9 children presented distortions in the following phonemes: /s, z, , t, /. In the GPD group, all children who presented distortions also used unexpected processes for their age, and the distortions occurred in the phonemes /s, z, , t, N, , λ, , n, k, d, f, /.
It is interesting to note that the lower variability in the occurrence of distortions found in the CG group shows that children with normal development are alike in their per-formance, despite their individuality; children with phono-logical disorders are different, presenting a higher variabil-ity among them, and the degree of severvariabil-ity can vary from severe to mild.3,8
We observed that the children’s performance in the CG
Table 5 - Correlations among the proportions of distortion occurrences in the different tests.
Correlation coefficient
Naming Imitation 0.817
SS1 0.901
SS2 0.811
Imitation SS1 0.859
SS2 0.768
SS1 SS2 0.864
SS1 – Spontaneous Speech 1; SS2 – Spontaneous Speech 2
Figure 4 - Points of proportion of distortion occurrences in the SS2 test.
Figure 3 - Points of proportion of distortion occurrences in the SS1 test.
Figure 6 - Dispersion of proportions of distortion occurrences in the Group with Phonological Disorders.
Figure 7 - Occurrence of distortions in the 4 tests in the Group with Phonological Disorders.
as well as in the GPD group was highly correlated among the 4 tests, from which we concluded that all the tests were complementary and equivalent, providing a good detection of distortions, which conforms to the literature.31
Phonetic analysis provides a detailed description of
as the spectrographic assessment of speech are very impor-tant for diagnosing the disorder, since they provide addi-tional and more precise information regarding the phonoarticulatory production.19,22,23
In our study, we found that:
- Children with phonological disorders had a higher number of distortions in all the tests.
Figure 8 - Box plot of proportions of distortion occurrences in the Group with Phonological Disorders.
- The most frequent distortions in both groups were with the /s, z, / sounds.
- The variability found in the CG group was very low; in contrast, the variability found in the GPD group was very high.
- Children in the GPD group presented an unstable pho-nological system; therefore, they presented a high number of distortions.
- For the assessment of the phonological system of chil-dren with phonological disorders, all the tests (naming, imitation, spontaneous speech 1, and spontaneous speech 2) were good, since the correlations among them were high.
- Regarding the proportions of distortion, there was no difference in averages among the tests. The distortions occurred in similar proportions in all tests.
AKNOWLEDGEMENTS
We would like to thank Fapesp for sponsoring the proc-esses 00/09220-3, 02/03099-3 and 03/00159-8.
RESUMO
WERTZNER HF e col. Análise de distorções em crianças com e sem transtorno fonológico. CLINICS 60 (2):93-102, 2005.
OBJETIVO: Verificar a ocorrência de distorções em su-jeitos com e sem transtornos fonológicos em 4 provas dife-rentes.
MÉTODO: Quarenta crianças, distribuídas em 2 grupos: 20 com desenvolvimento típico e 20 com transtorno fonológico, entre 4 e 10.2 anos de idade. Todas foram sub-metidas às provas de Fonologia do Teste de Linguagem In-fantil ABFW e a duas provas de fala espontânea para con-firmar a presença ou ausência das alterações fonológicas. Após a gravação dos dados, estes foram transcritos, anali-sados e classificados de acordo com as distorções.
RESULTADOS: Através do teste não-paramétrico Mann-Whitney nota-se que o Grupo Controle difere do Grupo com Transtornos Fonológicos em todas as provas, ao nível
de significância de 5%, para a Nomeação (p= 0,04), para a Imitação (p< 0,001), para a Fala Espontânea 1 (p= 0,01) e para a Fala Espontânea 2 (p=0,002). O estudo da correla-ção de Pearson entre a ocorrência de distorções nas quatro provas é alto.
CONCLUSÃO: O Grupo com Transtorno Fonológico apresentou o maior número de distorções em todas as pro-vas. As distorções que mais ocorreram em ambos os grupos foram /s, z, /. O Grupo com Transtornos Fonológicos apre-sentou grande variabilidade nas distorções, as crianças deste grupo possuem um sistema fonológico instável, dessa for-ma apresentam um número grande de diferentes distorções. Para a avaliação do sistema fonológico todas as provas fo-ram boas formas de avaliação, uma vez que o índice de cor-relação entre elas foi alto.
UNITERMOS: Transtorno Fonológico. Fonética.
REFERENCES
18. Pereira LF, Silva AMT, Cechella C. Ocorrência de Hábitos Orais Viciosos e Distúrbios Fonoarticulatórios em Indivíduos Portadores de Deglutição Atípica. Pró-Fono: Revista de Atualização Científica 1998;10(1):56-60.
19. Rossi KMA, Ávila CRB. Estudo Comparativo da Produção de Fonemas na Oclusão Normal e Maloclusão Dental em Adolescentes. Pró-Fono: Revista de Atualização Científica 1999; 11(2):77-9.
20. Fonseca RP, Dornelles S, Ramos APF. Relação entre a Produção de R-Fraco e as Praxias Linguais na Infância. Pró-Fono: Revista de Atualização Científica 2003;15(3):229-40.
21. Peña-Brooks A, Hedge MN. Assessment and treatment of articulation and phonological disorders in children. Austin: Pro-Ed.; 2000.
22. Pagan LO. Estudo das Líquidas Laterais e Vibrantes em Crianças com Distúrbio Fonológico: Análise Acústica e Articulatória. Dissertação de Mestrado. Faculdade de Filosofia, Letras e Ciências Humanas da Universidade de São Paulo, 2003. 23. Castro MM. Estudo de Estimulabilidade de Crianças com
Desenvolvimento Típico e com Distúrbio Fonológico para os Fonemas Líquidos Laterais e Vibrantes. Dissertação de Mestrado. Faculdade de Filosofia, Letras e Ciências Humanas, Departamento de Linguística Universidade de São Paulo, 2004. 24. Wertzner HF, Patah LK. Análise Acústica do /S/ E /S/ em Crianças com Distúrbio Fonológico. Jornal Brasileiro de Fonoaudiologia 2001;2(7):169-74.
25. Gruber FA. Probability estimates and paths to consonant normalization in children with speech delay. J Speech Lang Hear Res 1999;42:448-59.
26. Wertzner HF. Articulação: Aquisição do Sistema Fonológico dos Três aos Sete Anos. Tese de Doutorado. Faculdade de Filosofia, Letras e Ciências Humanas da Universidade de São Paulo, 1992. 27. Du Bois EM, Bernthal JE. A comparison of three methods for obtaining articulatory responses. J Speech Hear Disord 1978;43(3):295-305.
28. Stoel-Gammon C, Dunn C. Normal and disordered phonology in children. Texas: Pro- Ed, 1985.
29. Wertzner HF. Fonologia In: Andrade CRF, Befi-Lopes DM, Fernandes FDM, Wertzner HF. ABFW: Teste de Linguagem Infantil nas Áreas de Fonologia, Vocabulário, Fluência e Pragmática. São Paulo: Pró-Fono, 2000.
30. Ingram D. Phonological disability in children. London: Edward Arnold, 1976.
31. Holdgrafer G, Bernhardt BH. Beyond the basics I: The need for strategic sampling for the in-depth phonological analysis. Language, Speech and Hearing Services in Schools 2001; 32:18-27.
32. Khan LML, Lewis NP. Khan-Lewis phonological analysis. Minnesota: American Guidance Service, 1986.
33. Goldman R, Fristoe M. Goldman- Fristoe test of articulation. Circle Pines, MN: American Guidance Service, 1986.
1. Teixeira ER. A Aquisição Fonológica em Casos de Desabilidade Fonológica de Desenvolvimento. In: Yavas MS. Desvios Fonológicos em Crianças. Porto Alegre: Mercado Aberto; 1989. p. 211-30.
2. Stoel-Gammon C. Teorias sobre Desenvolvimento Fonológico e Suas Implicações para os Desvios Fonológicos. In: Yavas MS. Desvios Fonológicos em Crianças. Porto Alegre: Mercado Aberto; 1989. p. 11-34.
3. Wertzner HF. O Distúrbio Fonológico em Crianças Falantes do Português: Descrição e Medidas de Severidade. Tese de Dissertação de Livre Docência apresentado a FMUSP; 2002. 4. Lowe RJ. Fonologia: Avaliação e Intervenção: Aplicações na
Patologia da Fala. Porto Alegre: Artes Médicas; 1996. 5. Hodson BW, Paden EP. Phonological processes which characterize
unintelligible and intelligible speech in early childhood. J Speech Hear Disord 1981;46:369-73.
6. Weiner F. Systematic sound preferences as a characteristic of phonological disability. J Speech Hear Disord 1981;46(3)281-6.
7. Forrest K, Morrisette ML .Feature Analysis of segmental alterations in children with phonological disorders. J Speech Lang Hear Res 1999;42:187-94.
8. Shriberg LD, Kwiatkowski J. Phonological disorders III: A procedure for assessing severity of involvement. J Speech Hear Disord 1982;47:256-70.
9. Shriberg LD, Kwiatkowiski J, Best S, Hengst J, Terselic-Weber B . Characteristics of children with phonologic disorders of unknown origin. J Speech Hear Disord 1986,51:140-61. 10. Shriberg LD, Kwiatkowiski J . Intelligibility assessment in
developmental phonological disorders: accuracy of caregiver gloss. J Speech Hear Res1992;35:1095-104.
11. Shriberg LD. Four new speech and prosody-voice measures for genetics research and other studies in developmental phonological disorders. J Speech Hear Res1993;36:105-40. 12. Shriberg LD. Developmental Phonological Disorders III:
Long-term speech-sound normalization. J Speech Hear Res 1994;37:1151-77.
13. Shriberg LD, Austin BA, Mcsweeny SL, Wilson DL. The percentage of consonants correct (PCC) metric: extensions and reliability data. J Speech Lang Hear Res 1997;40:708-22. 14. Marchesan IQ. Motricidade Oral. São Paulo: Pancast; 1993. 15. Wertzner HF. Ambulatórios de Fonoaudiologia em Unidade Básica
de Saúde. In: Befi, D. Fonoaudiologia na Atenção Primária à Saúde.1a Ed. Série Atualidades em Fonoaudiologia, São Paulo:
Lovise; 1997, p.160-176.
16. Douglas CR. Patofisiologia Oral: Fisiologia Normal e Patológica Aplicada a Odontologia e Fonoaudiologia. São Paulo: Pancast; 1998.
34. Hodson BW. The assessment of phonological processes revised (APP-R). Austin: Pro-Ed,1986.
35. Yavas MS, Hernandorena CLM, Lamprecht RR. Avaliação Fonoaudiológica na Criança. Porto Alegre: Artes Médicas, 1991. 36. Gierut JA, Dinnsen DA. On word-initial voicing: converging sources of evidence in phonologically disordered speech. Language and Speech 1986,29:97-114.
37. Chaney C. Acoustic analysis of correct and misarticulated semivowels. J Speech Hear Res1988;31:275-87.
38. Silva TC. Fonética e Fonologia do Português: Roteiro de Estudos e Guia de Exercícios. São Paulo: Contexto,1999.