FREE THEMES
1 Curso de Fonoaudiologia, Departamento de Fisioterapia, Fonoaudiologia e Terapia Ocupacional, Faculdade de Medicina, Universidade de São Paulo. Rua Cipotânea 51, Cidade Universitária. 05360-160 São Paulo SP Brasil. [email protected]
Noise in early childhood education institutions
Abstract High sound pressure levels have been observed in schools, and its interference in the health of children and teachers it was taken to analyze these levels in childhood education cen-ters serving children aged zero to six years, in-vestigate the staff ’s perceptions concerning noise exposure and identify the auditory conditions of these workers and the occurrence of diseases. The study was conducted in ten institutions employing 320 workers. Sound pressure levels were measured according to the technical norms; employees com-pleted a questionnaire on the perception of noise and underwent auditory evaluation. There was high sound pressure level and differences between institutions, situations and places.Most employ-ees are considered exposed to noise with attention and concentration difficulties, anxiety and head-ache. About 30% of employees had bilateral sen-sorineural hearing loss in specific frequency.The sound pressure levels found can affect children’s learning and the health of all. The employees also perceived elevated levels of noise and indicated some possible negative aspects in their work rou-tine. Actions to improve the acoustic comfort in these institutions will be discussed with the man-agement teams.
Key words Noise occupational, Noise effects,
Noise measurement, Child day care centers, Health promotion
B
itar ML
Introduction
The negative impact of noise on the population’s health has been a constant theme in the area of public health. Unfortunately sound mapping in big cities, which is an important tool for urban planning, is not widely done and is restricted to
areas of general research1.
In schools noise may affect the health of ed-ucators and children in the process of teaching
and learning2-4 as there is a distinct relationship
between efficiency in teaching and acoustic
con-ditions in institutions5. Communication between
people and social interactions can be
compro-mised along with the cognitive process6. A child
that is exposed to loud noises, apart from being affected emotionally, may also present problems in relation to their language development. In Brazil the maximum level of noise that is
accept-able in classes is 50 dB7.
The higher the sound pressure levels (SPL) and the more frequent exposure to the negative impacts of loud noises are, the greater the chance of the individual having physical, mental or
so-cial problems8. The loss in hearing is related to
the average exposure to noise for eight hours or
more above 85 decibels (dB)9. Many health
prob-lems may occur or may even be worsen because of the above. For this reason children ought to be protected from the excesses of exposure to loud
noises principally by the public authorities10.
The following are other health problems that can occur due to the exposure to high SPL: an increase in baseline heart rate and respiratory rhythm, changes in blood pressure, intestinal problems, an increase in the production of thy-roid hormones and an increase in body tension
and stress levels11-14.
Excessively loud noises can be prejudicial for professional educators who need to use their
voices in a professional capacity15. There needs
to be sound levels, which include speaking and general noise, which is less than 10 dB for pupils in classes so that they can understand the teacher. The determinants for the distribution of sound emitted by voices in an environment are: the size of the room, the way how the room is con-figured, and the positioning of both the teachers and the pupils. It should be noted that there is a reduction of 6 dB where there is a doubling of
the distance in relation to the source of a sound16.
For children’s education where the use of voices is constant, consideration should be given to the
use of open external spaces17.
The measuring of noise allows for an initial
analysis of the conditions of an environment18.
This in turn allows for the search for solutions and actions that aid in the acoustic comfort in schools. In eight children’s educational
institu-tions2,3,6,10, high levels of SPLs were found, with
the average being 68.5 dB and there was a
varia-tion of 37.8 dB to 100.5 dB19. In a study carried
out on 37 municipal schools in the city of João Pessoa (PB), only one class room was evaluated
as having noise at an acceptable levels20.
In an educational institution for children in the state of São Paulo, a study was done on the sound pressure levels in different areas which had children and adults. It was found that the can-teen was the noisiest place in the building. After the findings were given to the coordinating team, alterations to the environment were made by the staff in the most affected areas and new practic-es were developed. It was subsequently proved through later analysis that the SPL was effectively reduced and the acoustic comfort in the
environ-ment was improved21.
Controlling noise in schools depends on the collaboration of the children, the teachers, the employees and general managers. This is done through observation and permanent
discus-sions22 so that effect measures can be proposed,
developed and improved upon23.
Based on educational work covering health with a view to improving acoustic comfort, the objective of this study was to analyze the sound pressure levels in ten children’s educational cen-ters. The idea was to understand the employee’s perceptions with reference to noise and related aspects and to analyze the conditions for hearing.
Methods
Ten children’s educational institutions in the western region of São Paulo participated. These institutions catered for 1,400 children from zero to six years old and they employ 320 employees. These institutions were selected due to: their teaching activities and regular opportunities for internships and the optional courses in speech therapy that could be taken at the medical school in the University of São Paulo.
aúd
e C
ole
tiv
a,
23(1):315-324,
2018
We considered, in this study, that the SPL
equivalent (Leq) represented the quantity of
sound energy in a determined space during a specific time period and the measurement was
in dB(A)3. Readings were done in the following
different areas in the actual institutions: the class rooms, canteens, corridors, external areas out-side of the institutions, the service areas and the general administrative rooms. Analysis was done during working days with specific equipment and it was also done when the children were not at school due to teacher’s meetings.
In small spaces (up to 10m2) readings were
taken in central points. For example in average
spaces (bigger than 10 m2 and up 20 m2) the
readings took place in two diagonal positions. In
large spaces (lager than 20 m2) three different
di-agonal points were measured (internal and exter-nal). An average reading was taken in every area that was analyzed.
An SPL digital meter was used (the center model 322 with data logger was chosen) and we followed the guidelines and procedures
giv-en by ABNT7. The device was calibrated and it
functioned with a slow response curve and with a noise gauge of between 30 and 130 dB. It was po-sitioned so that it was a minimum of one meter from the ground and the walls. Taking readings at every point took 10 minutes.
The averages of the minimum values and the averages of maximum values for every given space were taken. They were divided in the fol-lowing way: administrative areas and areas where people circulated (ADM) such as reception rooms, the management rooms, the matron’s office and the corridors. The other divisions included: class rooms (ROOMS), external spac-es (EXTERNAL) (including external areas just outside the buildings, parks and gardens), local places to eat (FOOD) (including places designat-ed for eating such as refectories, and support ser-vices (SUPPORT) (including laundries, kitchens and the areas where milk was produced). In rela-tion to presenting the data, the institurela-tions were numbered from 1 to 10.
A questionnaire was developed and designed to evaluate the perception of the staff with refer-ence to the exposure to noise and to look at the signs and symptoms related to possible exposure. In the development of the questionnaire some
articles were used11-13,24 and an initial version was
tested on a small group of teachers. After the pi-lot study was done, adjustments were made and a definitive questionnaire was developed and
produced having closed questions with the re-sponses yes/no (the questions related to exposure to sound, the presence of illnesses and the use of medication) and they had the following re-sponses: never, sometimes, always (for questions about signs and symptoms). Space was also made available on the questionnaire for any other com-ments relevant to the theme if the participant wanted to add more information. The employees were given the questionnaires in envelopes and they had a week to respond and give it back. An enquiry desk was set up to answers any questions or doubts and it lasted for a week. It was set up in the institutions.
After the questionnaires were returned the employees were sent to a department in an Au-diology Clinic where basic audiological evalua-tions were carried out in an acoustic booth which included the following: Meatoscopy (otoscope made by Heine®), Tone Audiometry covering frequencies from 250 to 8000 Hz, Speaking Tests (audiometry, the Grason-Stadler® brand, model number GSI-61) and Imitanciometry (the equip-ment is from the Interacoustics® brand, model AT 235h).
In order to analyze the descriptive statistics, the measurement known as central tendency was used - average and median - and (variabil-ity readings) standard deviations, covering min-imum and maxmin-imum readings were done. The Kolmogorov-Smirnov test was used to prove that the tests used were valid. This was guaran-teed through the use of the Analysis of Variance (ANOVA) statistical method in order to compare the SPL’s minimums, averages and maximums between: the different institutions, situations where there were and were not children present and various spaces. After the above, the multi-ple comparisons Tukey test was used so that the differences could be verified. Through the Qui-squared test, an evaluation was done covering the association between: hearing loss and the vari-able complaints of exposure to noise in schools, exposure to noise outside of schools, occurrences of illnesses and negative symptoms. In all of the analysis done the level of significance was con-sidered as 5%.
B
itar ML
Results
Sound Pressure Levels
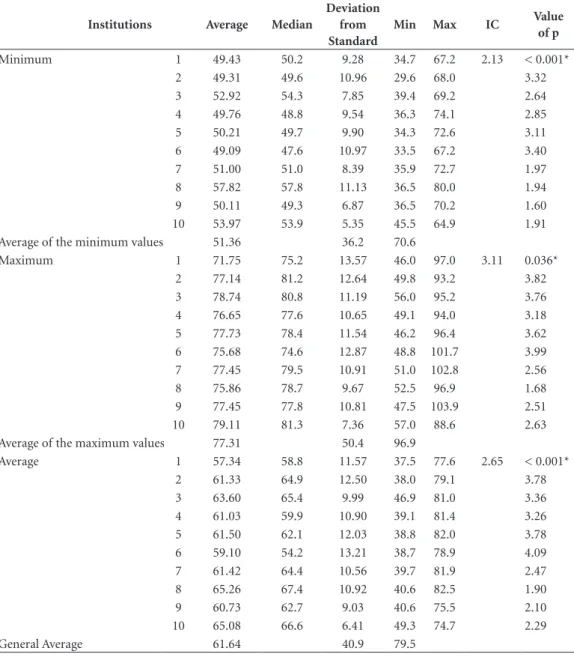
The general average sound pressure level for the ten institutions was 61.6 dB with a variation of between 36.2 dB (the average of the minimum values) and 96.9 dB (the average of the maximum values). With the application of the ANOVA test we observed differences between the institutions (Table 1). Through the use of Tukey’s multiple comparison test, we noted that in relation to
the minimum values institution 8 presented an average that was higher in comparison to the others, except for institutions 3 and 10. For the maximum values we observed that institution 1 had a lesser average than institutions 3, 7, 9 and 10. With reference to average values, institution 1 presented a lesser average than institutions 8 and 10.
Upon comparing the average values of the days in which the children were not present with the readings that were carried out for normal working days at the institutions, we observed
Table 1. Minimum, average and maximum values (in dB) obtained through measuring noise levels for the
institutions and on a general basis.
Institutions Average Median
Deviation from Standard
Min Max IC Value
of p
Minimum 1 49.43 50.2 9.28 34.7 67.2 2.13 < 0.001*
2 49.31 49.6 10.96 29.6 68.0 3.32
3 52.92 54.3 7.85 39.4 69.2 2.64
4 49.76 48.8 9.54 36.3 74.1 2.85
5 50.21 49.7 9.90 34.3 72.6 3.11
6 49.09 47.6 10.97 33.5 67.2 3.40
7 51.00 51.0 8.39 35.9 72.7 1.97
8 57.82 57.8 11.13 36.5 80.0 1.94
9 50.11 49.3 6.87 36.5 70.2 1.60
10 53.97 53.9 5.35 45.5 64.9 1.91
Average of the minimum values 51.36 36.2 70.6
Maximum 1 71.75 75.2 13.57 46.0 97.0 3.11 0.036*
2 77.14 81.2 12.64 49.8 93.2 3.82
3 78.74 80.8 11.19 56.0 95.2 3.76
4 76.65 77.6 10.65 49.1 94.0 3.18
5 77.73 78.4 11.54 46.2 96.4 3.62
6 75.68 74.6 12.87 48.8 101.7 3.99
7 77.45 79.5 10.91 51.0 102.8 2.56
8 75.86 78.7 9.67 52.5 96.9 1.68
9 77.45 77.8 10.81 47.5 103.9 2.51
10 79.11 81.3 7.36 57.0 88.6 2.63
Average of the maximum values 77.31 50.4 96.9
Average 1 57.34 58.8 11.57 37.5 77.6 2.65 < 0.001*
2 61.33 64.9 12.50 38.0 79.1 3.78
3 63.60 65.4 9.99 46.9 81.0 3.36
4 61.03 59.9 10.90 39.1 81.4 3.26
5 61.50 62.1 12.03 38.8 82.0 3.78
6 59.10 54.2 13.21 38.7 78.9 4.09
7 61.42 64.4 10.56 39.7 81.9 2.47
8 65.26 67.4 10.92 40.6 82.5 1.90
9 60.73 62.7 9.03 40.6 75.5 2.10
10 65.08 66.6 6.41 49.3 74.7 2.29
General Average 61.64 40.9 79.5
aúd
e C
ole
tiv
a,
23(1):315-324,
2018
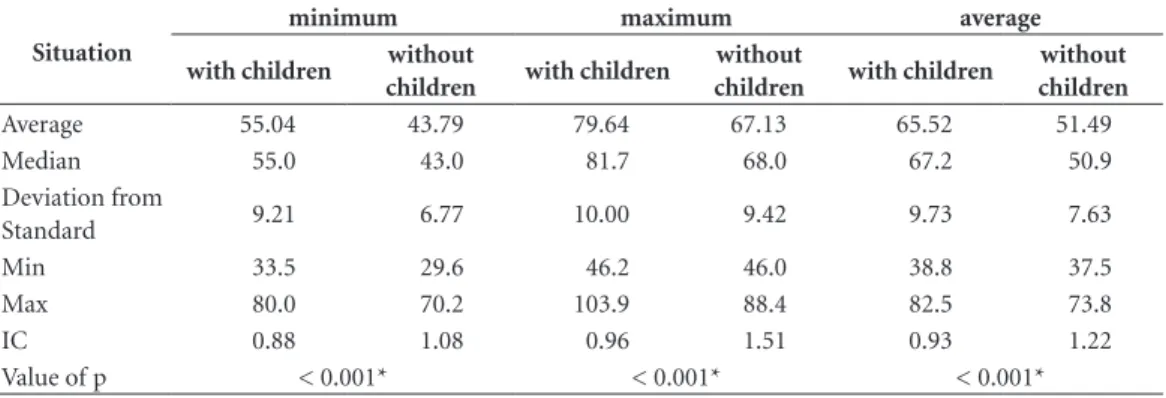
higher averages in the second situation with dif-ferences of up to 14.03 dB (Table 2).
When the SPL was compared in the different spaces covering external areas and areas where work was done, we noted that the values were higher in the averages for the minimum levels. For the averages covering the maximum values, the highest readings were in external areas partic-ularly where there was food. For the general
av-erage values, local areas where people circulated tended to show lower readings, with food areas registering the highest readings (Table 3 and 4).
Aspects related to exposure to noise
The questionnaire was completed and given back by 209 (65.3%) of the employees. In general there were not many queries that were given to
Table 2. Comparison between the averages of the minimum, medium and maximum values (in dB) obtained
through measuring noise levels considering the moments with and without the presence of children.
Situation
minimum maximum average
with children without
children with children
without
children with children
without children
Average 55.04 43.79 79.64 67.13 65.52 51.49
Median 55.0 43.0 81.7 68.0 67.2 50.9
Deviation from
Standard 9.21 6.77 10.00 9.42 9.73 7.63
Min 33.5 29.6 46.2 46.0 38.8 37.5
Max 80.0 70.2 103.9 88.4 82.5 73.8
IC 0.88 1.08 0.96 1.51 0.93 1.22
Value of p < 0.001* < 0.001* < 0.001*
* statistically significant (ANOVA).
Table 3. Comparison between the averages of the minimum, medium and maximum values (in dB) obtained
through measuring noise levels considering the different spaces in the institutions.
Spaces Average Median
Deviation from Standard
Min Max IC p-value
Minimum ADM 48.51 48.8 6.51 34.7 65.4 1.37 <0.001*
Rooms 49.00 46.7 10.66 29.6 80.0 1.52
External 52.95 54.1 8.25 34.6 69.2 2.05
Food 56.31 56.6 9.13 35.2 79.0 1.35
Support 53.79 51.8 10.74 36.5 79.7 2.81
Maximum ADM 73.22 74.3 9.00 46.1 92.7 1.89 <0.001*
Rooms 73.39 73.0 13.44 46.0 101.7 1.92
External 78.18 79.2 10.11 53.6 95.2 2.52
Food 79.99 81.0 8.76 52.3 103.9 1.30
Support 77.68 80.1 10.99 46.5 102.8 2.88
Average ADM 57.68 57.1 7.73 37.5 77.6 1.62 <0.001*
Rooms 58.64 54.3 12.72 38.0 82.5 1.81
External 62.74 65.7 9.73 40.2 81.0 2.42
Food 66.54 68.3 9.48 39.1 82.0 1.40
Support 63.01 64.1 10.18 40.6 81.9 2.67
* statistically significant (ANOVA).
B
itar ML
the enquiry desk although some questions were left blank.
The majority of the employees noted that they had been exposed to high levels of noise in the work place (88.5%). Aside from this, many said that: they lived in noisy areas (40.7%), that they used head phones to listen to music (33.7%), that they watched television or listen to the radio with the volume at its highest point (22.6%) and that they practiced sport and/or leisure activities that involved exposure to noise (21.7%).
In relation to difficulties that they found at their work place owing to noise, they said that their main gripes were: the annoyance caused by loud sounds and problems with attention and concentration. Difficulties related to interactions and identifications of sounds were not noted by many people.
With reference to illnesses that they had: 31 (14.8%) said they suffered from systematic high blood pressure, 26 (12.4%) stated that they had gastro-intestinal problems and 18 (8.6%) referred to hormonal problems. The constant use of medication was mentioned by 99 people (47.4%).
The most frequent negative symptoms were: anxiety and headaches, irritability and/or ner-vousness and stress. Less mentioned symptoms were: depression and the feeling of having a con-stant ringing in the ears.
It was not possible to analyze any associations between SPL and the variables in the
question-naires as was hoped, on account of all of the in-stitutions having presented levels that were above what was deemed as adequate.
Hearing Evaluations
All of the 209 employees that filled in and had given back the questionnaire were sent to have their hearing evaluated. Of those that were sent: 177 (84.7%) turned up to be examined, 141 (79.7%) presented normal results and 36 (20.3%) had results which differed from the norm. Those that had results which were outside of the param-eters for being considered normal, were firstly in-formed of their results and then were referred to otolaryngological treatment and were advised on the need for ongoing audiological monitoring.
Amongst those with these poor results, 11 (31%) presented neurosensory bilateral losses for frequencies of 3, 4 or 6 kHz (Table 5).
We did not find an association between hear-ing loss and the followhear-ing variables: complaints of exposure to noise, exposure to noise outside of schools, the occurrence of illnesses or negative symptoms.
Education in Health
In every institution a meeting was held with the coordinators in order for the results to be presented to them. The first measure that was proposed was for the results to be given to the
Table 4. Comparison between the different spaces with reference to the minimum, medium and maximum
values obtained through measuring noise levels.
Spaces ADM Rooms External Food
Minimum Rooms 0.997
External 0.052 0.045*
Food <0.001* <0.001* 0.100
Support 0.011* 0.008* 0.984 0.407
Maximum Rooms 1.000
External 0.063 0.033*
Food <0.001* <0.001* 0.748
Support 0.120 0.077 1.000 0.639
Average Rooms 0.934
External 0.045* 0.105
Food <0.001* <0.001* 0.088
Support 0.030* 0.070 1.000 0.183
* statistically significant (Tukey’s multiple comparison test).
aúd
e C
ole
tiv
a,
23(1):315-324,
2018
employees so that improvements could be made to increase their acoustic comfort. Thus meet-ings were scheduled with them to occur on a monthly basis. The following were the main pro-posals: gradually changing the kitchen and laun-dry appliances as they were both noisy and old, for more up to date equipment, changing daily routines principally in the lunchroom, changing practices in the use of the televisions and other devices in relation to their volume settings and improving the acoustic conditions of the floors, windows, walls and furniture. Other proposed measures included: making children aware of the value of silence and the effects of loud activities, placing limits on certain activities so that noise levels would not be excessive and making a kids sound traffic light which would help educators manage the noise levels in class rooms. Other measures were also proposed, all of which were
called Sensorial Education25.
Discussion
Just like other studies carried out in schools6,10,19-21,
the averages of the SPLs were above the accept-able values for these types of institutions. There was a difference of more than 10 dB for the av-erage values and more than 20 dB for the max-imum values. A discussion about the findings sparked off a deep analysis on aspects of the routines for the institutions that participated. The discussions were on the acoustic conditions of the buildings and their surroundings. The in-tention was to identify how best to improve the
situation based on literature in this area1,3. Based
on the results of this study a start was made on planning actions to be taken in order to reduce the level of noise in the institutions which would
in turn minimize the impacts on health for the employees and children as well as the problems aligned with the process of teaching and learn-ing. The idea was also to remove the negative communication situations that occur due to the
excess of noise that was discovered in studies2,4,6.
Even though in all of the institutions, high SPLs were identified, the highest were found in institutions 3, 8 and 10. These institutions are located on roads that have a high circulation of cars and people, which was different to the other institutions. External sounds join with internal noise producing an elevation of vocal intensity which includes sounds that come from devices such as radios and televisions. This is known as
the Lombard effect26. Therefore these institutions
will need solutions that involve acoustic isolation. Where there was the presence of children, the SPLs were higher. The very young, entering school for the first time, have vocal exuberance which ought to be taken in consideration by managers. Aside from speaking loudly, they tend to laugh, shout and cry a lot during their
inter-actions27. In children’s education, playing is the
guiding force for the majority of their activities, the implications of which, is the natural rise of noise in a given environment. Thus the number of children that occupy a given area should be considered, along with practices that raise chil-dren’s awareness of the importance of silence,
sounds, acoustic comfort and excessive sounds25.
Apart from having many children in the institu-tions, the circulation of many people includes those that work in the kitchens, the canteens, and the laundries as part of their daily routine. Thus the proposal to obtain new appliances, change routines, modify the acoustics in class rooms and change the furniture is a promising. This is also the case for dedicated eating areas where noise is at its highest level. These areas are large and have a lot of movement with adults helping children whilst they eat. Noise comes from plates, cutlery and oven dishes. Again it is worth highlighting the benefits of investing in educational practic-es aim at reducing noise in thpractic-ese areas, allowing
for moments of tranquility25. This is important
because the children will, as a result, eat well and take pleasure in eating. It is also fundamental for
their biopsychosocial development28.
External spaces also presented high levels of noises. There is the most amount of noise inter-ference from surrounding areas and play areas and there is a natural increase in vocal intensity. As these areas have little acoustic reverberation, the impact of higher SPL is less for children and
Table 5. Distribution of the types of losses in hearing
found when the employees were examined.
Types of hearing losses N %
Unilateral and Neurosensory losses for the frequencies 3, 4, 6 and 8 kHz
15 42
Neurosensory and bilateral losses for the frequencies 3, 4 or 6 kHz
11 31
Conductive 4 11
Mixed 2 5
Others 4 11
B
itar ML
educators except in respect of the use of their
voices15.
The staff recognized the noises and were an-noyed by them, which also was the case in other
studies29. This could be a positive factor so that
improvement practices for acoustic comfort can be brought in. Also these issues are not just per-tinent to a person’s place of work, but also cover a person’s place of abode and their leisure and sporting practices.
Professionals in this area note that noise has an important impact on communicative situa-tions where the process of learning can be ad-versely affected. This also includes negative
cogni-tive effects for children3,4,5. The educators may also
become tired and exhaustive during their working day. People can have difficulties being understood which will affect the activities that are done. This will also affect the ability to bring in conflict reso-lutions and the implementation of limits for chil-dren. A person’s health can also be placed at risk due to communicative difficulties which could
lead to dysphonia15,29,30. The exposure to noise and
the related difficulties that present themselves can aggravate a person’s anxiety and irritability and can cause nervous spells. It can also increase stress and headache periods. The aforementioned were frequently mentioned in other studies.
Aside from this, some educators stated that these health problems required medical moni-toring particularly for high blood pressure, which has been related to exposure to noise. The follow-ing health problems can occur: physical problems
related to the body, mental and social problems31,
interference with a person’s quality of life and a
reduction in the productivity of their work18.
Ac-tions that should be taken to help in the health of the employees are often not taken, which results in poor health for the children. Both employees
and children need to be prioritized32.
The number of hearing exams where prob-lems were identified was worrying. It should be not that many had neurosensory bilateral hear-ing losses in the frequencies that are
common-ly related to hearing losses induced by noise
(known as PAIR)14,33. PAIR is caused by high
ex-posure to noise levels over 85 dB for eight hours per day. This typically occurs on a regular basis
and goes on for the first five years34. It is generally
considered irreversible. It is symmetrical and bi-lateral and occurs in the following frequencies: 3,
4 or 6 kHz14. In order for these findings to be well
understood and later discussed, the back history of the employees with reference to their exposure to noise needed to be looked at. This is because their hearing losses did not relate to any of the aspects that were studied namely: complaints due to exposure to noise, exposure to noise outside of schools and the occurrence of illnesses or neg-ative symptoms probably due to the occurrence of these complaints amongst staff in general. It is important to note that in three of the institutions that were studied, the body charged with the responsibility for health and safety in the work place, started to request audiometry medical ex-aminations for their employees on a periodic ba-sis, due to their concerns.
The data shows the need to empower the main people involved in this area so that actions can be taken together to develop and imple-ment measure to improve noise levels, providing acoustic comfort and well-being in schools.
We can therefore conclude this study by af-firming that the SPL in the institutions are above adequate and acceptable limits for all concerned parties. The employees noted the high noise lev-els and made reference to it impacting on their work and their health. Approximately 10% of the total of employees that were studied showed signs of losses in hearing. The process for searching for solutions is promising. In spite of this study be-ing restricted to the institutions that were a part of the study, it can serve as a basis for other simi-lar actions in this area.
aúd
e C
ole
tiv
a,
23(1):315-324,
2018
References
1. Mendonça ABD, Suriano MT, Souza LCL, Viviani E. Classes de quadras urbanas determinadas pelos níveis de ruídos. Revista Brasileira de Gestão Urbana 2013; 5(2):63-77.
2. McAllister AM, Granqvist S, Sjölander P, Sundberg J. Child voice and noise: a pilot study of noise in day care and the effects on 10 children's voice quality according to perceptual evaluation. J Voice 2009; 23(5):587-593. 3. Rabelo ATV, Santos JN, Oliveira RC, Magalhães MC.
Efeito das características acústicas de salas de aula na inteligibilidade de fala dos estudantes. CoDAS 2014; 26(5):360-366.
4. Santos JF, Souza APR, Seligman L. Análise comparativa do desempenho em leitura e escrita de crianças expos-tas e não exposexpos-tas a níveis elevados de pressão sonora.
CoDAS 2013; 25(3):274-281.
5. Fernandes JC. Padronização das condições acústicas para sala de aula. In: Anais do XIII SIMPEP; 2006; Bau-ru; p. 1-8.
6. Persson R, Kristiansen J, Shibuya H, Nielsen P. Class-room acoustics and hearing ability as determinants for perceived social climate and intentions to stay at work.
Noise and Health 2013; 15(67):446-453.
7. Associação Brasileira de Normas Técnicas (ABNT).
Norma Brasileira 10152: níveis de ruído para conforto acústico. Rio de Janeiro: Comissão de Estudo de Acústi-ca/ABNT; 2000.
8. Neves EB, Soalheiro M. A proteção auditiva utilizada pelos militares do Exército brasileiro: há efetividade?
Cien Saude Colet 2010; 15(3):889-898.
9. American College of Occupational and Environmental Medicine / ACOEM Noise and Hearing Conservation Committee. ACOEM evidence-based statement: noi-se-induced hearing loss. J Occup Environ Med 2003; 45(6):579-581.
10. Paunovic K. Noise and children´s health: research in Central, Eastern and South-Eastern Europe and Newly Independent States. Noise and Health 2013; 15(62):32-41.
11. Araújo SA. Perda auditiva induzida pelo ruído em tra-balhadores de metalúrgica. Rev Bras Otorrinolaringol
2002; 68(1):47-52.
12. Dias A, Cordeiro R, Corrente JE, Gonçalves CGO. Asso-ciação entre perda auditiva induzida pelo ruído e zum-bidos. Cad Saude Publica 2006; 22(1):63-68.
13. Ogido R, Costa EA, Machado HC. Prevalência de sin-tomas auditivos e vestibulares em trabalhadores ex-postos a ruído ocupacional. Rev Saude Publica 2009; 43(2):377-380.
14. Santos AS, Castro Júnior N. Audiometria de tronco en-cefálico em motoristas de ônibus com perda auditiva pelo ruído. Braz J Otorhinolaryngol 2009; 75(5):753-759.
15. Simões-Zenari M, Bitar ML, Nemr K. Efeito do ruído na voz de educadoras de instituições de educação in-fantil. Rev Saude Publica 2012; 46(4):657-664. 16. Guckelberger D. A new standard for acoustics in
class-room. Engineers Newsletter 2003; 32(1):1-6.
17. Dockrell J, Greenland E, Shield B. Noise in open plan classrooms in primary schools: a review. Noise and He-alth 2010; 12(49):225.
18. Gerges SNY. Ruído: fundamentos e controle. 2ª ed. Flo-rianópolis: NR Editora; 2000.
Collaborations
B
itar ML
19. Simões-Zenari M, Bitar ML, Pereira MB. Análise do ru-ído em instituições de educação infantil. Rev Soc Bras Fonoaudiol 2009; suplemento:2860.
20. Gonçalves VSB, Silva LB, Coutinho AS. Ruído como agente comprometedor da inteligibilidade de fala dos professores. Produção 2009; 19(3):466-476.
21. Bitar ML, Sobrinho LFC, Simões-Zenari M. Compa-ração entre os níveis de ruído de uma instituição de educação infantil após intervenção fonoaudiológica.
Rev Soc Bras Fonoaudiol 2010; Suplemento:670-674. 22. Palma A, Mattos UAO, Almeida MN, Oliveira GEMC.
Nível de ruído no ambiente de trabalho do professor de educação física em aulas de ciclismo indoor. Rev Saude Publica 2009; 43(2):345-351.
23. Vivan AG, Morata TC, Marques JM. Conhecimento de trabalhadores sobre ruído e seus efeitos em indústria alimentícia. Arq Int Otorrinolaringol 2008; 12(1):38-48. 24. Silva MC, Orlandi CG, Chang EM, Siviero J, Pinto MM, Armellini PFS, Santos TS, Luz VB, Gil D. Níveis de ru-ído na lavanderia de um hospital público. Rev CEFAC
2011; 13(3):472-478.
25. Baring JGA. Sustentabilidade e o controle acústico do meio ambiente. Acústica e Vibrações 2007; 38:1-6. 26. Quedas A, Duprat AC, Gasparini G. Implicações do
efeito Lombard sobre a intensidade, frequência fun-damental e estabilidade da voz de indivíduos com doença de Parkinson. Rev Bras Otorrinolaringol. 2007; 73(5):675-683.
27. Simões-Zenari M, Nemr K, Behlau M. Voice disorders in children and its relationship with auditory, acoustic and vocal behavior parameters. Int J Pediatr Otorhino-laryngol 2012; 76(6):896-900.
28. Ramos M, Stein LM. Desenvolvimento do compor-tamento alimentar infantil. Jornal de Pediatria 2000; 76(Supl. 3):S229-S237.
29. Fiorini AC, Matos ECG. Ruído na escola: queixas de saúde e o incômodo em professores do ensino público.
Distúrb Comum 2009; 21(2):187-197.
30. Behlau M, Zambon F, Guerrieri AC, Roy N. Epidemio-logy of voice disorders in teachers and nonteachers in Brazil: prevalence and adverse effects. J Voice 2012; 26(5):665.e9-18.
31. Neves EB, Soalheiro M. A proteção auditiva utilizada pelos militares do Exército brasileiro: há efetividade?
Cien Saude Colet 2010; 15(3):889-898.
32. Souza KR. Mudanças necessárias no trabalho em esco-las: a visão dos profissionais da educação e o enfoque da saúde do trabalhador. Educação em Revista 2014; 30(3):291-313.
33. Silveira VL, Câmara VM, Rosalino CMV. Aplicação da audiometria troncoencefálica na detecção de perdas auditivas retrococleares em trabalhadores de manuten-ção hospitalar expostos a ruído. Cien Saude Colet 2011; 16(2):689-698.
34. Nudelmann AA, Costa EA, Seligman J, Ibanez RN. Atualização sobre os documentos do Comitê Nacional de Ruído e Conservação Auditiva. In: Nudelmann AA, Costa EA, Seligman J, Ibanez RN, organizadores. Perda Auditiva Induzida por Ruído. Rio de Janeiro: Revinter; 2001. p. 225-234. (Volume II)
Article submitted 31/08/2015 Approved 11/01/2016