Instituto Nacional de Cardiologia Laranjeiras, Ministério da Saúde e Universidade Gama Filho
Mailing Address: José Barbosa Filho - Rua Sousa Lima, 32/201 – 22081-010, Rio de Janeiro, RJ – Brazil - E-mail: [email protected]
Objective – To analyze the heart rate variability in patients with mild to moderate systemic arterial hyper-tension.
Methods - Thirty-two healthy (group I) and 70 syste-mic arterial hypertensive (group II) individuals, divided according to age (40 to 59 and 60 to 80 years old, respecti-vely) and with a similar distribution by sex were studied. Thirty-one had left ventricular hypertrophy (LVH), 22 were overweight, and 16 had Type II diabetes mellitus. Smoking, alcohol ingestion, and sedentary habits were the same between groups. Variability in heart rate was analyzed in the time domain, using standard deviations of normal RR intervals (SDNN) and the differences between maximal bra-dy- and tachycardia (D-BTmax) during sustained inspiration. Analysis of the frequency band of the power spectrum between 0.05 and 0.40 Hz at rest and during controlled respiration was chosen for analysis of the frequency domain.
Results - In both time and frequency domains, varia-bles were lower in group II than in group I. Within groups, statistically significant variables were only found for indivi-duals in the 40 to 59 year old group. The presence of LVH, overweight, or diabetes mellitus did not influence the va-riability in heart rate to a significant extent.
Conclusion - Variability in heart rate was a valuable instrument for analyzing autonomic modulation of the heart in arterial hypertension. The autonomic system un-dergoes significant losses in cardio-modulatory capacity, more evident in subjects between 40 and 59 years old. In those over 60 years old, reduced variability in heart rate imposed by aging was not significantly influenced by the presence of systemic arterial hypertension.
Key words: autonomic cardiac modulation, systemic arte-rial hypertension, heart rate variability
Arq Bras Cardiol, volume 78 (nº 2), 189-95, 2002
José Barbosa Filho, Paulo Roberto B. Barbosa, Ivan Cordovil
Rio de Janeiro, RJ - Brazil
Autonomic Modulation of the Heart in Systemic Arterial
Hypertension
Clinical and experimental studies have demonstrated that the autonomic modulator capacity of the cardiovascular apparatus is altered in diseases directly or indirectly affecting the heart 1-9. In diseases accompanied by alterations in the
vagosympathetic system leading to the development of potentially fatal arrhythmia, both morbidity and mortality are significantly influenced by such functional alterations 10-18.
Interest in the evaluation of autonomic modulation of the heart by analysis of beat-for-beat variability in heart rate in systemic arterial hypertension (SAH) has been variously demonstrated. Results have proven that this variability can identify alterations in the mechanism of au-tonomic control of SAH, also aiding in the evaluation of the action of drugs that interfere with the regulation of cardiovascular function 9,19-27.
The present work represents a study of the autonomic modulation of the heart, using the analysis of the variability in heart rate of selected groups of healthy and primary arte-rial hypertensive subjects.
Methods
The study protocol was set up in accordance with the principles of the Helsinki Declaration and authorized by the Ethics Commission of the National Institute of Cardiology of Laranjeiras (INCL).
Twenty group I individuals were between 40 and 59 years old (mean ±SD, 48.7±5.2; median 48 years) (group Ia, 14 males), and 12 were between 60 and 80 years old (71.3±5.9, median 71 years) (group Ib, 8 males). Their clinical histories, results of the physical examination, laboratory and radiolo-gical examinations, and electrocardiograms (ECG) at rest were within normal limits.
In group II, 40 subjects were between 40 and 60 years old (48.7±6.2, median 48 years) (group IIa, 26 males), and 30 were between 60 and 80 years old (69.3±5.7, median 69 years) (group IIb, 10 males) (Table I). Thirty-one had left ventricular hypertrophy (LVH) on the echocardiogram at rest, defined by septal and left ventricle posterior wall thickness >1.1cm according to the routine protocol of analysis of the echocardiography sector of the INCL. Twenty-two were overweight defined by a body mass index
≥25kg/m-2. Sixteen had noninsulin dependent diabetes
mellitus of Type II and maintained glycemic control with diet or oral hypoglycemic therapy or both. Smoking habits, alcohol ingestion, and sedentary lifestyle were not different among the groups.
Criteria for inclusion in the study are presented in Table II.
Clinical evaluation included measurements of heart rate, arte-rial pressure on both arms, antero-posterior thoracic diameter, body weight and height, and body mass index. Anamnesis was directed at the investigation of clinical complaints and physical examination, and complementary examinations in-cluding glycemia, cholesterolemia, assessment of renal and liver function, ECG at rest, and thoracic roentgenogram were within normal limits. The Romhilt-Estes index was used for the electrocardiographic diagnosis of LVH. Electrocardiogra-phic signals were used for the analysis of the variability of heart rate as described below. Medical attention and examina-tions were performed between 8 AM and 6 PM.
Following a 5 to 10 minutes rest period in the dorsal decubitus position, arterial pressure was measured on both arms of subjects seated in a quiet room at 250 C. Arterial
pressure was measured after 1, 3, and 5 minutes, and avera-ges of the last 2 measurements were recorded. The arm sho-wing the highest arterial pressure values was taken as stan-dard. Mercury column sphygmomanometers calibrated by INMETRO (National Institute of Metrology) were used.
Electrocardiographic signals on an AECG03, (Lynx Technology, São Paulo, Brazil) were recorded for 300 seconds
Table I – Demographic values and parameters evaluated
Group Ia Group IIa p* Group Ib Group IIb +
N 20 40 - 12 30
-Age (years)** 48.7±5.2 [48.0] 48.7±6.2 [48.0] NS 71.3±5.9 [71.0] 69.3±5.7 [69.0] NS
Sex (F/M) 6/14 14/26 NS 8/4 20/10 NS
SAP (mmHg) 125.1±10.0 170.2±14.4 <0,05 138.1±10.6 180.2±12.2 <0.05
DAP (mmHg) 83.2±5.1 98.4±10.2 <0,05 80.5±5.4 90.8±9.1 <0.05
LVH (septum and PP>1.1cm) - 22 - - 9
-Glycemia>120 mg/dL 0 7 - 0 9
-BMI>25kg×m-2 0 18 - 0 4
-MCF (bpm) 69.2±8.6 72.4±13.5 NS 71.0±11.4 73.0±10.3 NS
DPNN (ms) 39.4±14.4 27.0±12.0 <0,001 24.5±8.0 20.6±5.5 NS
HFLnT (Ln ms2) 5.2±0.9 3.9±1.3 <0,001 4.1±0.9 3.6±1.1 NS
HF RC LnT (Ln ms2) 7.3±0.7 5.6±1.3 0,02 5.2±0.4 4.9±0.4 NS
TME LnT (Ln ms2) 6.4±0.7 5.1±1.0 <0,001 4.8±0.8 4.5±0.9 NS
D-BT
máx (bpm) 21.6±4.1 16.2±7.6 0,03 15.4±4.3 16.7±6.1 NS
*level of statistical significance; ** age expressed as mean±SD(median); other values expressed as mean±SD; HF- high frequency; TME - total modulatory energy; CR- controlled respiration; D-BT
max- difference between maximal brady – and tachycardia during and following sustained inspiration; LnT- logarithmic transformation (refer to text for deatils); BMI - body mass index.
Table II – Criteria for inclusion and exclusion in study groups
Group I Group II
Criteria for inclusion Criteria for exclusion Criteria for inclusion Criteria for exclusion Age ≥40 and ≤80 years Non-sinus rhythm Age ≥40 and ≤80 years Non-sinus rhythm DAP<90mmHg Psychiatric or neurologic 90≤DAP≤110mmHg Psychiatric or neurologic
SAP<140mmHg disease 140≤SAP≤180mmHg disease
AMI or ACD*** AMI or ACD
Pregnancy CTI >50% or EF <45%
Thyroid, renal or Thyroid, renal or
hepatic dysfunction hepatic dysfunction
CTI >50% Use of b-blocker
Diabetes mellitus COPD
Secondary HAS
and analyzed by the SAECG system as already described 6, 7, 28.
Signals were taken between 10 AM and 6 PM from subjects kept in the dorsal decubitus position, breathing with their natu-ral frequency in an isolated room at 250 C at least 2 hours
following their meals. In smokers, measurements were taken at least 30 minutes after ending tobacco intake.
Additional ECGs of 60 seconds duration each were recorded from subjects randomly selected from each experi-mental group, (6 from groups Ia and IIa, 4 from groups IIa and IIb) who kept under respiratory control at a respiratory frequency of 12 incursions/min 0.20 Hz, monitored by the examiner with timing equipment. For a second record, 20 individuals from group I (12 from group Ia and 8 from group 1b) and 35 from group II (15 from group IIa, 20 from group IIb) had their ECGs taken during a sustained inspiration maneuver 7, composed of 3 phases of respectively, 15, 15,
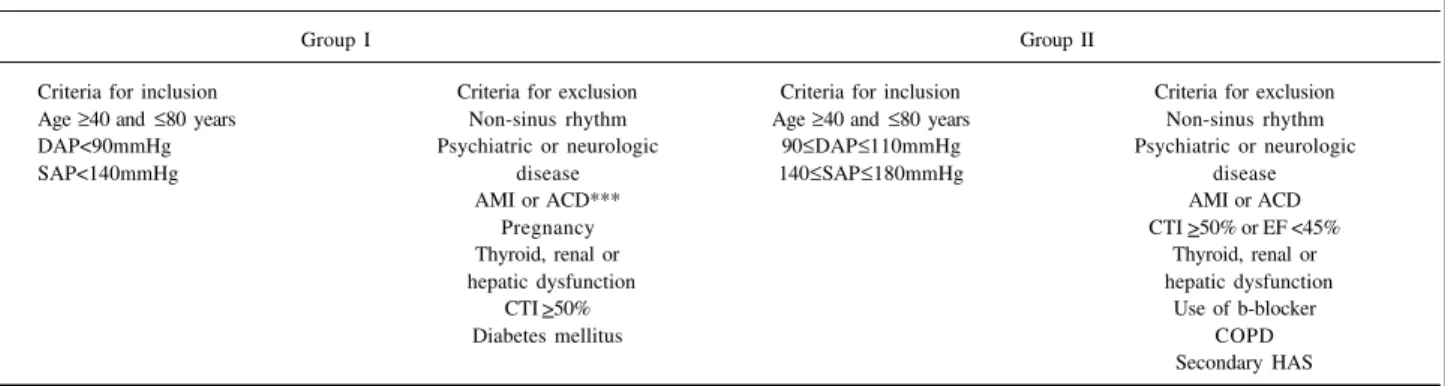
and 30 seconds duration. During the first phase, subjects were instructed to breathe spontaneously; during the se-cond phase, of sustentation, they were required to exert ap-nea following maximal inspiration without expiratory effort, a procedure differing therefore from the Valsalva maneuver. During this phase, an initial rise of 2 to 3 seconds in average values of heart rate was observed was followed by 8 to 10 seconds of intense bradycardia followed in turn by a pro-gressive increase in heart rate. After a 15-second interval, the subjects were instructed to release their inspired air and to return to spontaneous respiration. At this point (3rd phase),
heart rate increased to values above averages observed during the first phase and gradually returned to base levels, a typical response of 5 to 10 seconds duration (Figure 1). Records were taken sequentially from subjects remaining in the dorsal decubitus position between readings.
Two domains were analyzed: in the frequency doma-in, a series of normal consecutive RR intervals was interpo-lated and the power spectrum calcuinterpo-lated using a previously described technique 28. The area under the spectrum in the
region between 0.05 Hz and 0.40 Hz corresponding to sym-pathetic and parasymsym-pathetic energy modulation was cal-culated. The region analyzed is classically decomposed into two frequency bands: one, of low frequency between 0.05 and 0.15 Hz, corresponds to predominantly
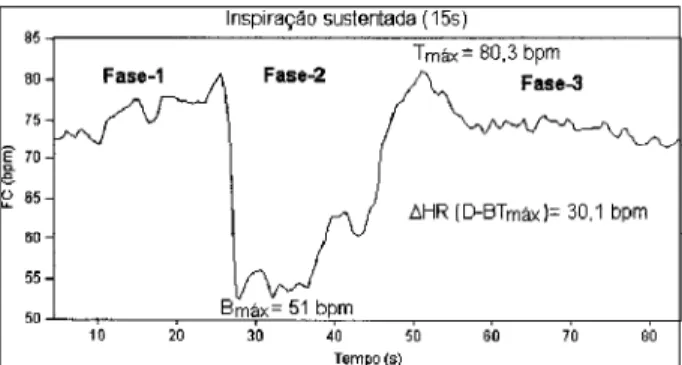
sympathe-tic influences; the other, of high frequency between 0.15 and 0.40 Hz, corresponds to parasympathetic influences on the variability of heart rate. Due to the marked super-positioning of sympathovagal influences at the frontier region of 0.15 Hz, the entire total energy modulation region was chosen for analysis. During the controlled respiration maneuver, practically all the energy of the spectrum was concentrated in the high frequency region, indicating a pre-dominance of vagal activity. The difference between this energy and that obtained during rest periods was conside-red to represent the autonomic reserve of modulation of the variability of heart rate (Figure 2).
To analyze the time domain, averaged heart rate or means of the 60/RR (RR=RR interval in seconds) relation-ships and the standard deviations (SDNN) of all normal consecutive intervals were considered. The differences between values of maximal bradycardia during and of ma-ximal tachycardia immediately following the phase of sus-tained inspiration were taken as indexes of autonomic acti-vity (D-BTmax) corresponding to the modulator potential of the autonomic nervous system.
Body mass index was calculated with the formula BMI=weight (kg) x height-2 (m-2).
Continuous variables were represented in terms of averages ± standard deviation. Due to the strong asymmetry of its probability distribution function, for normalization prior to analysis, the variables of total energy modulation were transformed into natural logarithms (LnT).
A comparison between the variations in groups I and II in the frequency and time domains were made using Student’s two-tailed t test. Discrete variables were analyzed by the chi-square test using Yates correction or Fisher’s exact test, for small samples.
The influence of controlled respiration on the high fre-quency region of the power spectrum was compared with that of the rest period for each group, using Student’s two-tailed paired t test. Differences between high frequency LnT values at controlled respiration and at rest were compared with this test using unpaired approach.
Individuals in each age of group II were stratified re-garding the presence of LVH, overweight, and diabetes and analyzed; a two-tailed Student’s t test was used to compare their variables in the frequency and time domains.
For analysis of their diagnostic values, variables in the frequency and time domains, were dichotomized as belon-ging to groups of subjects aged between 40 and 59 years and above 60 years old, respectively. This was achieved by analyzing the function defined by the products of the dis-tributions of the probability functions of each group (see Appendix). Specificity and sensitivity values were identified at points maximizing this function; their statistical signifi-cance was evaluated by the application of the chi-square test to the comparisons of proportions. Data were analyzed using the statistical modulus Stratographics (Statistical Graphics Corporation, USA). Global significance levels were set at 0.05 for all tests.
Fig. 1 - Effects of sustained inspiration (SI) on a series of RR intervals in an indivi-dual in group I. Note the different phases of the maneuver and the characteristics of Phase 2 that portray the oscillation consequent to sustained inspiration, and the points of analysis and of maximal bradycardia (B
Results
Table I presents modulation energy values logarithmi-cally transformed of groups studied in the frequency do-main. Values for group IIa were significantly (p<0.001) lower than those for group Ia. Differences between values for groups IIb and group Ib were not significant. LnT rises at high frequency (HF) during controlled respiration (CR) in group IIa were lower than those in group Ia (p=0.02). LnTs in group IIb were not different from those in group Ib (p>0.05).
Values of SDNN and of D-BTmax in the time domain of
group IIa were smaller than those in group Ia (p<0.001, and p=0.03. respectively). Records for group IIb were not different from those for group Ib (Table I).
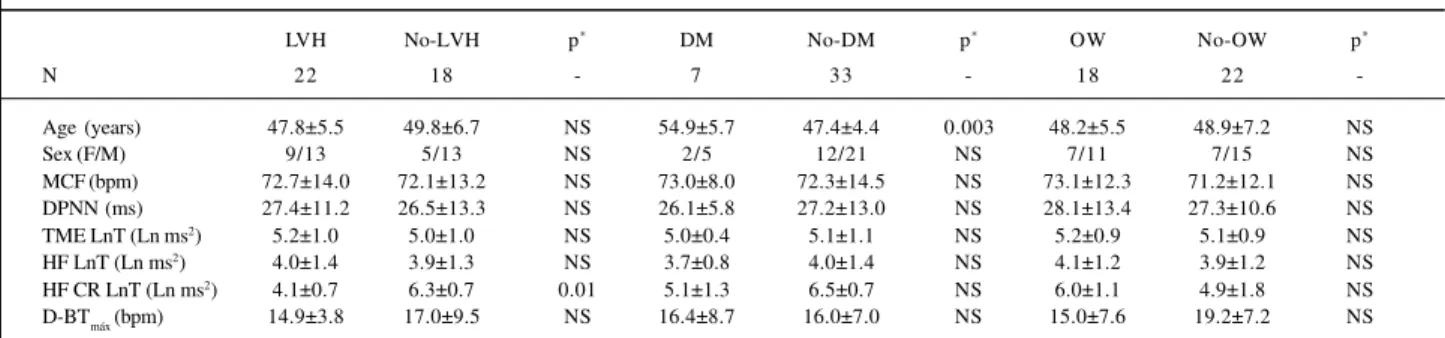
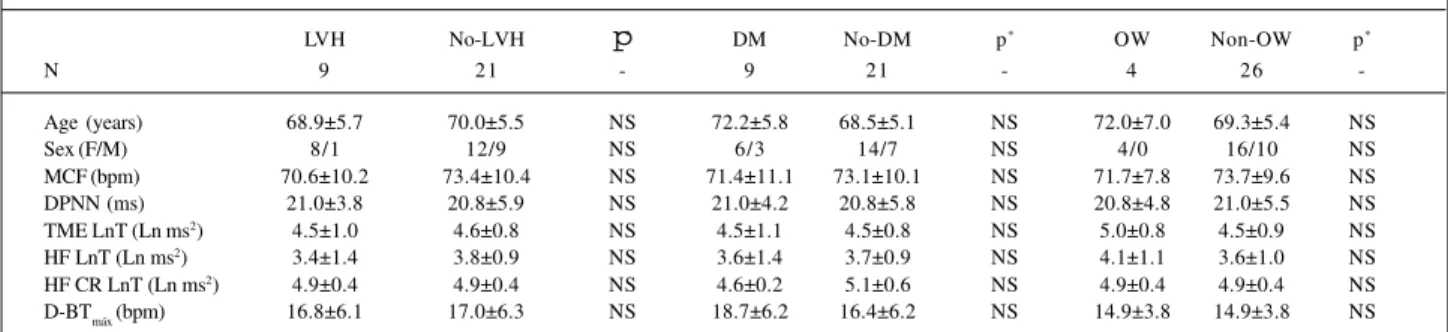
The presence of LVH, overweight, or diabetes did not significantly influence the variability in heart rate in groups IIa and IIb (Tables III and IV). Differences were recorded for HF CR and left ventricular hypertrophy for group IIa.
Table V shows frequency and time domains varia-bles sectioned according to age (for groups I and II). Between 40 and 59 years old, values after sectioning equal 74.1% specificity at high frequency (p<0.001) and 100% specificity at high frequency during controlled
Table III – Comparison between VRR parameters of group IIa patients with and without left ventricle hypertrophy (LVH), type II diabetes mellitus (DM), and overweight (OW)
LVH No-LVH p* DM No-DM p* OW No-OW p*
N 22 18 - 7 33 - 18 22
-Age (years) 47.8±5.5 49.8±6.7 NS 54.9±5.7 47.4±4.4 0.003 48.2±5.5 48.9±7.2 NS
Sex (F/M) 9/13 5/13 NS 2/5 12/21 NS 7/11 7/15 NS
MCF (bpm) 72.7±14.0 72.1±13.2 NS 73.0±8.0 72.3±14.5 NS 73.1±12.3 71.2±12.1 NS DPNN (ms) 27.4±11.2 26.5±13.3 NS 26.1±5.8 27.2±13.0 NS 28.1±13.4 27.3±10.6 NS TME LnT (Ln ms2) 5.2±1.0 5.0±1.0 NS 5.0±0.4 5.1±1.1 NS 5.2±0.9 5.1±0.9 NS HF LnT (Ln ms2) 4.0±1.4 3.9±1.3 NS 3.7±0.8 4.0±1.4 NS 4.1±1.2 3.9±1.2 NS HF CR LnT (Ln ms2) 4.1±0.7 6.3±0.7 0.01 5.1±1.3 6.5±0.7 NS 6.0±1.1 4.9±1.8 NS D-BTmáx (bpm) 14.9±3.8 17.0±9.5 NS 16.4±8.7 16.0±7.0 NS 15.0±7.6 19.2±7.2 NS
*- Level of statistical significance; values expressed as mean±SD; HF- high frequency; TME LnT- total modulatory energy; CR- controlled respiration; D-BT max -difference between maximal brady-and tachycardia during and following sustained inspiration; LnT- logarithmic transformation (refer to text for details).
Fig. 2 - Effect of controlled respiration (CR) on the power spectrum of subjects in group I. To the left, a series of normal RR intervals; to the right, the respective power spectrum in a basal record (above) and during the CR maneuver (below). Note that during CR, the energy of the spectrum is concentrated in the high frequency band and its value is significantly increased. VLF, very low frequency (0.01-0.05 HZ); LF, low frequency (0.05-0.15 Hz); HF, high frequency (0.15-0.40 Hz); insp - inspiration; exp - expiration.
Normal RR interval serie - Basal Spectral power density function
VLF
LF
HF
Frequency (Hz)
Normal RR interval serie - controlled respiration Spectral power density function
VLF LF
HF
Frequency (Hz) Time (s)
respiration (p<0.001). Values of 72.6% specificity (p<0.001) were found for total modulation energy.
Sensitivity was 67.1% at high frequency (p<0.001), 71.4% at high frequency during controlled respiration (p=0.001), and 80.7% for total modulation energy (p<0.001) in the frequency domain.
Variable values at sectioning in the time domain were 76.2% specificity for SDNN (p<0.001) and 91.3% for D-BTmax (p<0.001). Sensitivities had values of 61.0% for SDNN (p<0.001) and 54.4% for D-BTmax (p<0.001).
Discussion
Initial studies on the behavior of the variability of heart rate in systemic arterial hypertension were performed using techniques that analyzed reflex control of heart rate mediated by baroreceptors. Bristow et al 29 and Gribbin et al 30 showed that the reduction in heart rate consequent to
baroreceptor activation evoked by increased arterial pressure was significantly less conspicuous in hypertensi-ve individuals. Manci et al 31 verified that reflex tachycardia
caused by a lowered arterial pressure consequent to deacti-vation of baroreceptors was significantly smaller in hyper-tensive subjects. These findings demonstrate the close
Table IV – Comparison between VRR parameters of group IIb patients with and without left ventricle hypetrophy (LVH), type II diabetes mellitus (DM), and overweight (OW)
LVH No-LVH p* DM No-DM p* OW Non-OW p*
N 9 21 - 9 21 - 4 26
-Age (years) 68.9±5.7 70.0±5.5 NS 72.2±5.8 68.5±5.1 NS 72.0±7.0 69.3±5.4 NS
Sex (F/M) 8/1 12/9 NS 6/3 14/7 NS 4/0 16/10 NS
MCF (bpm) 70.6±10.2 73.4±10.4 NS 71.4±11.1 73.1±10.1 NS 71.7±7.8 73.7±9.6 NS
DPNN (ms) 21.0±3.8 20.8±5.9 NS 21.0±4.2 20.8±5.8 NS 20.8±4.8 21.0±5.5 NS
TME LnT (Ln ms2) 4.5±1.0 4.6±0.8 NS 4.5±1.1 4.5±0.8 NS 5.0±0.8 4.5±0.9 NS HF LnT (Ln ms2) 3.4±1.4 3.8±0.9 NS 3.6±1.4 3.7±0.9 NS 4.1±1.1 3.6±1.0 NS HF CR LnT (Ln ms2) 4.9±0.4 4.9±0.4 NS 4.6±0.2 5.1±0.6 NS 4.9±0.4 4.9±0.4 NS D-BT
máx (bpm) 16.8±6.1 17.0±6.3 NS 18.7±6.2 16.4±6.2 NS 14.9±3.8 14.9±3.8 NS *- Level of statistical significance; values expressed as mean±SD; HF- high frequency; TME LnT- total modulatory energy; CR- controlled respiration; D-BT
max -difference between maximal brady-and tachycardia during and following sustained inspiration; LnT- logarithmic transformation (refer to text for details).
relation between mechanisms controlling arterial pressure and the variability of heart rate, which are impaired in systemic arterial hypertension.
In the frequency domain, the power spectrum band re-presenting modulation energy of the vagosympathetic system (or total modulation energy) showed significantly lo-wer values in group IIa compared with values in group Ia (Table I). This demonstrates that in hypertensive individuals of this age group variability in heart rate is significantly blunted. On the other hand, in agreement with Aono et al 32,
we verified that values of total modulation energy were not different between groups Ib and IIb, verifying that in group IIa autonomic modulation of the heart was impaired by systemic arterial hypertension, but in group IIb, the reduced modulation caused by aging was not worsened by hyperten-sion. This is reinforced by the analysis of the predominantly vagal modulation. Thus, comparing groups I and IIa, both at rest and during controlled respiration, values were larger in group Ia (p<0.05). However, when values at high frequency and high frequency controlled respiration were analyzed under identical conditions, no significant differences bet-ween individuals in groups Ib and IIb were found (Table I).
On analyzing differences between high frequency values observed prior to and during controlled respiration within each group, we observed that the increase in vagal modulation energy was less expressive in group IIa, Ib and IIb. This result verifies that in the process of autonomic demodulation of the heart the parasympathetic loop was significantly blunted both by age and by arterial hyperten-sion. It is important to note that in individuals 60 years old and above, the presence of arterial hypertension does not intensify the decrease in modulating energy imposed by aging; this contrasts with effects observed among indivi-duals in group IIa. In the higher age group, increased arterial wall rigidity consequent to aging, which directly decreases pressoreceptor sensitivity, is not aggravated by increased levels of tension. In other conditions, like Parkinson’s disease, in which direct lesions of the autonomic nervous system may occur, values of the potency energy spectrum in the aged are significantly smaller than those observed in controls of the same age group 7. Similarly to that observed in
the frequency domain, variables in the time domain also
Tabela V – Diagnostic values of variables analyzed
Value at sectioning Specificity Sensitivity
≥ 40 years and < 60 years
MCF (bpm) 67.2 51.4 % (p<0.001) 33.5 % (p<0.001) DPNN (ms) 27.8 76.2 % (p<0.001) 61.0 % (p<0.001) TME LnT (Ln ms2) 304.9 72.6 % (p<0.001) 80.7 % (p<0.001) HF LnT (ms2) 121.5 74.1 % (p<0.001) 67.1 % (p<0.001) HF CR LnT (ms2) 497.7 100.0 % (p<0.001) 71.4 % (p<0.001 D-BT
máx (bpm) 16.4 91.3 % (p<0.001) 54.3 % (p<0.001)
≥ 60 years and ≤ 80 years
underwent alterations. On analyzing the DPNN values of group IIa, we verified that they were significantly smaller than those in group Ia (p=0.001, Table I). These differences were not significant between groups Ib and IIb. Yet, in the time domain, we observed that D-BTmax was significantly smaller in group IIa compared with that in group Ia (p=0.03), but it was not different in groups Ib and IIb.
The analysis of the variability in heart rate as a func-tion of the existence of diabetes, LVH, or overweight, we observed that this variability was not aggravated by the presence of these morbid conditions, both in regards to fre-quency and time (Tables II and IV). This finding differs from some reports in the specialized literature 33-35. It appears
plau-sible, therefore, that these conditions do not aggravate alte-rations determined by systemic hypertension properly.
From the etiopathogenetic viewpoint, autonomic dys-function determined by aging 32,36 or due to various diseases 6,7 is related to 2 basic causes: 1) alterations in
pressorecep-tor mediated reflexes and 2) intrinsic alteration of the vagosympathetic system.
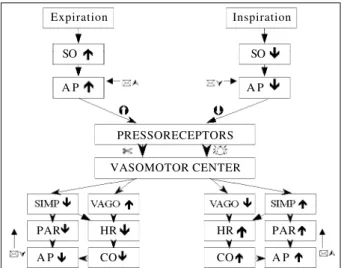
In healthy individuals, oscillation of intrathoracic pres-sure evoked by respiratory movement determines increases and decreases in systolic ejection volume 37. These
varia-tions contribute to a significant extent to modificavaria-tions in arterial pressure during the respiratory cycle. Variation in in-travascular arterial pressure conditioned by respiratory vement is perceived by pressoreceptors that modify, mo-ment by momo-ment, efferent potentials conducted to the vaso-motor center by the aortic and carotid depressor nerves. Upon arrival to the center and proper processing, this infor-mation travels via vagosympathetic efferent pathways to-wards the heart and vessels causing respectively, cyclic variation in heart rate (respiratory sinus arrhythmia) and peripheral arterial resistance, counteracting variations in stroke volume and preventing large fluctuations in arterial pressure (Figure 3).
In systemic arterial hypertension, pressoreceptor
me-diated regulatory mechanisms undergo recycling 38 and in
the same manner as in the aged become less sensitive. Con-sequently, reflexes show a reduction in gain, that is, a smaller number of action potentials per mm Hg of oscillation of arte-rial pressure in the depressor nerves occurs. The first reflexes act by displacing the threshold of pressoreceptor action to higher arterial pressure levels. The second stop the processing of small arterial pressure variations, atte-nuating the reflex-modulating capacity of the vagus nerve on heart rate variability, enhancing that of the sympathetic system on arterial vessels.
From the diagnostic viewpoint, by presenting better in-dexes of discrimination between groups I and II, total modula-ting energy (TME) and that relative to autonomic modulation including high frequency control of respiration and D-BTmax, may constitute an important auxiliary tool for the diagnosis of systemic arterial hypertension. Controlled high frequency res-piration allowed the identification of 100% of the individuals in group Ia and 71.4% of those in goup IIa; among all variables analyzed, it had the highest diagnostic value for subjects in groups Ib and IIb. Therefore, the presence of alterations in these indexes in patients with high pressure values reinforces a diagnosis of systemic arterial hypertension indicating the existence of an impaired cardiac modulating system.
Thus, we may state that variables that quantify varia-bility in heart rate both in the frequency and time domains, if recorded from patients with systemic arterial hypertension, have significantly lower values compared with the values in healthy subjects. This difference reflects the degree of impairment in baroreflex mediated autonomic cardiac modulation; it can corroborate the diagnosis of systemic arterial hypertension, bringing out the importance of age in the process of autonomic control of the heart.
Appendix
For the calculation of sensitivity and specificity, an em-pirical formula having the following steps was developed:
a) construct a histogram of distribution of values of variable X, divided into N classes with an amplitude interval for each numbered class (Ci), for groups I and II (see defini-tion under Methods). Intervals Ci are defined by lower [(lnf)Ci] and upper [Sup(Ci)], so that variable X belongs to the interval when lnf (Ci) ≤ X < Sup (Ci). Thus, functions p (XeC1)and q(XeC1), representing the values of the probabi-lity of X, associated with each Ci class of the respective his-tograms of groups I (p) and II (q), become defined.
b) the probability distribution function of variable X is defined by the cumulative sum of the probabilities of all N (Ci) of the histogram of each group. Thus, functions p(X≤Ci) and Q(X≤Ci) are functions of the distribution probability of X to represent the probability that values of X < Sup(Ci), respec-tively to groups I (p) and II (Q). p(X≤Ci) and Q(X≤Ci) are equal to 1 for CN , zero for C0, and grow monotonically.
c) Function M(Ci) is defined as [1-p(X≤Ci)] Q(X≤Ci). M(Ci) has values equal to zero at the extremes (CN and C0) and the maximal value between them (Cmax). Sensitivity is defined as Q(X≤Cmax), and specificity as [1-p(X≤Cmax)].
Fig. 3 - Representative scheme of the effect of respiratory phases of inspiration and expiration on the control of heart rate mediated by pressoreceptors. SO, systolic output; AP, arterial pressure; SIMP, sympathetic; PAR, peripheral arterial resistance; CO, cardiac output.
Expiration
SO
A P
Inspiration
SO
A P
PRESSORECEPTORS
VASOMOTOR CENTER
PAR HR HR PAR
References
1. Kavachi I, Sparrow D, Vokonas PS, et al. Decrease heart rate variability in men with phobic anxiety (data from the normative aging data). Am J Cardiol 1995; 75: 882-5.
2. Ajiki K, Murakawa Y, Yanagisawa-Miwa Usui M, et al. Autonomic nervous system activity in idiopatic dilated cardiomiopathy and in hyperttrophic cardiomiopathy. Am J Cardiol 1993; 71: 1316-20.
3. Ryan SM, Goldberger AL, Ruthazer R, et al. Spectral analysis of heart rate dynamics in elderly person with posprandial hypotension. Am J Cardiol 1992; 69: 201-5.
4. Bernardi L, Ricordi L, Lazzari P, et al. Impaired circadian modulation of sympa-thovagal activity in diabetes: a possible explanation for altered temporal onset of cardiovascular disease. Circulation 1992; 86: 1443-52.
5. Saul JP, Arai Y, Berger RD, et al. Assessement of autonomic regulation in chronic congestive heart failure by heart rate spectral analysis. Am J Cardiol 1988; 61: 1292-9.
6. Barbosa PR, Barbosa FJ, Morais de Sá CA. Influência da idade, sexo e doença coronária sobre a modulação autonômica do coração. Arq Bras Cardiol 1996; 67: 325-9. 7. Barbosa Filho J, Barbosa PRB, Papais-Alvarenga RM, et al. Modulação
au-tonômica cardíaca na doença de Parkinson. Rev Bras Neurol 1999; 35: 75-80. 8. Singh M, Juneja R, Bali HK, et al. Autonomic function in restrictive
cardiomyo-pathy an constrictive pericaditis: a comparison. Am Heart J 1998; 136: 443-8. 9. Huikuri HV, Ylitalo A, Pikkujämsä SM, et al. Heart rate variability in sistemic
hypertension. Am J Cardiol 1996; 77: 1073-7.
10. Huikuri HV, Linnaluoto MK, Sppänen T, et al. Circadian rhythim of heart rate variability in survivors of cardiac arrest. Am J Cardiol 1992; 70: 610-5. 11. Dougherty CM, Burr RL. Comparison of heart rate variability in survivors an
nonsurvivors of sudden cardiac arrest. Am J Cardiol 1992; 70: 441-8. 12. Hartikainen JE, Malik M, Staunton A, et al. Distiction between arrytmic and
nonarrhythmic death after acute myocardial infarction based on heart rate variabi-lity, signal-averaged electrocardiagram, ventricular arrhythmia and left ventricu-lar ejection fraction. J Am Coll Cardiol 1996; 28: 296-304.
13. Bigger Jr JT, Fleiss JL, Rolnitzky LM, et al. The ability of several short-time mea-sures of RR variability to predict mortality after after myocardial infarction. Circu-lation 1993; 88: 927-34.
14. La Rovere MT, Bigger JT, Marcus FI, et al. Baroreflex sensitivity and heart rate va-riability after myocardial infarction. ATRAMI (Autonnomic Tone and Reflexes Af-ter Myocardial Infarction) Investigators. Lancet 1998; 351: 478-84. 15. Kjellgren O, Ip J, Suth K, et al. The role of parasympathetic modulation of the
reentrant arrhytmic substrate in the genesis of sustained ventricular tachicardia. Pacing Clin Electrophysiol 1994; 17: 1276-87.
16. Huikuri HV, Mäkikallio TH, Airaksinen J, et al. Power-law relationship of heart rate variability as a predictor of mortality in the elderly. Circulation 1998; 97: 2031-6.
17. Mäkikallio TH, Koistinen J, Jordaens L, et al. Heart rate dynamics before spontaneous onset of ventricular fibrillattion in patients with healed myocardial infarcts. Am J Cardiol 1999; 83: 880-4.
18. Mäkikallio TM, Höiber S, Köber L, et al. Fractal analysis of heart rate dynamics as a predictor of mortality in patients with depressed left ventricular function after acute myocardial infarction. Am J Cardiol 1999; 83: 836-9.
19. Parati G, Di Rienzo M, Groppelli A, et al. Heart rate and blood pressure variability and their interation in hypertension. In: Malik M, Camm AJ (eds): Heart Rate Variability. Armonk, NY: Futura Publishing Co. Inc., 1995; cap. 35: 467-78. 20. Kosh M, Hausberg M, Barenbrock M, et al. Studies of cardiac sympathovagal
balance and large artery distensibility in patients with untreated essential hy-pertension. J Hum Hypertens 1999; 13: 315-9.
21. Guzzetti S, Piccaluga E, Casati R, et al. Sympathetic predominance inessential hypertension: a study employing spectral analysis of heart rate variability. J Hypertens 1988; 6: 711-7.
22. Piccirillo G, Munizzi MR, Fimognari, et al. Heart rate variability in hipertensive subjects. Int J Cardiol 1996; 53: 291-8.
23. Singh JP, Larson MG, Tsuji H, et al. Reduced heart rate variability and new onset hypertension: insight into patogenesis of hypertension: the Framingham Heart Study. Hypertension 1998; 32: 293-7.
24. Minami J, Kawano Y, Ishimitsu T, et al. Blunted parasympathetic modulation in salt-sensitive patients with essential hypertension evaluation by power-spectral analysis of heart rate variability. J Hypertens 1997; 15: 1997. 25. Presciuttini B, Duorez D, De Buyzere M, et al. How to study sympatho-vagal
balance in arterial hypertension and the effect of antihypertensive drugs. Actas Cardiol 1998; 53: 143-52.
26. Ylitalo A, Airaksinen J, Sellin L, et al. Effects of combination antihypertensive therapy on baroreflex sensity and heart rate variabilyti in sistemis hypertension. Am J Cardiol 1999; 83: 885-9.
27. Petretta M, Bonaduce D, Marciano F, et al. Effects of 1 year of lisinopril treatment on cardiac autonomic control in hypertensive patients with left ventricular hypertrophy. Hypertension 1996; 27: 330-8.
28. Barbosa PRB. A signal-averaging system for surface ECG signal analysis. Phys Med Biol 1994; 39: 412.
29. Bristow JD, Honour AJ, Pickering GW, et al. Diminised baroreflex sensitivity in high blood pressure. Circulation 1969; 39: 48-54.
30. Gribbin B, Pickering TG, Sleight P, et al. Effect of age and high blood pressure on baroreflex sensitivity in man. Circ Res 1971; 29: 424-31.
31. Mancia G, Ferrari A, Gregori L, et al. Blood pressure variability in man: its relation to age, high blood pressure and baroreflex sensitivity. Clin Sci 1980; 59: 401-3. 32. Aono T, Sato T, Nishinaga M, et al. Power spectral ana lysis of spontaneous blood
pres-sure and heart rate variabiliti in elderly hypertensives. Hypertens Res 1996; 19: 9-16. 33. Heikki VH, Ylitalo A, Pikkujämsä SM, et al. Heart rate variability in systemic
hypertension Am J Cardiol 1996; 77: 1073-7.
34. Kohara K, Hanara-Nakamura N, Hiwada K. Left ventricular mass index correlates with heart rate variability. Am J Hypertens 1995; 8: 183-8.
35. Pikkujamsa SM, Huikuri HV, Airaksinen KE, et al. Heart rate variability and baroreflex sensitivity in hypertensive subjects with and without me-tabolic features of insulin resistance syndrome. Am J Hypertens 1998; 11: 523-31.
36. Barbosa PR, Barbosa Filho J, Morais de Sá CA. Efeito da idade sobre a modulação autonômica do coração. Rev SOCERJ 1995; 3: 79-84.
37. Taylor JA, Eckberg D. Fundamental relations between short-term RR interval and arterial pressure oscillation in humans. Circulation 1996; 93: 1527-32. 38. Michelini LC. Regulação momento a momento da pressão arterial na