Blood Pressure, Metabolic and Autonomic Responses to Insulin and
Intralipid
®Infusion in Chagasic Patients
Claudia Cristina Soares Silva, Carlos Alberto Martins Santos, Cristiano Mostarda, Eduardo Moacyr Krieger, Heno
Ferreira Lopes
Instituto do Coração – InCor – Hospital das Clínicas da Faculdade de Medicina da Universidade de São Paulo, São Paulo, SP, Brazil
Abstract
Background: Intralipid® and heparin infusion results in increased blood pressure and autonomic abnormalities in
normal and hypertensive individuals.
Objective: To evaluate insulin sensitivity and the impact of Intralipid® and heparin (ILH) infusion on hemodynamic,
metabolic, and autonomic response in patients with the indeterminate form of Chagas’ disease.
Methods: Twelve patients with the indeterminate form of Chagas’ disease and 12 healthy volunteers were evaluated.
Results: Baseline blood pressure and heart rate were similar in both groups. Plasma noradrenaline levels were slightly increased in the Chagas’ group. After insulin tolerance testing (ITT), a significant decline was noted in glucose in both groups. ILH infusion resulted in increased blood pressure in both groups, but there was no significant change in plasma noradrenaline. The low-frequency component (LF) was similar and similarly increased in both groups. The high-frequency component (HF) was lower in the Chagas’ group.
Conclusion: Patients with the indeterminate form of Chagas’ disease had increased sympathetic activity at baseline and impaired response to insulin. They also had a lower high-frequency component and impaired baroreflex sensitivity at baseline and during Intralipid® and heparin infusion. (Arq Bras Cardiol 2012;98(3):225-233)
Keywords: Chagas disease; insulin/adverse effects; fat emulsions, intravenous/pharmacology; blood pressure.
Mailling Address: Heno Ferreira Lopes •
Av. Dr. Enéas C. Aguiar, 44, Bloco: 2, Sala: 8, Cerqueira César - 05403-000 – São Paulo, SP, Brasil
E-mail: [email protected], [email protected]
Manuscript received June 21, 2011, revised manuscript received September 01, 2011; accepted September 15, 2011.
acids in the circulation. In Brazil, there is a large population with Chagas’ disease2 that presents different autonomic
abnormalities related to sympathetic impairment. Sympathetic system injury is present in the peripheral organs and in the central nervous system. Consequently, these abnormalities have been considered as a model to analyze the response to acute challenges with different stimuli. Guariento et al3 showed
that chagasic patients who undergo glucose overload have a smaller increase in heart rate, blood pressure and insulin, which suggests a deficit in insulin production and action, or autonomic nervous system imbalance.
A necropsy study in women with Chagas’ disease showed a deficit in the intrapancreatic neuron population and the presence of leukocyte perineuronal4. These results
suggest a possible association between a lower number of intrapancreatic neuron and carbohydrate metabolism abnormalities, including hyperglycemia and diabetes. Insulin tolerance testing is an experiment that allows us to evaluate the hemodynamic profile and insulin sensitivity in healthy individuals and in individuals with different pathologies. ILH infusion is used to evaluate pancreatic response to fatty acids and the hemodynamic response to fatty acids. The aim of this study was to analyze the impact of insulin injection (bolus) and ILH infusion on hemodynamic, metabolic, and autonomic response in patients with the indeterminateform ofChagas’disease.
Introduction
Hypertension, obesity, insulin resistance and diabetes, a cluster of cardiovascular risk factors, are associated with increased morbidity and mortality. The mechanisms underlying insulin resistance, the metabolic and hemodynamic abnormalities associated with this condition, are not well established. However, it is well known that fatty acids have a relationship with insulin resistance and with hemodynamic abnormalities, such as increased blood pressure, heart rate, and decreased small vessel distensibility (impaired endothelial function)1.
Methods
Twelve patients with the indeterminateform of Chagas’ disease (Ch) and 12 healthy volunteers (C) matched for age, sex, race, blood pressure and heart rate were evaluated. The study was approved by the Ethics Committee of the Hospital das Clínicas of São Paulo University. All individuals signed an informed consent.
Screening tests – the screening tests included biochemistry, electrocardiography, and echocardiography. After patients fasted for 12 hours; samples of blood were drawn for biochemistry analysis (glucose, triglycerides, total cholesterol, LDL-cholesterol, HDL-cholesterol, uric acid, sodium potassium, urea, creatinine) and hemography was performed using an automated hematology analyzer XT-2000ii-XT-1800ii (Sysmex Corporation, Kobe, Japan). Sodium, potassium, glucose, and triglycerides were measured through the selective electrode method (IMT-Dade Behring, Newark, USA). Uric acid, urea, and creatinine were measured using the absorption photometry technique (colorimetric method). Total cholesterol and HDL-cholesterol were measured using the enzymatic colorimetric method, and LDL-cholesterol was calculated according to the Friedewald equation.
Electrocardiography – electrocardiography was performed with individuals in a supine position and a 12-channel model Page Writer 300i, 1770A (Philips, USA) EKG machine was used.
Echocardiography – echocardiographic images were acquired in a Sequoia device (Acuson Computed Sonography, Mountain View, CA) with multifrequency transducer (3V2C) and resources to obtain an M-mode echocardiogram, 2-dimensional, conventional continuous and pulsed Doppler, color Doppler and tissue Doppler. Images were registered on an optic disc and analyzed later. Individuals were maintained in a lateral position. The electrocardiogram registered continuously on a monitor during the test. Conventional echocardiography was performed in all individuals. Correct positioning for image acquisition in 2-dimensional-guided M-mode echocardiography, continuous and pulsed Doppler, was according to the guidelines of the American Society of Echocardiography5.
Insulin tolerance test – The individuals were admitted early in the morning after overnight fasting for the ITT. After admission, BP and heart rate were measured with the patient in the seated position before the I.V. (intravenous) line was started for ITT. Blood samples for biochemistry measurements were drawn before pushing I.V. insulin (0.05 UI/kg). Blood samples were drawn every 3 minutes from time zero to 15 minutes. Blood glucose was measured every 3 minutes by Accu-Chek (Advantage, ROCHE), and the test was interrupted if blood glucose dropped to 50 mg/dL or less and/or if the individual experienced any sort of symptoms. After the last blood draw, the individuals were fed. Meals were ad libitum, caffeine-free, and high carbohydrate to return serum blood glucose to a safe level. Thirty minutes later, glucose control was repeated, and if normal, the individual was discharged. Intralipid® and heparin infusion – Plasma fatty acid and
triglycerides were acutely elevated in the laboratory with an infusion of Intralipid® and heparin. Intralipid® 20% (Baxter
Healthcare Corporation, Glendale, CA) was infused at 0.8
mL/m2/min. Heparin (1000 U bolus, followed by 200 U/h)
was given to activate endothelial lipoprotein lipase and accelerate hydrolysis of fatty acids from the glycerol backbone of triglycerides. The infusion time was up to 3 hours. Blood samples were drawn at time zero, 90 and after 180 minutes for biochemistry measurements. Blood pressure was measured beat-to-beat (Finometer, FMS, Finapres Medical System BV, Holland) at baseline and during ILH infusion.
Pulse Interval Variability—Time-domain analysis consisted of calculating mean pulse interval (PI) or R-R interval (RR), followed by their variability as the standard deviation from its respective time series. In the frequency-domain analysis, fast Fourier transforming methods were used to evaluate pulse interval and R-R interval variability. The spectral bands, commonly used for humans, are very low frequency (VLF), 0.0-0.04 Hz; LF, 0.04-0.15 Hz; HF, 0.15-0.4 Hz. Spectral power for low- and high-frequency bands was calculated by power spectrum density integration within each frequency band width. The power density of each spectral component was calculated both in absolute values and in normalized units. The power in low and high frequencies for pulse interval was normalized by calculating the variance minus the power in very low frequency and was expressed in normalized units (nu). The sympathovagal balance was defined by the LF/HF ratio. The LF component of R-R variability was considered a marker of efferent sympathetic cardiac and vascular modulation, respectively, whereas the HF component of the R-R or pulse interval variability would reflect respiratory-driven vagal modulation to the sinoatrial node. Beat-to-beat values of R-R interval were used to estimate cardiac baroreflex sensitivity (BRS) through the spectral analysis, using the alpha index for the low-frequency band (0.04-0.15 Hz).
Baroreflex sensitivity – The sensitivity of the baroreceptor heart rate reflex was assessed throughout a beat-to-beat blood pressure register through the analysis of systolic blood pressure (SBP) and pulse interval (PI) variation with a time domain. Time domain parameters consisted of calculation of average values of PI, SBP, and the variability of pulse interval and systolic blood pressure quantified by standard deviation of each one (PI sd and SBP sd, respectively). Welch’s Periodogram Method assisted by the Matlabprogram (automatic detection of systolic events from blood pressure wave) was used to analyze SBP and PI in the frequency domain. Relevant band frequency for spectral analysis in humans is between zero and 0.4 Hz. The spectral power was integrated in 3 bands of relevance: HF that is between 0.4 and 0.15 Hz; LF that is between 0.15 and 0.04 Hz; VLF that is lower than 0.04 Hz, and the autonomic balance was calculated according to the LF/HF ratio.
The alpha index (baroreflex by spectral analysis) was calculated after the link between PI and SBP was checked by using the function of coherence in the frequency between 0.15 and 0.4 Hz. Coherence value (K) higher than 0.5 was considered significant.
Statistical analysis
means obtained in time domain (hemodynamic measures) were compared using General Linear Model — repeated measures. SPSS software (Chicago, IL, USA) was used to analyze data. A
P value <0.05 was adopted as statistically significant.Data are shown as mean± SD. Biochemical values, insulin and noradrenaline with nonparametric distribution were evaluated by the Wilcoxon signal test. The comparison between groups for these biochemical variables, including the nonparametric ones, was performed using the Mann-Whitney test6.
Results
Demographic data are shown in Table 1. Baseline biochemistry data are shown in Table 2. Baseline insulin was higher (p<0.05) in Ch compared with the C group (29±60 vs 6±20 µUI/mL, respectively) and increased significantly in both groups during ITT, mainly in C (from 6±20 to 114±6 µUI/mL). Plasma glucose decreased significantly in both groups after insulin bolus; it changed 40 mg/dL on average in both groups. Blood pressure and heart rate were similar in C and Ch groups. Systolic and diastolic BP increased significantly
in the C group after insulin bolus (Figures 1a and 1b). Heart rate also increased significantly in the C group after insulin bolus (Figure 1c).
The Ch group had higher baseline plasma noradrenaline at baseline compared with the C group; however, the C group had a significant increase in noradrenaline concentration after insulin bolus, but in the Ch group, noradrenaline did not differ (Figure 2).
Triglyceride levels were similar in both groups at baseline and increased 473 mg/dL in the C group and 475 mg/ dL in the CH group. Systolic and diastolic BP increased significantly in both groups during ILH infusion (Figures 3a and 3b). Baseline heart rate did not differ between groups and increased significantly in Ch compared with C during ILH infusion (Figure 3c).
Noradrenaline concentration increased significantly in C (102±24 to 137±39 pg/mL, p<0.05) compared with Ch (157±91 to 179±131 pg/mL, p>0.05) during ILH infusion. Baseline LF/HF ratio, which indicates the sympathetic and parasympathetic component balance, was similar in both
Table 1 – Demographic data of Control and Chagasic groups
Variables Control group n=12 Chagasic group n=12 p-Value
Age (years) 32 ± 6 41 ± 8 NS
Sex (F/M) 8/4 8/4 NS
Race 10 white 10 white NS
2 nonwhite 2 nonwhite
Weight (kg) 67 ± 10 61 ± 12 NS
Height (m) 1.67 ± 0.09 1.57 ± 0.15 NS
BMI (kg/m2) 23.87 ± 2.49 24.40 ± 2.16 NS
F – Female; M – Male; BMI – Body mass index; NS - No signiicant.
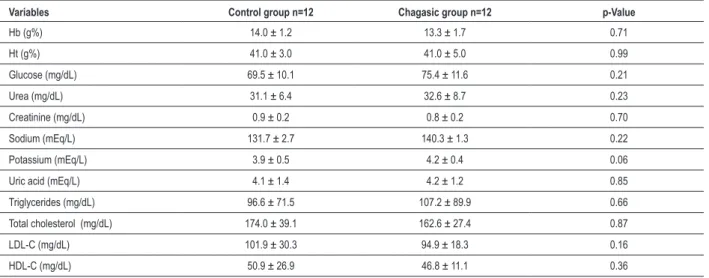
Table 2 — Biochemistry data from Control and Chagasic groups
Variables Control group n=12 Chagasic group n=12 p-Value
Hb (g%) 14.0 ± 1.2 13.3 ± 1.7 0.71
Ht (g%) 41.0 ± 3.0 41.0 ± 5.0 0.99
Glucose (mg/dL) 69.5 ± 10.1 75.4 ± 11.6 0.21
Urea (mg/dL) 31.1 ± 6.4 32.6 ± 8.7 0.23
Creatinine (mg/dL) 0.9 ± 0.2 0.8 ± 0.2 0.70
Sodium (mEq/L) 131.7 ± 2.7 140.3 ± 1.3 0.22
Potassium (mEq/L) 3.9 ± 0.5 4.2 ± 0.4 0.06
Uric acid (mEq/L) 4.1 ± 1.4 4.2 ± 1.2 0.85
Triglycerides (mg/dL) 96.6 ± 71.5 107.2 ± 89.9 0.66
Total cholesterol (mg/dL) 174.0 ± 39.1 162.6 ± 27.4 0.87
LDL-C (mg/dL) 101.9 ± 30.3 94.9 ± 18.3 0.16
HDL-C (mg/dL) 50.9 ± 26.9 46.8 ± 11.1 0.36
Figure 1 – Systolic, diastolic BP, and heart rate (mean ± SD) at baseline and after ITT.
Systolic BP
Before After
*p < 0.05 – Systolic BP increase in C group.
Control Group Chagasic Group
(m
m
H
g)
(m
m
H
g)
Diastolic BP
Control Group Chagasic Group
Before After
*p < 0.05 – Diastolic BP increase in C group.
Heart Rate
Before After
Control Group Chagasic Group
(bpm
)
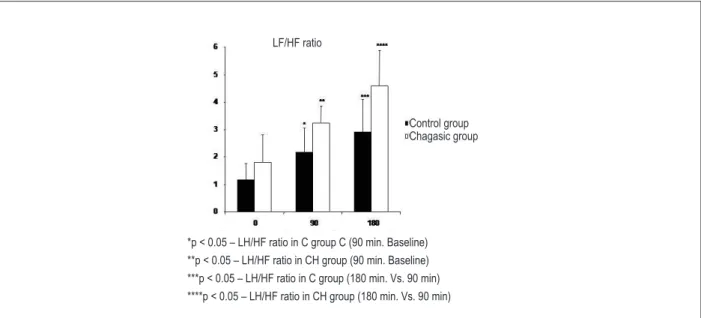
groups at baseline and increased significantly during ILH infusion in C and Ch groups (Figure 4).
At baseline and during ILH infusion, the Ch group had a higher LF/HF ratio, although it was not significant. Baseline baroreflex sensitivity was lower in the Ch group, and this difference was sustained during ILH infusion (Figure 5). Baroreflex sensitivity in the C group had a tendency to decline after 180 minutes of infusion and did not differ in the Ch group.
Discussion
In this case control study, 12 individuals with the indeterminate form ofChagas’disease and 12 healthy volunteers matched for age, sex, race, body mass index, blood pressure, heart rate and biochemical variables were evaluated. The Ch group had baseline insulin and noradrenaline levels higher than those of the C group.
There is no consensus in the literature regarding baseline plasma insulin in chagasic patients or insulin behavior after ITT. We observed a significant increase in insulin levels in the C group and a slight increase in chagasic patients during ITT.
These results reinforce previous information regarding an impaired pancreatic response that resulted from a deficit in the intrapancreatic neuron population. The heterogeneous response of insulin to glucose overload in chagasic patients is well known3. A parasympathetic denervation and beta cell
abnormalities have been discussed as possible explanations for these alterations in the metabolism of glucose in chagasic patients2. On the day of ITT, baseline glucose level was slightly
lower in the Ch group.
In a previous study, Guariento et al7 already observed
the same situation in patients with the indeterminate form of Chagas’ disease. Glucose metabolism, including insulin release, is related, at least partly, to autonomic nervous system integrity. Chagas’ disease affects not only the parasympathetic nervous system, but also the sympathetic component of the autonomic nervous system.
Regarding glucose, during ITT, insulin bolus resulted in a similar decline in blood glucose in the Ch and C groups. In relation to the hemodynamic responses, the similar decrease in glucose in both groups resulted in a significant increase in the systolic and diastolic BP, and in the heart rate in the C group after insulin bolus, compared with that in the Ch group. This hemodynamic response to insulin during ITT suggests an increase in sympathetic activity, and this response is probably blunted in chagasic patients once this population is considered denervated. In a study involving chagasic patients, Guariento et al7 showed an impaired BP and heart
rate response to a glucose overload, a stimuli for insulin production.
Although the baseline plasma noradrenaline was higher in the Ch group on the day of ITT, the response to insulin bolus resulted in a significant increase in noradrenaline in the C group and did not change in the Ch group. It also suggests a blunted sympathetic response in chagasic patients, because this population has the autonomic nervous system affected at different degrees and in different locations.
According to previous studies8, the main part of the
autonomic nervous system affected in chagasic patients is the parasympathetic system. However, Chagas’ disease can affect
Figure 2 – Plasma noradrenaline (mean ± SD) at baseline and after insulin bolus during ITT. Control group
Chagasic group
Before After
Fig. 3 – Variação da pressão arterial sistólica e diastólica e frequência cardíaca (média ± DP) durante infusão de ILH a 0, 90 e 180 minutos.
Systolic BP
Control Group Chagasic Group
*p < 0.05 – Systolic BP increase in C group (time 180 vs. Time 0) **p < 0.05 – Systolic BP increase in CH group (time 180 vs. Time 0)
Diastolic BP
m
gH
g
m
gH
g
Control Group Chagasic Group
*p < 0.05 – Diastolic BP increase in C group (time 180 vs. Time 0) **p < 0.05 – Diastolic BP increase in CH group (time 180 vs. Time 0)
Heart Rate
Control Group Chagasic Group
Figure 4 – Low frequency (LF) component (mean ± SD) in normalized potency (n.u.), high frequency (HF) component (mean ± SD) in normalized potency (n.u.), and LF/HF ratio components during ILH infusion.
Figure 5 – Barorelex sensitivity at baseline and during the ILH infusion.
the brain, and the main mechanism for noradrenaline release mediated by insulin depends on the central mechanism (hypothalamus stimulus)9.
On the day of ILH infusion, the baseline triglycerides were similar in both groups. After 3 hours of ILH infusion, triglycerides increased significantly, and this increase was similar in both the C and Ch groups. The main aim of ILH infusion was to increase the blood concentration of triglycerides and consequently the fatty acids.
Friedberg et al10 have already shown a good correlation
between triglycerides and fatty acids in the circulation. Baseline blood pressure and heart rate before ILH infusion were similar in both groups. ILH infusion resulted in a significant increase in systolic and diastolic blood pressure in the C and Ch groups. The increase in heart rate after the ILH infusion in the Ch group was significant, while the change in the C group was slight.
Gadegbeku et al11 showed that ILH impairs baroreflex
sensitivity in lean and obese patients. Because baroreflex
LF/HF ratio
Chagasic group Control group
*p < 0.05 – LH/HF ratio in C group C (90 min. Baseline) **p < 0.05 – LH/HF ratio in CH group (90 min. Baseline) ***p < 0.05 – LH/HF ratio in C group (180 min. Vs. 90 min) ****p < 0.05 – LH/HF ratio in CH group (180 min. Vs. 90 min)
alpha index
Chagasic group Control group
sensitivity is affected in chagasic patients12, the increase in heart
rate in the presence of increased blood pressure may reflect an impairment in an already blunted reflex. Nonetheless, ILH is related to an increase in heart rate in healthy individuals1.
As discussed before13, the sympathetic nervous system
activity seems to be an important mechanism in metabolic syndrome, and insulin alteration can be an abnormality, among several others, that can explain the sympathetic hyperactivity. We found baseline plasma insulin higher in the Ch group, and noradrenaline was higher in this group, supporting the idea that insulin alteration is related to the sympathetic activity. We must emphasize that chagasic patients are not the best model to be used for this association, and further studies using this model or others can support or contest this result. On the other hand, insulin did not increase after ITT testing.
In relation to the ILH infusion, a significant increase in plasma insulin occurred in the C group and did not differ in the Ch group. According to the literature, free fatty acids increased insulin in healthy individuals. Even though there is controversy regarding this issue, considering that the pancreas of chagasic patients is denervated, this can reflect the absence of enervation and the autonomic abnormalities frequently observed in chagasic patients. However, these data are new and need more studies, using the same model, to be confirmed.
Plasma noradrenaline at baseline was higher in the Ch group than in the C group, and the ILH infusion resulted in a significant increase in the C group while it did not change in the CH group, an observable fact that can be explained by autonomic abnormalities commonly present in patients with Chagas’ disease. Considering that chagasic patients had an increase in blood pressure and heart rate, the mechanism for this hemodynamic change should be independent of the autonomic nervous system. Egan13 in a review article mentioned the importance of alpha
receptor activation by oleate in rats. It suggests that a possible mechanism of sympathetic activation resulted from ILH infusion. Spectral analysis was also performed in this study to evaluate the sympathetic and parasympathetic components at baseline and during ILH infusion.
Using this method, Paolisso et al14 showed an increase in
the LF component in healthy individuals who underwent ILH infusion. In this study, the baseline LF component was slightly higher in the Ch group, but did not achieve statistical significance.
This small difference sustained during ILH infusion and an intragroup increase occurred at minutes 90 and 180 compared with baseline. As for the HF component, at baseline it was slightly lower in the C group compared with the Ch group, and during ILH infusion this component decreased significantly in both groups. These data corroborate the previous finding of impairment in parasympathetic activity in chagasic patients. L/F ratio behavior was similar in both groups and also reflected the profile of the LF and HF components at baseline and during ILH infusion.
Baseline baroreflex sensitivity was significantly lower in the Ch group. This difference was maintained during ILH infusion. The C group had a tendency towards decrease in baroreflex sensitivity during ILH infusion, a phenomenon already observed by Gadegbeku et al11 Although acute hyperlipidemia resulting
from ILH infusion has been tested in different experimental and clinical models, this is the first time it has been tested in patients with the indeterminateform ofChagas’ disease, a model of autonomic system imbalance. New studies are necessary to better understand the effects of ILH in the neural control of blood pressure and heart rate, not only in chagasic but also in healthy individuals.
In conclusion, our data show higher sympathetic activity in patients with the indeterminateform ofChagas’disease, lower blood pressure response in chagasic patients during ITT, a significant increase in the blood pressure and sympathetic activity in chagasic patients and controls during Intralipid® and heparin
infusion, and decreased baroreflex sensitivity in chagasic patients and controls during Intralipid® and heparin infusion.
Potential Conflict of Interest
No potential conflict of interest relevant to this article was reported.
Sources of Funding
This study was partially funded by FAPESP.
Study Association
This article is part of the thesis of doctoral submitted by Claudia Cristina Soares Silva, from Faculdade de Medicina da USP.
References
1. Stojiljkovic MP, Zhang D, Lopes HF, Lee CG, Goodfriend TL, Egan BM. Hemodynamic effects of lipids in humans. Am J Physiol Regul Integr Comp Physiol. 2001;280(6):R1674-9.
2. Oliveira F, Bicalho GVC, Souza Filho LD, Silva MJ, Gomes Filho ZC. Características epidemiológicas dos pacientes com Doença de Chagas. Rev Bras Med Fam e Com. 2006;2(6):107-13.
3. Guariento ME, Saad MJ, Muscelli EO, Gontijo JA. Heterogenous insulin response to an oral glucose load by patients with the indeterminate clinical form of Chagas’ disease. Braz J Med Biol Res. 1993;26(5):491-5.
4. Koberle F. Patogenia da moléstia de Chagas: estudo dos órgãos musculares ocos. Rev Goiana Med. 1957;3:155.
5. Quinones MA, Otto CM, Stoddard M, Waggoner A, Zoghbi WA. Recommendations for quantification of Doppler echocardiography: a report from the Doppler Quantification Task Force of the Nomenclature and Standards Committee of the American Society of Echocardiography. J Am Soc Echocardiogr. 2002;15(2):167-84.
6. Rosner B. Fundaments of biostatistics. New York: Duxbury Press; 1994.
7. Guariento ME, Olga E, Muscelli A, Gontijo JA. Chronotropic and blood pressure response to oral glucose load in Chagas’ disease. São Paulo Med J. 1994;112(3):602-6.
9. Sauter A, Goldstein M, Engel J, Ueta K. Effect of insulin on central catecholamines. Brain Res. 1983;260(2):330-3.
10. Friedberg SJ, Klein RF, Trout DL, Bogdonoff MD, Estes EH Jr. The incorporation of plasma free fatty acids into plasma triglycerides in man. J Clin Invest. 1961;40:1846-55.
11. Gadegbeku CA, Dhandayuthapani A, Sadler ZE, Egan BM. Raising lipids acutely reduces baroreflex sensitivity. Am J Hypertens. 2002;15(6):479-85.
12. Junqueira Junior LF, Gallo Junior L, Manco JC, Marin-Neto JA, Amorim DS. Subtle cardiac autonomic impairment in Chagas’ disease detected by baroreflex sensitivity testing. Braz J Med Biol Res. 1985;18(2):171-8.
13. Egan BM. Insulin resistance and the sympathetic nervous system. Curr Hypertens Rep. 2003;5(3):247-54.