BGD
8, 487–525, 2011Phytoplankton diversity in a tropical
estuary
E. J. Rochelle-Newall et al.
Title Page
Abstract Introduction
Conclusions References
Tables Figures
◭ ◮
◭ ◮
Back Close
Full Screen / Esc
Printer-friendly Version Interactive Discussion
Discussion
P
a
per
|
Dis
cussion
P
a
per
|
Discussion
P
a
per
|
Discussio
n
P
a
per
|
Biogeosciences Discuss., 8, 487–525, 2011 www.biogeosciences-discuss.net/8/487/2011/ doi:10.5194/bgd-8-487-2011
© Author(s) 2011. CC Attribution 3.0 License.
Biogeosciences Discussions
This discussion paper is/has been under review for the journal Biogeosciences (BG). Please refer to the corresponding final paper in BG if available.
Phytoplankton diversity and productivity
in a highly turbid, tropical coastal system
(Bach Dang Estuary, Vietnam)
E. J. Rochelle-Newall1,*, V. T. Chu2, O. Pringault1, D. Amouroux3, R. Arfi4, Y. Bettarel1, T. Bouvier1, C. Bouvier1, P. Got1, T. M. H. Nguyen2, X. Mari1, P. Navarro3, T. N. Duong2, T. T. T. Cao2, T. T. Pham2, S. Ouillon5, and J.-P. Torr ´eton1
1
ECOSYM, UMR 5119 (CNRS-IRD-UM2-IFREMER), Universit ´e Montpellier II, Case 093, Place Bataillon, 34095 Montpellier, France
2
Institute of Marine Environment and Resources (IMER), 246 Da Nang Street, Hai Phong city, Vietnam
3
LCABIE-IPREM UMR 5254 (CNRS-UPPA), Universit ´e de Pau et des Pays de l’Adour, H ´elioparc, 2 av. Pdt Angot, 64053 Pau, France
4
BGD
8, 487–525, 2011Phytoplankton diversity in a tropical
estuary
E. J. Rochelle-Newall et al.
Title Page
Abstract Introduction
Conclusions References
Tables Figures
◭ ◮
◭ ◮
Back Close
Full Screen / Esc
Printer-friendly Version Interactive Discussion
Discussion
P
a
per
|
Dis
cussion
P
a
per
|
Discussion
P
a
per
|
Discussio
n
P
a
per
|
5
LEGOS, UMR 5566 (CNES-CNRS-IRD-UPS), Universit ´e de Toulouse, 14 avenue Edouard Belin, 31400, Toulouse, France
∗
now at: BIOEMCO, UMR 7618 (UPMC-CNRS-INRA-ENS-IRD-AgroParisTech-Universit ´e Paris-Est), Ecole Normale Sup ´erieure, 46 rue d’Ulm, 75005 Paris, France
Received: 14 December 2010 – Accepted: 27 December 2010 – Published: 18 January 2011
Correspondence to: E. J. Rochelle-Newall (emma.rochelle-newall@ird.fr)
BGD
8, 487–525, 2011Phytoplankton diversity in a tropical
estuary
E. J. Rochelle-Newall et al.
Title Page
Abstract Introduction
Conclusions References
Tables Figures
◭ ◮
◭ ◮
Back Close
Full Screen / Esc
Printer-friendly Version Interactive Discussion
Discussion
P
a
per
|
Dis
cussion
P
a
per
|
Discussion
P
a
per
|
Discussio
n
P
a
per
|
Abstract
The factors controlling estuarine phytoplankton diversity and production are relatively well known in temperate systems. Less however is known about the factors affecting phytoplankton community distribution in tropical estuaries. This is surprising given the economic and ecological importance of these large, deltaic ecosystems, such as are 5
found in South East Asia. Here we present the results from an investigation into the factors controlling phytoplankton distribution and phytoplankton-bacterial coupling in the Bach Dang Estuary, a sub-estuary of the Red River system, in Northern Vietnam. Phytoplankton diversity and primary and bacterial production, nutrients and metallic contaminants (mercury and organotin) were measured during two seasons: wet (July 10
2008) and dry (March 2009). Phytoplankton community composition differed between the two seasons with only a 2% similarity between July and March. The large spa-tial extent and complexity of defining the freshwater sources meant that simple mixing diagrams could not be used in this system. We therefore employed multivariate anal-yses to determine the factors influencing phytoplankton community structure. Salinity 15
and suspended particulate matter were important factors in determining phytoplank-ton distribution, particularly during the wet season. We also show that phytoplankphytoplank-ton community structure is probably influenced by the concentrations of mercury species (inorganic mercury and methyl mercury in both the particulate and dissolved phases) and of tri-, di, and mono-butyl tin species found in this system. Freshwater phytoplank-20
ton community composition was associated with dissolved methyl mercury and par-ticulate inorganic mercury concentrations during the wet season, whereas, during the dry season, dissolved methyl mercury and particulate butyl tin species were important factors for the discrimination of the phytoplankton community structure. Phytoplankton-bacterioplankton coupling was also investigated during both seasons. In the inshore, 25
BGD
8, 487–525, 2011Phytoplankton diversity in a tropical
estuary
E. J. Rochelle-Newall et al.
Title Page
Abstract Introduction
Conclusions References
Tables Figures
◭ ◮
◭ ◮
Back Close
Full Screen / Esc
Printer-friendly Version Interactive Discussion
Discussion
P
a
per
|
Dis
cussion
P
a
per
|
Discussion
P
a
per
|
Discussio
n
P
a
per
|
where BP:DPP values were less than 1, potentially reflecting differences in primary production due to shifting phytoplankton community diversity.
1 Introduction
Determining the factors that control diversity and function in an ecosystem is of funda-mental importance if we wish to understand how ecosystems respond to climate and 5
man-induced change. This is of particular importance in coastal ecosystems because despite their relatively small total area as compared to that of the global ocean, they play an important role in the aquatic carbon cycle (e.g., Borges et al., 2005). More-over, with a large percentage of the world’s population living within 100 km of the coast (Halpern et al., 2008), the impact of mans’ activities on aquatic biodiversity and function 10
cannot not be ignored.
Coastal seas and estuaries are ecosystems where the mixing of fresh and marine waters exerts considerable changes in physico-chemical properties and biological pro-cesses. Overlain with this are the impacts of waste water and other effluents from industrial and urban activities. All of which can exert a non-negligible impact on the 15
structure and function of planktonic communities. For example, differences in phy-toplankton and bacterioplankton salinity and nutrient tolerances can induce marked shifts in community diversity along estuarine salinity gradients. In a comparison of 9 European estuaries, Lemaire et al. (2002) found large changes in phytoplankton di-versity along the salinity gradients. Similarly, Muylaert et al. (2009), report that in the 20
Scheldt Estuary few taxa are present along the entire salinity gradient. Bacterial com-munity composition also changes along salinity gradients. In the Choptank Estuary, del Giorgio and Bouvier (2002) demonstrated clear differences in community composition between the freshwater end of the estuary where theβ-proteobacteria dominated and the higher salinity end where theα-proteobacteria were more dominant. Moreover, re-25
BGD
8, 487–525, 2011Phytoplankton diversity in a tropical
estuary
E. J. Rochelle-Newall et al.
Title Page
Abstract Introduction
Conclusions References
Tables Figures
◭ ◮
◭ ◮
Back Close
Full Screen / Esc
Printer-friendly Version Interactive Discussion
Discussion
P
a
per
|
Dis
cussion
P
a
per
|
Discussion
P
a
per
|
Discussio
n
P
a
per
|
Shifting community diversity also exerts an effect on biogeochemical processes and carbon fluxes. Variations in primary production, respiration andpCO2flux along
estuar-ine salinity gradients are probably related to the shifting community diversity, available nutrients and organic carbon and turbidity (Smith and Kemp, 2001; Fisher et al., 1988, 1998). It is therefore probable that estuarine metabolic balance is intimately linked to 5
that of biological diversity (Borges et al., 2006). Indeed, in Chesapeake Bay, Smith and Kemp (2001) proposed that the shifts observed in the ratio of photosynthesis to respiration (P:R), a measure ecosystem metabolism, were due to changes in the phy-toplankton populations present. This, combined with changes in bacterial community composition and cell activity levels (Bouvier and del Giorgio, 2002) and DOM concen-10
tration and bioavailability (Raymond and Bauer, 2000; Rochelle-Newall et al., 2007) all point towards the importance of understanding the factors that control community composition in estuarine and coastal waters.
Although several studies have examined the links between the factors influencing phytoplankton diversity and the relationship between primary production and respi-15
ration in estuarine and coastal systems in temperate ecosystems (e.g., Chesapeake Bay, Columbia River Estuary), less research has been focused on the factors that control phytoplankton diversity in tropical coastal ecosystems. Nutrient concentration and availability is an obvious factor controlling phytoplankton biomass (Ferguson et al., 2004; Jacquet et al., 2006), particularly in estuaries, however, other factors such as 20
heavy metal contamination can also be important in sensitive coastal ecosystems (see review of Peters et al., 1997). The high toxicity of mercury and methyl-mercury to humans is well known and this has spurred many of the investigations of the role and bioaccumulation of this metal in aquatic food webs (e.g., Duarte et al., 2007; Ullrich et al., 2001; Downs et al., 1998). However, few studies have examined the 25
BGD
8, 487–525, 2011Phytoplankton diversity in a tropical
estuary
E. J. Rochelle-Newall et al.
Title Page
Abstract Introduction
Conclusions References
Tables Figures
◭ ◮
◭ ◮
Back Close
Full Screen / Esc
Printer-friendly Version Interactive Discussion
Discussion
P
a
per
|
Dis
cussion
P
a
per
|
Discussion
P
a
per
|
Discussio
n
P
a
per
|
organo-tin compounds have focused on invertebrates and some have pointed out the negative impact of TBT (tributyltin) on phytoplankton populations (Sargian et al., 2005). However, few have looked at the role of these and other contaminants in determining phytoplankton community structure and microbial carbon flow in tropical estuaries. In the southwest lagoon of New Caledonia, an oligotrophic coral reef lagoon, it has been 5
recently shown that elevated heavy metal concentrations can influence phytoplankton community structure, particularly in sites that had no prior exposure to elevated zinc and nickel concentrations (Rochelle-Newall et al., 2008a). However, the impact of other heavy metals, such as mercury and organo-tin on the lower levels of the food web of tropical, eutrophic coastal ecosystems has largely been ignored despite their ecologi-10
cal and biogeochemical importance in terms of coastal carbon fluxes (Borges, 2005). Here we present an investigation into some of the factors potentially controlling phy-toplankton diversity during two seasons in a turbid, tropical estuarine system (Bach Dang River Estuary, North Vietnam). We then link this to primary and bacterial produc-tion in an attempt to determine the factors controlling the carbon cycle within a South-15
East Asian estuary. The objective of this work was therefore to determine the factors controlling phytoplankton diversity and to determine if these shifts then manifest in an alteration in biogeochemical processes.
2 Materials and methods
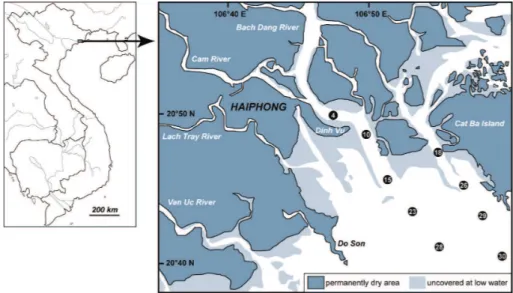
The study site is located in the Bach Dang Estuary, North Vietnam. This site is a large 20
estuary (20◦N, 106◦E), covering approximately 325 km2and forming the northeastern part of the Red River Delta complex (Fig. 1). Bach Dang, Cam and Lach Tray rivers are main tributaries of the Red-Thai Binh river system. The site is subject to a sub-tropical climate with a wet season (May–September) associated with the south monsoon and a dryer, cooler season (October–April) associated with the northeast monsoon. Sam-25
BGD
8, 487–525, 2011Phytoplankton diversity in a tropical
estuary
E. J. Rochelle-Newall et al.
Title Page
Abstract Introduction
Conclusions References
Tables Figures
◭ ◮
◭ ◮
Back Close
Full Screen / Esc
Printer-friendly Version Interactive Discussion
Discussion
P
a
per
|
Dis
cussion
P
a
per
|
Discussion
P
a
per
|
Discussio
n
P
a
per
|
were sampled for phytoplankton diversity and abundance, organic and inorganic nutri-ents and carbon and the concentration of organotin (mono-, di, and tri-butyl tin) and methyl mercury in both the particulate and dissolved fractions.
The locations of the stations are given in Table 1. At each sampling station, a CTD profiler (SeaBird SBE19) was deployed to measure temperature, salinity, photosynthet-5
ically active radiation (PAR) and in vivo fluorescence profiles. Turbidity (in Formazin Turbidity Units, FTU) was also measured with a Seapoint turbidity meter attached to the CTD package.
2.1 Nutrients and dissolved organic carbon
Inorganic nutrients were measured using standard fluorometric and spectrophotomet-10
ric techniques after filtration (Whatman GF/F). Dissolved organic carbon (DOC) anal-yses were performed on filtered (Whatman GF/F) samples, collected in 40 mL pre-combusted (450◦C, overnight) glass tubes, sealed with a Teflon lined cap, after preser-vation with 36 µL 85% phosphoric acid (H3PO4). DOC concentration was measured on
a Shimadzu TOC VCPH analyzer, using potassium phthalate calibration standards over 15
the measurement range (0 to 450 µmol C L−1). Certified reference materials (Hansell Laboratory, University of Miami) were used to assess the performance of the instru-ment on and between measureinstru-ment days. The machine blank was between 3 and 5 µmol C L−1 for the measurement days and the coefficient of variation (CV) of the measurement was always less than 2% of the mean of triplicate injections of duplicate 20
samples.
2.2 Phytoplankton and bacterial abundance and activity
Chlorophyll-a (Chl-a) was measured on samples collected on GF/F filters using the method of Holm-Hansen et al. (1965). Phytoplankton samples were collected with a 20 µm plankton net or a 5 L Niskin bottle, following the methods described by Sournia 25
BGD
8, 487–525, 2011Phytoplankton diversity in a tropical
estuary
E. J. Rochelle-Newall et al.
Title Page
Abstract Introduction
Conclusions References
Tables Figures
◭ ◮
◭ ◮
Back Close
Full Screen / Esc
Printer-friendly Version Interactive Discussion
Discussion
P
a
per
|
Dis
cussion
P
a
per
|
Discussion
P
a
per
|
Discussio
n
P
a
per
|
and stored in the dark until return to the laboratory. Phytoplankton community compo-sition was determined by epifluorescence microscopy (Olympus BX51) and a digital camera (Olympus DP12). Cell density was determined using an inverted microscope (Leica DMIL) and a Sedgewick Rafter Chamber. Phytoplankton were identified using standard references (Balech, 1995; Fukuyo et al., 1990; Taylor, 1976; Tomas, 1997; 5
Truong, 1993; Yamagishi, 1992).
Subsamples for nano- and picophytoplankton, cyanobacteria and total bacterial abundance were fixed with buffered formalin (2% v/v) and stored immediately in liquid nitrogen until analysis by flow cytometry. Nano- (20 µm) and picophytoplankton (<2 µm) cells were detected and counted as described previously (Troussellier et al., 1993; 10
Crosbie et al., 2003; Campbell et al., 1994) using a FACSCalibur flow cytometer (Bec-ton Dickinson, San Jose, CA) with an air-cooled argon laser (488 nm, 15 mW). Cells excited at 488 nm were detected and counted using their right-angle light scattering (RALS) properties and their orange (585 nm filter) and red (465 nm filter) fluorescence from phycoerythrin and chlorophyll pigments, respectively. For each analysis, fluores-15
cent beads (1, 2, 6, 10, 20 µm, Polysciences Inc., Warrington, PA) were systematically added to each sample to standardize the flow cytometer settings. Cell abundances were estimated by adding a known volume of fluorescent beads (True-Counts, Becton Dickinson) with known concentration.
Bacterial abundance was determined after staining with SYBR-Green I (Molecular 20
Probes, OR, USA) as described by Marie et al. (1997) and sonication during 10 mn (Ultrasonik 300 Ney). The stained bacterial cells, excited at 488 nm, were enumer-ated using right-angle light scatter (RALS) and green fluorescence (FL1) at 530 nm. Fluorescent beads (0.96 µm and 2 µm, Polysciences Inc., Warrington, PA, USA) were added to each sample as an external standard. True count beads (Becton Dickinson, 25
San Jose, Ca) were added to determine the volume analyzed.
Primary production (Dissolved Primary Production, DPP and Particulate Primary Production, PPP) was measured using NaH14CO3 following the method of
BGD
8, 487–525, 2011Phytoplankton diversity in a tropical
estuary
E. J. Rochelle-Newall et al.
Title Page
Abstract Introduction
Conclusions References
Tables Figures
◭ ◮
◭ ◮
Back Close
Full Screen / Esc
Printer-friendly Version Interactive Discussion
Discussion
P
a
per
|
Dis
cussion
P
a
per
|
Discussion
P
a
per
|
Discussio
n
P
a
per
|
NaH14CO3 (Perkin-Elmer) and incubated in a semi-continuous flowing seawater bath
under neutral density screening (50, 25, 12.5, 6% incident sunlight). After 4 h of in-cubation, samples were carefully filtered at low vacuum pressure onto 0.4 µm polycar-bonate filters (Whatman Cyclopore). After acidification and drying of the filters, 5 mL of scintillation cocktail (Ultima Gold, Packard Instruments) was added. The amount of14C 5
incorporated into the particulate phase (PPP) was calculated using an inorganic carbon concentration of 25 700 µg C L−1 (Mara ˜n ´on et al., 2004). For the DPP measurement, duplicate 5 mL of filtrate were collected, acidified with 100 µL of 5 mol L−1HCl and left for 24 h on a horizontal agitator table. After agitation, 15 mL of scintillation cocktail (Ultima Gold XR, Packard Instruments) was added and the samples counted using 10
a Beckman Coulter LS 6500 Multi Purpose scintillation counter. For the radioactivity measurements, we consider that in order for the production rate to be significant there should be a ratio of at least 3 between the sample and the dark blank. Total Primary Production (TPP) represents the sum of DPP and PPP. An estimation of depth inte-grated primary productivity was determined using the water column light penetration 15
values obtained from the PAR profiles of the CTD and calculated using the trapezoidal method.
Bacterial production (BP) was measured using 3H-leucine, following the method of Smith and Azam (1992) and following the protocol detailed in Rochelle-Newall et al. (2008a). The only differences were that we used 40 nM (final concentration) 20
high specific activity3H-leucine (Perkin Elmer) and the incubations were conducted in the dark and at in situ temperature. Leucine uptake was converted to carbon using the conversion factor 1.55 kg C mol−1leu (Kirchman, 2001).
2.3 Concentration of metallic species
Water samples were collected from the sub-surface by hand. In order to determine 25
BGD
8, 487–525, 2011Phytoplankton diversity in a tropical
estuary
E. J. Rochelle-Newall et al.
Title Page
Abstract Introduction
Conclusions References
Tables Figures
◭ ◮
◭ ◮
Back Close
Full Screen / Esc
Printer-friendly Version Interactive Discussion
Discussion
P
a
per
|
Dis
cussion
P
a
per
|
Discussion
P
a
per
|
Discussio
n
P
a
per
|
Millipore, Bedford, MA, USA). Water samples were acidified (0.1% HCl w/v, Traceselect grade, Sigma Aldrich) and stored in pre-cleaned Teflon PFA bottles (Nalgene) at 4◦C until analysis. Each filter was rinsed with ultrapure water and immediately stored at
−20◦C until analysis. Daily filtration blanks were also performed.
Dissolved and particulate speciation analysis was carried out as previously de-5
scribed in Monperrus et al. (2005), Rodr´ıguez-Gonz ´alez et al. (2005) and Mart´ı n-Doimeadios et al. (2003), using gas chromatography-inductively coupled plasma-mass spectrometry (GC-ICP-MS, Thermo Fisher) combined with isotope dilution, obtaining precise and accurate data at low concentration levels present in the samples.
2.4 Export of nutrients
10
The export of carbon and nutrients (organic and inorganic) was determined using the flow volumes of the respective tributaries and the average low tide nutrient concen-trations in the river. River discharge was determined from cross-sections of velocity profiles that were measured nine times per tidal cycle using an Acoustic D ¨oppler Cur-rentmeter Profiler RDI Workhouse 1200 kHz (Vu et al., 2011). The tide is diurnal in this 15
area. All of the samples for phytoplankton diversity and productivity within Haiphong Bay were collected during the neap tide, when the tidal range was a few tens of cen-timetres as compared to 4 m at spring tide. This sampling method was chosen to minimise the impact of the tidal regime on the spatial distribution of biological parame-ters.
20
2.5 Statistical analyses
In order to estimate the similarity between two phytoplankton communities, the Whit-taker similarity index (W) was calculated using the following equation.
W =1−
n
X
i=1 |a
i1−ai2| 2
BGD
8, 487–525, 2011Phytoplankton diversity in a tropical
estuary
E. J. Rochelle-Newall et al.
Title Page
Abstract Introduction
Conclusions References
Tables Figures
◭ ◮
◭ ◮
Back Close
Full Screen / Esc
Printer-friendly Version Interactive Discussion
Discussion
P
a
per
|
Dis
cussion
P
a
per
|
Discussion
P
a
per
|
Discussio
n
P
a
per
|
wherea1 and a2 are relative abundance in sample 1 and 2, respectively. Since this index takes into account relative abundances, it provides a better estimate of the sim-ilarity between two communities (Hewson and Fuhrman, 2006). Spatial variation of phytoplankton community structure was assessed by Correspondence Analysis (CA). The extent of the correlation of diversity with environmental factors was assessed by 5
Canonical Correspondence Analysis (CCA) according to the procedure described by Fourc¸ans et al. (2006). CA and CCA were performed with MVSP v3.12d software (Kovach Computing Service, Anglesey Wales). Relative abundances of phytoplank-ton species were transformed with arcsin (x0.5) according to Legendre and Legendre (1998) to normalize the distribution of the data as it is a condition required before ap-10
plying multivariate statistical analysis (Dollhopf et al., 2001).
3 Results
3.1 Physics and meteorology
The meteorology and physical conditions of the two sample periods differed consid-erably (Table 1, Fig. 2). In July, temperatures were higher (28.5–31.1◦C and 18.5– 15
23.1◦C, for July and March, respectively) and river discharge was higher, reflecting the higher precipitation rates observed during the wet season (Table 1). For example, at Station 4, river outflow was 988 m3s−1 in July as compared to 175 m3s−1 in the dry season (March) (Vu et al., 2011). As a consequence of this higher discharge, surface salinity was lower and turbidity was an order of magnitude higher during July (Table 1). 20
Reflecting the higher riverine inputs, clear gradients of salinity and nutrients were ob-served along the estuarine gradient during the wet season. In contrast, during the dry season (March), when river flow was lower, salinity and nutrients were relatively homogenous along the estuary.
The large physical dispersion of the stations meant that a large range of salinities was 25
BGD
8, 487–525, 2011Phytoplankton diversity in a tropical
estuary
E. J. Rochelle-Newall et al.
Title Page
Abstract Introduction
Conclusions References
Tables Figures
◭ ◮
◭ ◮
Back Close
Full Screen / Esc
Printer-friendly Version Interactive Discussion
Discussion
P
a
per
|
Dis
cussion
P
a
per
|
Discussion
P
a
per
|
Discussio
n
P
a
per
|
general, the highest salinities were observed at Stn. 28 and the lowest were observed in Stns. 4 and 10. However, there was a difference of over 11 salinity units at Stn. 4, the river station between the two seasons (0.11 and 11.3 for the wet and dry seasons, respectively).
3.2 Nutrient measurements
5
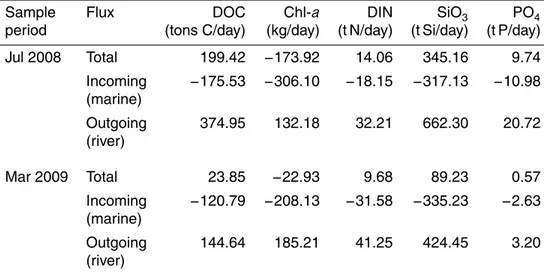
The concentrations of DIN, DIP, DOC, SiO4and Chl-awere all significantly higher
dur-ing July than March (t-test, p <0.05). Positive net seaward flows of nutrients and DOC and a general trend of decreasing nutrients with increasing salinity was observed for both sample periods, indicating their freshwater origin. In contrast to the nutrient fluxes, Chl a flux was negative, indicating a marine or estuarine, rather than freshwater, 10
source. This was the case for both sample periods, with the net flux almost a factor of 10 higher in July (−173.92) than in March (−22.93) at the confluence station (Table 2).
3.3 Metallic species concentrations (Hg, Butyl-Sn)
Concentrations of tin and mercury species varied between stations and season and fell within the range of concentrations observed in temperate estuaries. In general, 15
concentrations were higher during the wet season for both metals species. At Stn. 26, a mid-channel station (Fig. 1), there was a factor of 10 difference between the con-centrations of particulate tributyltin (TBTp) between July and March (0.59 ng L−1 as compared to 0.05 ng L−1, Table 3). The seasonal differences between mono- and di-butyl tin concentrations in the particulate phase at each station were generally much 20
less marked, with values being in the same range for both seasons at any given station. This was not the case for the dissolved fraction, where concentrations of up to a factor of ten higher of di-butyl tin (DBTd) were observed during the dry season as compared to the wet season. For example, at Stn. 26, concentrations of DBTd were 1.37 ng L−1 as compared to 10.05 ng L−1for July and March, respectively (Table 3).
BGD
8, 487–525, 2011Phytoplankton diversity in a tropical
estuary
E. J. Rochelle-Newall et al.
Title Page
Abstract Introduction
Conclusions References
Tables Figures
◭ ◮
◭ ◮
Back Close
Full Screen / Esc
Printer-friendly Version Interactive Discussion
Discussion
P
a
per
|
Dis
cussion
P
a
per
|
Discussion
P
a
per
|
Discussio
n
P
a
per
|
The concentrations of mercury species also varied between station and between season. There was a 3-fold increase in dissolved and particulate inorganic mercury concentrations in the wet season as compared to the dry season (Table 3). Conversely, methyl-mercury (MeHg) concentrations in the particulate phase were higher during the dry season. During the dry season the relationship between dissolved inorganic 5
mercury and salinity was less clear, with relatively high values found in the mid salinity regions and lower concentrations observed at lower and higher salinity stations. The observed distribution suggests that Hg and organotin species were directly transported seaward during the wet season, while, during the dry season, they undergo various biogeochemical transformations within the estuary (Navarro et al., 2011).
10
3.4 Phytoplankton abundance and diversity
Differences in phytoplankton biomass and diversity, as determined by microscopy were also evident between the two sampling periods (Table 1, Fig. 3), with Chl-a concentra-tions being higher during the wet season. In July, diatoms dominated at all staconcentra-tions, the only exceptions were Stns. 29 and 23 sampled on the 9 and 10 July, respectively. In all 15
the other cases, the diatom group represented between 43 to 99% of the phytoplank-ton community, with the dinoflagellates, chlorophytes and cyanobacteria making up the bulk of the rest of the community. In Stns. 29 and 23, dinoflagellates dominated the phytoplankton community (76 and 54%, respectively), with the diatom group being the second most dominant. In general, very few euglenophytes and silico-flagellates were 20
observed across the estuary. Little variation in terms of group dominance was observed along the salinity gradient during this season. The only exceptions were at the lowest salinity sites (<7.6 salinity), where relatively high abundances of chlorophytes and in the case of Stn. 15, dinoflagellates were observed. In contrast to the microphytoplank-ton, the abundance of cyanobacteria cells (<3 µm) as determined by flow cytometry, 25
BGD
8, 487–525, 2011Phytoplankton diversity in a tropical
estuary
E. J. Rochelle-Newall et al.
Title Page
Abstract Introduction
Conclusions References
Tables Figures
◭ ◮
◭ ◮
Back Close
Full Screen / Esc
Printer-friendly Version Interactive Discussion
Discussion
P
a
per
|
Dis
cussion
P
a
per
|
Discussion
P
a
per
|
Discussio
n
P
a
per
|
respectively). Pico- and nanophytoplankton abundances varied by less than one order of magnitude along the salinity gradient, with the highest abundances occurring in the offshore, higher salinity stations (Table 1).
During the dry season, and similar to the situation in July, diatoms dominated the community with abundances of over 65–99% of total. The only exceptions were 5
Stns. 30, 15 and 28, when the diatoms and the dinoflagellates represented almost equal parts of the community. During the dry season, very few phytoplankton cells from the other groups were found and there was little clear evidence of a distribu-tion varying along the salinity gradient. In sharp contrast to the situadistribu-tion during the wet season, there was little variability in cyanobacterial abundance along the salinity 10
gradient. There was at most a factor of four difference between Stn 4 and Stn. 28 (8.2×10³cell mL−1 and 56.8×10³cell mL−1, respectively, Table 1). This relative sta-bility was also reflected in the pico- and nanophytoplankton abundances, despite a fac-tor of 5 increase in picoplankton abundance relative to that of the wet season.
Despite the general dominance of the diatom group between the two seasons, the 15
actual phytoplankton species present differed considerably between the two sampling periods (Fig. 3). Indeed, the percentage similarities in diversity between July and March were very low and never exceeded 2% (Fig. 3; Table 1 Supplement). For example, the diatomsChaetoceros subtilis,Skeletonema costatum,Melosira granulata and M. granulata v. angustissimadominated in July. At the two stations (23 and 29) where 20
dinoflagellates dominated the community,Protoperidinium c.f. thorianumwas the dom-inant species in terms of abundance. In contrast, during the dry season,Thalassiosira spp. dominated the phytoplankton assemblage. At Stns. 15 and 30, Thalassiosira spp. remained the dominant diatom, however the community assemblage was also made up of the dinoflagellates Goniodoma polyedra, Certium trichoceros, and Pro-25
BGD
8, 487–525, 2011Phytoplankton diversity in a tropical
estuary
E. J. Rochelle-Newall et al.
Title Page
Abstract Introduction
Conclusions References
Tables Figures
◭ ◮
◭ ◮
Back Close
Full Screen / Esc
Printer-friendly Version Interactive Discussion
Discussion
P
a
per
|
Dis
cussion
P
a
per
|
Discussion
P
a
per
|
Discussio
n
P
a
per
|
3.5 Primary and bacterial production
The rates of depth integrated dissolved and particulate primary production (DPP and PPP, respectively) and bacterial total abundance and production varied between sea-son and showed some pronounced differences between stations (Table 1). Bacterial abundance and activity were higher during the wet season, with the highest abun-5
dances found at the offshore Stn. 28 and 30 concurrent with the highest Chl-a con-centrations. In general, BP tended to increase with increasing turbidity however the relationship was not significant (p >0.05). Indeed, the highest BP were found at the two “endmembers” of the estuary, Stn. 28 and Stn. 4 during this season. The ratio between BP and DPP, an indicator of the degree of coupling between the autotrophic 10
and heterotrophic processes, varied considerably and exceeded 1 in some stations. The highest values of BP:DPP (30.9 and 12.07) were observed at Stn. 4 and 10, re-spectively. These two stations are characterized by high turbidities, low salinities and relatively elevated DOC concentrations. At the other stations, the ratio between BP and DPP was lower, with most stations displaying BP:DPP ratios lower than 1. BP was 15
not significantly correlated with DPP (p >0.05; Fig. 4).
BA was lower and little variation was observed along the salinity gradient (Table 1) during March (dry season). Although BP exhibited the same general trend of increasing BP with increasing turbidity, the rates of bacterial production were lower than during the wet season. However, and in contrast to the wet season, during March BP was 20
correlated with DPP (r2=0.53,p <0.05; Fig. 4). Interestingly, and in contrast to the situation observed in July, the ratio between BP and DPP varied little over the salinity gradient with almost all values being lower than 1. The only exceptions were in higher salinity stations with ratios of 8.3 and 3.9 observed for Stns. 18 and 26, respectively.
In order to determine what factors were potentially controlling phytoplankton com-25
BGD
8, 487–525, 2011Phytoplankton diversity in a tropical
estuary
E. J. Rochelle-Newall et al.
Title Page
Abstract Introduction
Conclusions References
Tables Figures
◭ ◮
◭ ◮
Back Close
Full Screen / Esc
Printer-friendly Version Interactive Discussion
Discussion
P
a
per
|
Dis
cussion
P
a
per
|
Discussion
P
a
per
|
Discussio
n
P
a
per
|
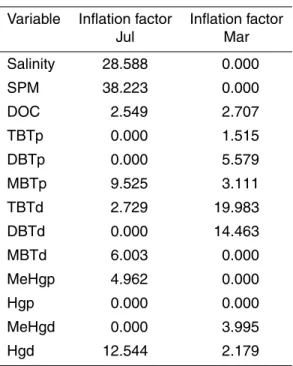
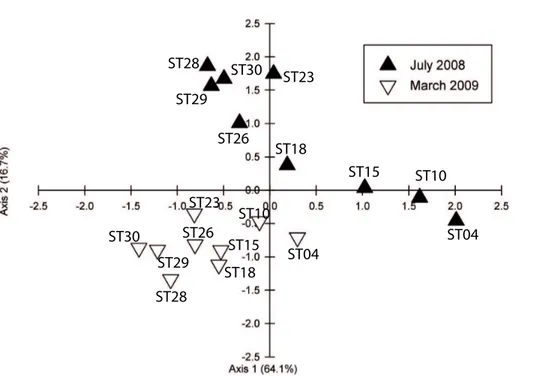
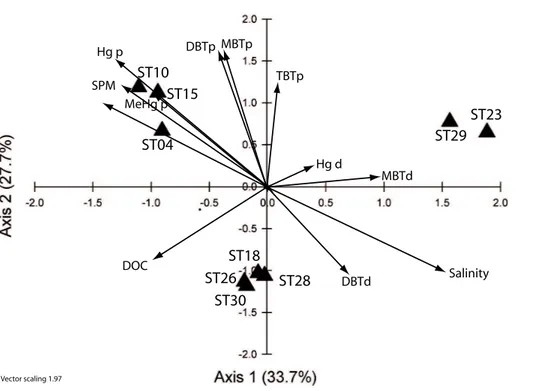
for July 2008 and March 2009, respectively. In each CCA, nutrients (inorganic and or-ganic) were excluded due to the strong correlation observed with salinity because of the dilution effect (Troussellier et al., 2002). During the wet season, the stations were separated into three groups (Fig. 5) reflecting the differences in community composi-tion (Fig. 3). The first group, comprising of the lower salinity stacomposi-tions (4, 10, and 15), 5
was grouped with the dissolved and particulate methylmercury species (MeHgd and p), and with particulate inorganic mercury (Hgp) although the real influence of the latter is difficult to assess since its inflation factor (IF) equals 0 (see Table 4). In contrast, at the other end of the salinity gradient, the stations 23 and 29 were related to the dissolved organic mercury (Hgd) and mono-butyl tin (MBTd). The third group, the mid salinity 10
stations (Stns. 18, 26, 28 and 30), were all closely grouped, reflecting their similar phy-toplankton community compositions (Fig. 3). These four stations were located along the first axis, in between DBTd and DOC. The inflation factors (Table 4) from the CCA show that during this season both salinity and SPM can be considered as structural factors; however their large IF values indicate redundancy with other environmental 15
variables. In addition, co-linearity between some of the butyltin group of species was also observed during the wet season.
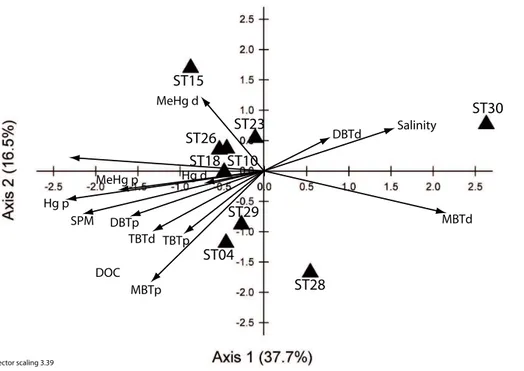
During the dry season the distribution of stations in the CCA was more widespread, with the stations grouped in the left quadrants. The only exceptions were the two high salinity stations (Stn. 28, 30). The lower salinity stations, except for Stn. 4, were located 20
in the same quadrant together with the stations from the same transect (23 and 15) as well as those from Cat Ba Island (18 and 26). The community diversity of this group was positively structured by MeHgd and, to a less extent, by DOC. Particulate tri-, di, and mono-butyl species also exerted a positive structural effect on phytoplankton community structure at Stns. 4 and 29. Interestingly, both marine stations (28 and 30) 25
BGD
8, 487–525, 2011Phytoplankton diversity in a tropical
estuary
E. J. Rochelle-Newall et al.
Title Page
Abstract Introduction
Conclusions References
Tables Figures
◭ ◮
◭ ◮
Back Close
Full Screen / Esc
Printer-friendly Version Interactive Discussion
Discussion
P
a
per
|
Dis
cussion
P
a
per
|
Discussion
P
a
per
|
Discussio
n
P
a
per
|
Comparing the inflation factors for both periods (Table 4), the role of salinity in de-termining the distributions along the estuary during the wet season is clear, as is that of SPM. However, the large values observed indicate that these two factors are redun-dant when other variables taken into account in the analysis. During the dry season, despite the importance of riverine flow as a source of organic and inorganic matter 5
in this estuary, the exact role of SPM and salinity could not be assessed due to the co-linearity observed. The inflation factors also underline the shifting importance of the different metal species along the estuarine gradient. Interestingly, DOC concentration, a variable strongly influenced by riverine inputs had a relatively constant IF between the two sampling periods.
10
4 Discussion
The factors controlling biological distributions in aquatic systems are myriad and it is probable that no single factor is responsible. This is particularly important in estuarine and coastal systems where water of terrestrial origin mixes with marine water, lead-ing to complex gradients of inorganic and organic components. Despite this evident 15
complexity, estuaries are generally considered as being linear systems where organic and inorganic carbon and nutrients from the freshwater and marine endmembers mix in a defined manner, such as is found in the classical mixing diagrams (Officer, 1979; Officer and Lynch, 1981). This two point mixing model is appealing in its simplicity and has permitted the estimation of the role of physico-chemistry and biology in control-20
ling the distributions of various parameters along the salinity gradient by determining if the parameter examined exhibited conservative and non-conservative mixing. This has been particularly useful for understanding organic carbon production and removal, phy-toplankton biomass and diversity as well as other biological parameters (e.g., Rochelle-Newall and Fisher, 2002; Fisher et al., 1998). However, the use of mixing diagrams is 25
BGD
8, 487–525, 2011Phytoplankton diversity in a tropical
estuary
E. J. Rochelle-Newall et al.
Title Page
Abstract Introduction
Conclusions References
Tables Figures
◭ ◮
◭ ◮
Back Close
Full Screen / Esc
Printer-friendly Version Interactive Discussion
Discussion
P
a
per
|
Dis
cussion
P
a
per
|
Discussion
P
a
per
|
Discussio
n
P
a
per
|
that are found in deltaic regions, it is often difficult to accurately determine these two endmembers. This therefore presents a problem if we wish to understand how and why biological parameters vary over spatial distances, particularly in systems, such as this one, that are characterized by complex freshwater inputs and hydrology during the wet and the dry seasons (Vu et al., 2011). Using multivariate analyses (canonical 5
correspondence analysis) we tried to unravel some of the complex factors that control biological processes in a subtropical, estuarine ecosystem.
4.1 Phytoplankton diversity and activity
We observed large differences in phytoplankton distributions between wet and dry sons (Fig. 3) as determined by microscopy or by flow cytometry. During the wet sea-10
son large shifts in phytoplankton community structure between Stns. 4, 10 and 15 and Stn. 23 were observed, despite their being axially aligned. The large difference in salinity between the first two stations (<1 salinity units) and the later station (25 salinity units) probably explains the differences between the stations as salinity was determined to be one of the important factors controlling phytoplankton diversity during 15
this season. Salinity is a well known controlling factor of phytoplankton activity and diversity in estuarine systems (e.g., Fisher et al., 1988; Quinlan and Phlips, 2007). It is therefore not surprising that osmotic stress combined with dilution of nutrient rich riverine water by higher salinity, more oligotrophic marine water played some role in determining community structure. Indeed, as recently noted by Bettarel et al. (2011) in 20
the same estuary, viral diversity and life strategy also appear to vary along the salinity gradient following the distributions of their potential hosts.
Heavy metals are also known to have a negative impact on phytoplankton diver-sity (e.g., Paulsson et al., 2000; Singh and Rai, 1991). Tri-butyl tin can reduce the fluorescence yield of phytoplankton photosynthesis, probably through its action on 25
BGD
8, 487–525, 2011Phytoplankton diversity in a tropical
estuary
E. J. Rochelle-Newall et al.
Title Page
Abstract Introduction
Conclusions References
Tables Figures
◭ ◮
◭ ◮
Back Close
Full Screen / Esc
Printer-friendly Version Interactive Discussion
Discussion
P
a
per
|
Dis
cussion
P
a
per
|
Discussion
P
a
per
|
Discussio
n
P
a
per
|
2006). Through their action on photosynthetic pathways and hence on primary pro-duction, heavy metals can also negatively impact biogeochemical cycles even at the low concentrations of TBT similar to those found in the Bach Dang Estuary. Sidharthan et al. (2002) found significant reductions in growth rate of a marine microalgae Nan-nochloropsis oculataat concentrations of TBT as low as 0.0625 nM (ca. 7.5 ng L−1(as 5
Sn)), similar to the concentrations observed in this work. The impact of varying salinity and pH on the toxicity of butyltin species and their impacts on phytoplankton community diversity has not been widely tested, however the LC50’s of the species that have been tested in culture differ by over a factor of 50 (Sidharthan et al., 2002), pointing towards differences in tolerance to TBT. Similarly, Petersen and Gustavson (2000), working in 10
a Danish coastal system observed large differences in the tolerance of pico, nano- and microphytoplankton to TBT. Thus it is clear that TBT and its degradation products can induce shifts in phytoplankton community diversity and productivity in coastal systems. In the Bach Dang Estuary during the dry season, phytoplankton diversity of the lower salinity stations (4, 10, 15) was correlated with TBTd, DBTp and MBTp. MBT along 15
with DBT are the degradation products of TBT and considered less toxic than TBT to aquatic phytoplankton (Maguire et al., 1983), although some microorganisms may also exhibit significant sensitivity to DBT and MBT (Gadd, 2000; Lascourr `eges et al., 2000). Moreover, it is known that, at least in culture, that certain species of phytoplankton such asChlorella sp. can degrade TBT to DBT and MBT (StLouis et al., 1997; Tsang 20
et al., 1999) and this may well in part explain some of the relationships between the metallic species and phytoplankton community structure, particularly during the dry season where significant degradation of TBT may have been occurring.
The impact of mercury on phytoplankton diversity and production is less clear. Al-though, high concentrations of mercury species are considered to be toxic to aquatic 25
BGD
8, 487–525, 2011Phytoplankton diversity in a tropical
estuary
E. J. Rochelle-Newall et al.
Title Page
Abstract Introduction
Conclusions References
Tables Figures
◭ ◮
◭ ◮
Back Close
Full Screen / Esc
Printer-friendly Version Interactive Discussion
Discussion
P
a
per
|
Dis
cussion
P
a
per
|
Discussion
P
a
per
|
Discussio
n
P
a
per
|
in the San Francisco Bay Estuary, a site considered to be contaminated by mercury (Conaway et al., 2003). The relationships observed between the different mercury species and phytoplankton diversity may well be due more to the uptake capacity of the phytoplankton species and ambient DOC concentrations, rather than any negative im-pact of mercury on phytoplankton communities. Methyl mercury uptake in phytoplank-5
ton is known to vary with cell size, cell number and with DOC concentration (Pickhardt and Fisher, 2007). During the wet season, phytoplankton community diversity at the lower salinity stations where mercury concentrations were highest differed greatly from that of the other stations (Fig. 3). The presence of small cryptophytes and chlorophytes at these stations (Stns. 4, 10 and 15), with higher surface to volume ratios than that of 10
the diatom cells dominating at the other, more offshore stations seems to support this hypothesis. Indeed, these three stations were tightly related to particulate inorganic mercury and methyl mercury concentrations, potentially reflecting the “uptake”, either through biotic or abiotic processes, of Hg by these phytoplankton species. The com-munity composition of Stns. 15, 23 and 26 were also related. However, whether these 15
organo-metal species (Hg and Sn) play some role in structuring phytoplankton diversity at these stations or whether the organo-metals are directly influenced through their par-tition and transformation by the plankton community structure is difficult to determine with this dataset.
4.2 Phytoplankton-bacterioplankton coupling
20
Phytoplankton and bacterioplankton production varied between the two seasons and along the transects. At the lower salinity stations, BP greatly exceeded DPP during the wet season, indicating that the DOC fueling BP originated from other sources than the immediately adjacent phytoplankton production. Indeed, the relatively high parti-cle associated bacterial production rates (data not shown) point towards a particulate 25
BGD
8, 487–525, 2011Phytoplankton diversity in a tropical
estuary
E. J. Rochelle-Newall et al.
Title Page
Abstract Introduction
Conclusions References
Tables Figures
◭ ◮
◭ ◮
Back Close
Full Screen / Esc
Printer-friendly Version Interactive Discussion
Discussion
P
a
per
|
Dis
cussion
P
a
per
|
Discussion
P
a
per
|
Discussio
n
P
a
per
|
contrast, at the higher salinity, offshore stations during the wet season and at almost all of the stations during the dry season, the BP:DPP ratio was much lower (Fig. 4). This means that more DOC was being produced during primary production than was re-quired for bacterial biomass production, potentially leading to an accumulation of DOC in the water column. This may well explain the relatively high concentrations of DOC 5
observed in the higher salinity stations, further underlining the difficultly of using mixing diagrams to study distributions in this system.
There are many potential explanations as to why we observed accumulations of DOC in these sites. Low bioavailability of the freshly produced DOC (e.g., Renaud et al., 2005) or limitation of bacterial production by another parameter, such as nutrient 10
limitation (Thingstad et al., 1997) or heavy metal contamination (Fisher and Reinfelder, 1995) are a few of them. Given the relatively high nutrient concentrations observed, it is unlikely that inorganic nutrients were limiting bacterial production at this site. Heavy metals are known to induce shifts in the BP:TPP ratio (e.g., Rochelle-Newall et al., 2008a), however, it is unclear whether or not they played a role in altering the bioavail-15
ability of DOM to the bacterial communities present. It has already been shown that the chemical composition of the DOC released by different phytoplankton differs as a func-tion of the species or even strains present (Biersmith and Benner, 1998; Ozturk and Aslim, 2010) and that the DOM released during photosynthesis can vary in bioavail-ability to the bacterial communities present as a function of the growth stage (Renaud 20
et al., 2005). It is therefore probable that the chemical quality of the DOM released dur-ing photosynthesis by the communities present at the outer most stations was different from that released during photosynthesis at the other stations. Indeed, the commu-nity composition at the two stations with the lowest BP:DPP rates during the wet sea-son (Stns. 28 and 30) was characterized by very high abundances of cyanobacteria. 25
BGD
8, 487–525, 2011Phytoplankton diversity in a tropical
estuary
E. J. Rochelle-Newall et al.
Title Page
Abstract Introduction
Conclusions References
Tables Figures
◭ ◮
◭ ◮
Back Close
Full Screen / Esc
Printer-friendly Version Interactive Discussion
Discussion
P
a
per
|
Dis
cussion
P
a
per
|
Discussion
P
a
per
|
Discussio
n
P
a
per
|
Of course, overlain with the biological and chemical interactions, physical processes such as wind direction and water circulation also play an important role in determining particle distributions. Stations 29 and 23, sampled on the 9 and 10 July 2008 have very similar community distributions, despite their relative separation and their difference to the other surrounding stations (Fig. 3). During the sampling period, and typical of the 5
south monsoon during the wet season, the wind direction was from the south (180– 200◦) potentially confining the phytoplankton communities to the bay areas instead of their being dispersed into the higher salinity, off-shore waters as might be expected through water mixing. Furthermore, recent work on the water circulation during the tidal cycle in this area (Dinh and Ha, 2008) has shown that water out-flow during the tidal 10
cycle shifts between channels. During low tide, water exits from the Bach Dang River (Stns. 4, 10, 15, 23) and enters via the channel adjacent to Cat Ba (Stns. 18, 26, 29). This cycle is reversed during high tide with the corresponding lateral transport of the water masses between these two channels. In this estuary, the prevailing wind direction combined with tidal influence (here reduced because sampling was performed during 15
neap tides) may also explain the distribution of phytoplankton at these two stations.
5 Conclusions
Here we present some of the factors that potentially control phytoplankton distribution and phytoplankton-bacterioplankton coupling in a subtropical estuary. It is clear that in complex estuarine systems such as the Bach Dang Estuary, simple, endmember 20
calculations at best miss a large part of the processes and at worst, ignore poten-tially important factors. It is already known that heavy metals can play an important role in determining phytoplankton community structure in coastal ecosystems. Here we further highlight the importance of some ecotoxicologically targeted organometallic species (MeHg, Butyl-Sn), their potential role in a complex, tropical estuarine system 25
BGD
8, 487–525, 2011Phytoplankton diversity in a tropical
estuary
E. J. Rochelle-Newall et al.
Title Page
Abstract Introduction
Conclusions References
Tables Figures
◭ ◮
◭ ◮
Back Close
Full Screen / Esc
Printer-friendly Version Interactive Discussion
Discussion
P
a
per
|
Dis
cussion
P
a
per
|
Discussion
P
a
per
|
Discussio
n
P
a
per
|
given the almost ubiquitous presence of heavy metals in the industrialised coastal ecosystems, the impact of these ecotoxicologically important organometallic species on coastal carbon cycling needs to be taken into account more frequently.
Supplementary material related to this article is available online at:
http://www.biogeosciences-discuss.net/8/487/2011/bgd-8-487-2011-supplement.
5
pdf.
Acknowledgements. This work was financed by the EC2CO project “HAIPHONG”, and grants from the French IRD, CNRS, Groupement De Recherche (GDR) 2476 R ´eseaux Trophiques P ´elagiques, and the Vietnam Academy of Science and Technology (VAST). We thank Jean-Yves Panch ´e and Jean-Pierre Lefebvre for their help with the physical oceanography
measure-10
ments. This article is dedicated to the memory of Do Trong Binh who passed away during the project.
References
Balech, E.: The Genus Alexandrium Halim (Dinoflagellata), Sherkin Island Marine Station, Sherkin Island, Co. Cork, Ireland, 151 pp., 1995.
15
Bettarel, Y., Agis, M., Bouvier, C., Bouvier, T., Cao, T. T. T., Chu, V. T., Combe, M., Mari, X., Nguyen, T., Pham The, T., Pringault, O., Rochelle Newall, E. J., Torr ´eton, J.-P., and Tran, Q.: Viral layout in the tropical Bach Dang Estuary, Vietnam, Microb. Ecol., in review, 2011. Biersmith, A. and Benner, R.: Carbohydrates in phytoplankton and freshly produced dissolved
organic matter, Mar. Chem., 63, 131–144, 1998.
20
Borges, A. V.: Do we have enough pieces of the jigsaw to integrate CO2fluxes in the coastal ocean?, Estuaries, 28, 3–27, 2005.
Borges, A. V., Delille, B., and Frankignoulle, M.: Budgeting sinks and sources of CO2 in the coastal ocean: diversity of ecosystems counts, Geophys. Res. Lett., 32, L14601, 2005. Borges, A. V., Schiettecatte, L. S., Abril, G., Delille, B., and Gazeau, E.: Carbon dioxide in
25
BGD
8, 487–525, 2011Phytoplankton diversity in a tropical
estuary
E. J. Rochelle-Newall et al.
Title Page
Abstract Introduction
Conclusions References
Tables Figures
◭ ◮
◭ ◮
Back Close
Full Screen / Esc
Printer-friendly Version Interactive Discussion
Discussion
P
a
per
|
Dis
cussion
P
a
per
|
Discussion
P
a
per
|
Discussio
n
P
a
per
|
Bouvier, T. and del Giorgio, P. A.: Compositional changes in free-living bacterial communities along a salinity gradient in two temperate estuaries, Limnol. Oceanogr., 47, 453–470, 2002. Campbell, L., Nolla, H. A., and Vaulot, D.: The importance ofProchlorococcus to community
structure in the Central North Pacific Ocean, Limnol. Oceanogr., 39, 954–961, 1994. Conaway, C. H., Squire, S., Mason, R. P., and Flegal, A. R.: Mercury speciation in the San
5
Francisco Bay Estuary, Mar. Chem., 80, 199–225, 2003.
Crosbie, N. D., Teubner, K., and Weisse, T.: Flow-cytometric mapping provides novel insights into the seasonal and vertical distributions of freshwater autotrophic picoplankton, Aquat. Microb. Ecol., 33, 53–66, 2003.
Crump, B. C. and Baross, J. A.: Particle-attached bacteria and heterotrophic plankton
associ-10
ated with the Columbia River estuarine turbidity maxima, Mar. Ecol.-Prog. Ser., 138, 265– 273, 1996.
Crump, B. C., Baross, J. A., and Simenstad, C. A.: Dominance of particle-attached bacteria in the Columbia River Estuary, USA, Aquat. Microb. Ecol., 14, 7–18, 1998.
Dinh, V. U. and Ha, T. H.: Model for water circulation in tidal dominated estuarine regions,
15
J. Wat. Res. Environ. Eng., N23, 33–38, 2008.
Dollhopf, S. L., Hashsham, S. A., and Tiedje, J. M.: Interpreting 16S rDNA T-RFLP data: ap-plication of self-organizing maps and principal component analysis to describe community dynamics and convergence, Microb. Ecol., 42, 495–505, 2001.
Downs, S. G., Macleod, C. L., and Lester, J. N.: Mercury in precipitation and its relation to
20
bioaccumulation in fish: a literature review, Water. Air Soil Poll., 108, 149–187, 1998. Duarte, A., Rodrigues, S., Pato, P., Coelho, P., and Pereira, M. E.: A review on studies of
mercury contamination in the coastal lagoon Ria de Aveiro, Portugal, Houille Blanche, 4, 35–39, 2007.
Ferguson, A., Eyre, B., and Gay, J.: Nutrient cycling in the sub-tropical Brunswick Estuary,
25
Australia, Estuaries, 27, 1–17, 2004.
Fisher, N. S. and Reinfelder, J. R.: The trophic transfer of metals in marine systems, in: Metal Speciation and Bioavailability in Aquatic Systems, edited by: Tessier, A. and Turner, D. R., John Wiley, Chichester, 363–406, 1995.
Fisher, N. S., Bohe, M., and Teyssie, J. L.: Accumulation and toxicity of Cd, Zn, Ag, and Hg in
30
4 marine phytoplankters, Mar. Ecol.-Prog. Ser., 18, 201–213, 1984.
BGD
8, 487–525, 2011Phytoplankton diversity in a tropical
estuary
E. J. Rochelle-Newall et al.
Title Page
Abstract Introduction
Conclusions References
Tables Figures
◭ ◮
◭ ◮
Back Close
Full Screen / Esc
Printer-friendly Version Interactive Discussion
Discussion
P
a
per
|
Dis
cussion
P
a
per
|
Discussion
P
a
per
|
Discussio
n
P
a
per
|
61–93, 1988.
Fisher, T. R., Hagy, J. D., and Rochelle-Newall, E.: Dissolved and particulate organic carbon in Chesapeake Bay, Estuaries, 21, 215–229, 1998.
Fourc¸ans, A., Sole, A., Diestra, E., Ranchou-Peyruse, A., Esteve, I., Caumette, P., and Du-ran, R.: Vertical migration of phototrophic bacterial populations in a hypersaline microbial
5
mat from Salins-de-Giraud (Camargue, France), FEMS Microbiol. Ecol., 57, 367–377, 2006. Fukuyo, Y., Takano, H., Chihara, M., and Matsuoka, K.: Red Tide Organisms in Japan – an
Illustrated Taxonomic Guide, Uchida Rokakuho, Tokyo, Japan, 407 pp., 1990.
Gadd, G. M.: Microbial interactions with tributyltin compounds: detoxification, accumulation, and environmental fate, Sci. Total Environ., 258, 119–127, 2000.
10
del Giorgio, P. A. and Bouvier, T. C.: Linking the physiologic and phylogenetic successions in free-living bacterial communities along an estuarine salinity gradient, Limnol. Oceanogr., 47, 471–486, 2002.
Halpern, B. S., Walbridge, S., Selkoe, K. A., Kappel, C. V., Micheli, F., D’Agrosa, C., Bruno, J. F., Casey, K. S., Ebert, C., Fox, H. E., Fujita, R., Heinemann, D., Lenihan, H. S., Madin, E. M. P.,
15
Perry, M. T., Selig, E. R., Spalding, M., Steneck, R., and Watson, R.: A global map of human impact on marine ecosystems, Science, 319, 948–952, doi:10.1126/science.1149345, 2008. Hewson, I. and Fuhrman, J. A.: Improved strategy for comparing microbial assemblage
finger-prints, Microb. Ecol., 51, 147–153, 2006.
Holm-Hansen, O., Lorenzen, C. J., Holmes, R. W., and Strickland, J. D. H.: Fluorimetric
de-20
termination of chlorophyll, Rapports et proc `es-verbaux des r ´eunions, Conseil international pour l’exploration de la mer, J. Cons. int. Explor. Mer, 30, 3–15, doi:10.1093/icesjms/30.1.3, 1965.
Jacquet, S., Delesalle, B., Torr ´eton, J. P., and Blanchot, J.: Response of phytoplankton com-munities to increased anthropogenic influences (southwestern lagoon, New Caledonia), Mar.
25
Ecol.-Prog. Ser., 320, 65–78, 2006.
Kirchman, D.: Measuring bacterial biomass production and growth rates from leucine incorpo-ration in natural aquatic environments, Method. Microbiol., 30, 227–237, 2001.
Lascourr `eges, J. F., Caumette, P., and Donard, O. F. X.: Toxicity of butyltin, phenyltin and inorganic tin compounds to sulfate-reducing bacteria isolated from anoxic marine sediments,
30
Appl. Organomet. Chem., 14, 98–107, 2000.
BGD
8, 487–525, 2011Phytoplankton diversity in a tropical
estuary
E. J. Rochelle-Newall et al.
Title Page
Abstract Introduction
Conclusions References
Tables Figures
◭ ◮
◭ ◮
Back Close
Full Screen / Esc
Printer-friendly Version Interactive Discussion
Discussion
P
a
per
|
Dis
cussion
P
a
per
|
Discussion
P
a
per
|
Discussio
n
P
a
per
|
in nine European estuaries and implications for an estuarine typology, Biogeochemistry, 59, 5–23, 2002.
Maguire, R. J., Carey, J. H., and Hale, E. J.: Degradation of the tri-n-butyltin species in water, J. Agr. Food Chem., 31, 1060–1065, 1983.
Mara ˜n ´on, E., Cerme ˜no, P., Fern ´andez, E., Rodr´ıguez, J., and Zabala, L.: Significance and
5
mechanisms of photosynthetic production of dissolved organic carbon in a coastal eutrophic ecosystem, Limnol. Oceanogr., 49, 1652–1666, 2004.
Marie, D., Partensky, F., Jacquet, S., and Vaulot, D.: Enumeration and cell cycle analysis of natural populations of marine picoplankton by flow cytometry using the nucleic acid stain SYBR Green I, Appl. Environ. Microbiol., 63, 186–193, 1997.
10
Martin-Doimeadios, R. C. R., Monperrus, M., Krupp, E., Amouroux, D., and Donard, O. F. X.: Using speciated isotope dilution with GC-inductively coupled plasma MS to determine and unravel the artificial formation of monomethylmercury in certified reference sediments, Anal. Chem., 75, 3202–3211, 2003.
Monperrus, M., Tessier, E., Veschambre, S., Amouroux, D., and Donard, O.: Simultaneous
15
speciation of mercury and butyltin compounds in natural waters and snow by propylation and species-specific isotope dilution mass spectrometry analysis, Anal. Bioanal. Chem., 381, 854–862, 2005.
Muylaert, K., Sabbe, K., and Vyverman, W.: Changes in phytoplankton diversity and community composition along the salinity gradient of the Schelde Estuary (Belgium/The Netherlands),
20
Estuar. Coast. Shelf. S., 82, 335–340, 2009.
Nausch, M.: Microbial activities onTrichodesmiumcolonies, Mar. Ecol.-Prog. Ser., 141, 173– 181, 1996.
Navarro, P., Thanh, N. D., Rochelle-Newall, E. J., Ouillon, S., Torr ´eton, J. P., and Amouroux, D.: Mercury and butyltin species distribution and tidal transport in Bach Dang Estuary (Haiphong,
25
Vietnam), Mar. Pollut. Bull., in preparation, 2011.
Nhan, D. D., Loan, D. T., Tolosa, I., and de Mora, S. J.: Occurrence of butyltin compounds in marine sediments and bivalves from three harbour areas (Saigon, Da Nang and Hai Phong) in Vietnam, Appl. Organomet. Chem., 19, 811–818, 2005.
Officer, C. B.: Discussion of the behaviour of nonconservative dissolved constituents in
estuar-30
ies, Estuar. Coast. Shelf. S., 9, 91–94, 1979.
BGD
8, 487–525, 2011Phytoplankton diversity in a tropical
estuary
E. J. Rochelle-Newall et al.
Title Page
Abstract Introduction
Conclusions References
Tables Figures
◭ ◮
◭ ◮
Back Close
Full Screen / Esc
Printer-friendly Version Interactive Discussion
Discussion
P
a
per
|
Dis
cussion
P
a
per
|
Discussion
P
a
per
|
Discussio
n
P
a
per
|
Oliveira, R. D. and Santelli, R. E.: Occurrence and chemical speciation analysis of organotin compounds in the environment: a review, Talanta, 82, 9–24, 2010.
Ozturk, S. and Aslim, B.: Modification of exopolysaccharide composition and production by three cyanobacterial isolates under salt stress, Environ. Sci. Pollut. R., 17, 595–602, 2010. Paulsson, M., Nystrom, B., and Blanck, H.: Long-term toxicity of zinc to bacteria and algae in
5
periphyton communities from the river Gota Alv, based on a microcosm study, Aquat. Toxicol., 47, 243–257, 2000.
Peters, E. C., Gassman, N. J., Firman, J. C., Richmond, R. H., and Power, E. A.: Ecotoxicology of tropical marine ecosystems, Environ. Toxicol. Chem., 16, 12–40, 1997.
Petersen, S. and Gustavson, K.: Direct toxic effects of TBT on natural enclosed phytoplankton
10
at ambient TBT concentrations of coastal waters, Ecotoxicology, 9, 273–285, 2000.
Pickhardt, P. C. and Fisher, N. S.: Accumulation of inorganic and methylmercury by freshwater phytoplankton in two contrasting water bodies, Environ. Sci. Technol., 41, 125–131, 2007. Quinlan, E. L. and Phlips, E. J.: Phytoplankton assemblages across the marine to
low-salinity transition zone in a blackwater dominated estuary, J. Plankton. Res., 29, 401–416,
15
doi:10.1093/plankt/fbm024, 2007.
Raymond, P. A. and Bauer, J. E.: Bacterial consumption of DOC during transport through a temperate estuary, Aquat. Microb. Ecol., 22, 1–12, 2000.
Renaud, F., Pringault, O., and Rochelle-Newall, E.: Effects of the colonial cyanobacterium
Trichodesmium spp.on bacterial activity, Aquat. Microb. Ecol., 41, 261–270, 2005.
20
Rochelle-Newall, E. J. and Fisher, T. R.: Chromophoric dissolved organic matter and dissolved organic carbon in Chesapeake Bay, Mar. Chem., 77, 23–41, 2002.
Rochelle-Newall, E. J., Winter, C., Barron, C., Borges, A. V., Duarte, C. M., Elliott, M., Frankig-noulle, M., Gazeau, F., Middelburg, J. J., Pizay, M. D., and Gattuso, J.-P.: Artificial neural network analysis of factors controling ecosystem metabolism in coastal systems, Ecol. Appl.,
25
17, S185-S196, 2007.
Rochelle-Newall, E. J., Delesalle, B., Mari, X., Rouchon, C., Torr ´eton, J. P., and Pringault, O.: Zinc induces shifts in microbial carbon flux in tropical coastal environments, Aquat. Microb. Ecol., 52, 57–68, 2008a.
Rochelle-Newall, E. J., Torr ´eton, J. P., Mari, X., and Pringault, O.:
Phytoplankton-30
bacterioplankton coupling in a subtropical South Pacific coral reef lagoon, Aquat. Microb. Ecol., 50, 221–229, 2008b.