Physical, chemical and microbiological aspects
during the dry and rainy seasons in a pond covered
by macrophyte used in aquaculture water supply
Aspectos físico-químicos e microbiológicos nas estações de seca e chuva em viveiro
coberto por macrófitas usado no abastecimento de água para aquicultura
Samuel Generoso Dias1 and Lúcia Helena Sipaúba-Tavares2
1Laboratório de Limnologia e Produção de Plâncton, Programa de Pós-graduação em Microbiologia
Agropecuária, Centro de Aquicultura, Universidade Estadual Paulista – UNESP, CEP 14884-900, Jaboticabal, SP, Brazil
e-mail: samueldias@hotmail.com.br
2Laboratório de Limnologia e Produção de Plâncton, Centro de Aquicultura,
Universidade Estadual Paulista – UNESP, CEP 14884-900, Jaboticabal, SP, Brazil e-mail: sipauba@caunesp.unesp.br
Abstract: Aim: The water quality of a pond covered by macrophytes and used as a
water supply for aquaculture was evaluated during the dry and rainy seasons; Methods: Six
points were established for water sampling, at water inflow and outflow. Samplings were
carried out monthly between June 2008 and May 2009; Results: Inflow points P1, P2
and P3 in the pond had higher nutrient concentrations and high trophic rates. Moreover,
capybaras in the area caused sediment suspension and an increase in fecal coliforms. There was significant difference (p < 0.05) in the concentrations of nutrients in water between the dry and rainy seasons. The outflow of water caused by rain carried the material around
the pond directly into the water; Conclusions: The system studied was influenced by rain
and lack of adequate management of the surrounding area. Water quality was deteriorated by increase in nutrient concentrations, fecal coliforms and reduction of dissolved oxygen in the water during the rainy season. This was due to allochthonous material from the area surrounding the pond that affected negatively the supply system.
Keywords: water quality, fecal coliforms, rainfall, trophic state, aquaculture.
Resumo: Objetivo: O objetivo deste estudo foi avaliar durante as estações seca e estação chuvosa a qualidade da água de um viveiro, coberto por macrófitas, utilizado
como sistema de abastecimento de água para aquicultura; Métodos: Foram estabelecidos
6 pontos para a coleta das amostras de água na superfície do viveiro, envolvendo entradas e saídas da água. As coletas foram realizadas mensalmente entre junho de 2008 e maio de
2009; Resultados: Os pontos P1, P2 e P3 devido à entrada de água no viveiro apresentaram
maiores concentrações de nutrientes com elevado estado trófico e, a entrada de capivaras nestes locais promoveu a suspensão do sedimento e aumento de coliformes fecais. Há significativas diferenças (p < 0,05) nas concentrações de nutrientes na água entre seca e chuva, com o escoamento de água gerado pela precipitação carreando material do
entorno do viveiro para a água; Conclusões: O sistema estudado sofre influência direta
da precipitação e da ausência de manejo adequado da área do entorno. Durante a estação chuvosa a qualidade da água ficou comprometida com aumento da concentração de nutrientes, coliformes fecais e redução do oxigênio dissolvido na água, devido ao material alóctone proveniente da área ao redor do viveiro, afetando negativamente o sistema de abastecimento.
a system for the breeding of aquatic organisms. It also determines the effect of the plants on the water quality by comparing water inflow and outflow. Further, it investigates whether the pond may adequately supply water to aquaculture ponds during the dry and rainy seasons.
2. Methods
2.1. Study area and sampling period
Current research was conducted in a pond at the Aquaculture Farm (21° 15’ S and 48° 18’ W), with continuous flow of water, 3,800 m2 area and an approximately 14-day residence time (Sipaúba-Tavares et al., 1991).
The pond receives water directly from several sources and is practically covered with macrophytes, mainly Salvinia auriculata Aublet and Eichhornia azurea (Sw.) Kunth. The pond had already been used for fish breeding, although some years ago it became a water reservoir to supply the breeding system of water organisms of the Aquaculture Farm. Some fish species, such as Oreochromis niloticus (tilapia) and Astyanax sp. (lambari), are still extant in the pond and survive by feeding on its aquatic biota (Sipaúba-Tavares, 2006).
Water samples were collected at the surface (0.10 m depth) at six points: P1 = close to the water sources (water inflow from the source and from runoff water); P2-P3 = pond sides and inflow points of runoff water during the rainy season; P4 = the deepest and most central point in the pond; P5-P6 = outflow. Points P1, P2 and P3 are also the inflow points of the capybaras (Hidrochoerus hidrochoeris, Linnaeus, 1766) in the supply pond (Figure 1). The climate, according to Köpen’s classification is Cwc (Peel et al., 2007), subtropical, relatively dry during the winter (June to September) and rainy in the summer (December to March), with mean yearly temperature of 22 °C, rainfall 1,424.6 mm and mean altitude 605 m.
2.2. Physical, chemical and microbiological parameters
Samples for abiotic parameters and Escherichia coli were undertaken monthly between June 2008 and March 2009. Temperature, electrical conductivity and pH were measured by multi-probe HORIBA U-10 water quality check and dissolved oxygen was determined by oxygen meter YSI-55. Nitrite, nitrate, orthophosphate, total phosphorus and ammonia were determined
1. Introduction
Limnological studies are important to understand aquatic environments foregrounding the adequate use of water. They provide knowledge that would produce technologies for water management and guarantee water supply in adequate conditions for aquaculture. Since water resources have significant ecological, economical and social importance, the quality of aquatic ecosystems affects society as a whole (Calijuri et al., 2008).
The protection of water bodies involves three basic aspects: protection of water sources, water treatment and the maintenance of the integrity of the water environments (Plummer and Long, 2007). The main water sources for the maintenance of aquaculture tanks and ponds should not be negatively affected by floods from the surrounding areas (Sipaúba-Tavares et al., 2007).
Cattle-raising activities in areas close to aquaculture systems affect water quality and modify the quantity of nutrients in the water and sediments. They actually indicate the need for riparian vegetation that would effectively protect the environment against runoff water from agricultural areas and pastureland (Meador and Goldstein, 2003). Rainfall and surface water discharge also contribute towards the accumulation of allochthonous material since they carry away substances around the basin and cause changes in the water quality of the receiving water bodies (Neill et al., 2004).
Environments which receive water inflow from agricultural areas have high nutrient levels, high chlorophyll-a rates and great amount of suspended particles (Silva and Sacomani, 2001; Brainwood and Maheshwari, 2004). Eutrophication of water bodies is frequently the outcome of nutrient accumulations from soil (Taguchi and Nakata, 2009) and in spite of great progress in naturalizing the phenomenon, the reversion of the process is still a challenge. The best strategy lies in conservation rather than in the restoration of the environment (Suding et al., 2004).
Certain inconveniences in the case of aquatic plants comprise excessive growth and natural death with a consequent rise in nutrient rates by decomposition. However, proper management provides filtration, absorption and biodegradation and contributes towards an improvement of water quality in eutrophicating environments (Ruggiero et al., 2003; Joniak et al., 2007; Lishawa et al., 2010).
was used to monitoring the trophic level. TSI is the mean obtained from the sum of chlorophyll-a trophic state index (CTSI) and phosphorus trophic state index (PTSI).
2.4. Statistical analysis
The non-parametric Mann-Whitney test (U test) compared physical and chemical parameters and coliform with climatic seasons (dry and rainy season) and points (inflow and outflow). Kruskal-Wallis test was employed to compare sampling points in each season (Siegel, 1975). Results were evaluated by data multivaried analysis. Principal Components Analysis (PCA) was used to reduce the dimensionality of the limnological variables in relation to sampling points (Manly, 1986). Points were grouped by cluster analyses during the dry and rainy seasons to obtain similarity among the six points (Zar, 1999). Co-variance matrix was employed and data were transformed by range according to Golterman et al. (1978) and Koroleff
(1983). Chlorophyll-a was evaluated according to Nusch (1980) and 5-day biochemical oxygen demand and suspended solids were determined according to Boyd and Tucker (1992). Soil analysis was undertaken for phosphorus and organic matter (OM) according to methods described by Andersen (1976), while results of fecal coliforms and Escherichia coli were obtained by multiple tube fermentation procedure as MPN/100 mL index, according to Greenberg et al. (1992). Water transparency was estimated with a Secchi disk and data on rainfall rates (monthly means) were supplied by the Aquiculture Climatology Station of the Universidade Estadual Paulista in Jaboticabal SP Brazil.
2.3. Trophic State Index
Trophic State Index (TSI), developed by Carlson, with modifications by Toledo Junior et al. (1983),
emphasized that the constant entry of capybaras (Hydrochoerus hydrochaeris) at this point increased the ions in the water because of sediment suspension.
Owing to local climatic conditions, water temperature and mean monthly rainfall were higher during the rainy season and scored a significant difference (p < 0.05) between the dry and rainy seasons (Z3) (Table 1).
Inflow points (P1, P2 and P3) differed significantly (p < 0.05) from the others during the dry season (Z1), with higher rates in nitrate, fecal coliforms, E. coli, chlorophyll-a, BOD5, TDS and TSS (Table 1).
There was a significant difference (p < 0.05) during the rainy season between the inflow (P1, P2 and P3) and outflow (P5 and P6) points (Z2) for conductivity, nitrate, total phosphorus, orthophosphate, E. coli, total coliforms, BOD5, TDS and TSS (Table 1), with higher concentrations at the inflow points.
There were significant differences (p < 0.05) in temperature, dissolved oxygen, pH, nitrate, nitrite, total phosphorus and orthophosphate during the dry and rainy seasons (U3) (Table 1). Temperature, pH, concentration of nitrate, nitrite, total phosphorus and orthophosphate water were higher during the rainy season, whereas dissolved oxygen concentration was higher during the dry one (p < 0.05) (Table 1).
Significant differences (p < 0.05) occurred in nitrate concentrations between P1 and P5 during the dry season, with mean concentrations 806.7 µg.L–1 and 582.9 µg.L–1 respectively, and between P
3 and P5 during the rainy season, with mean concentrations 659.3 µg.L–1 and 498.5 µg.L–1. During the dry season, P1 and P6 differed in total phosphorus, with mean concentrations 52 µg.L–1 and 22.7 µg.L–1, respectively, whereas during the rainy season variation amplitude. All analyses were carried out
by Statistica 8.0.
3. Results
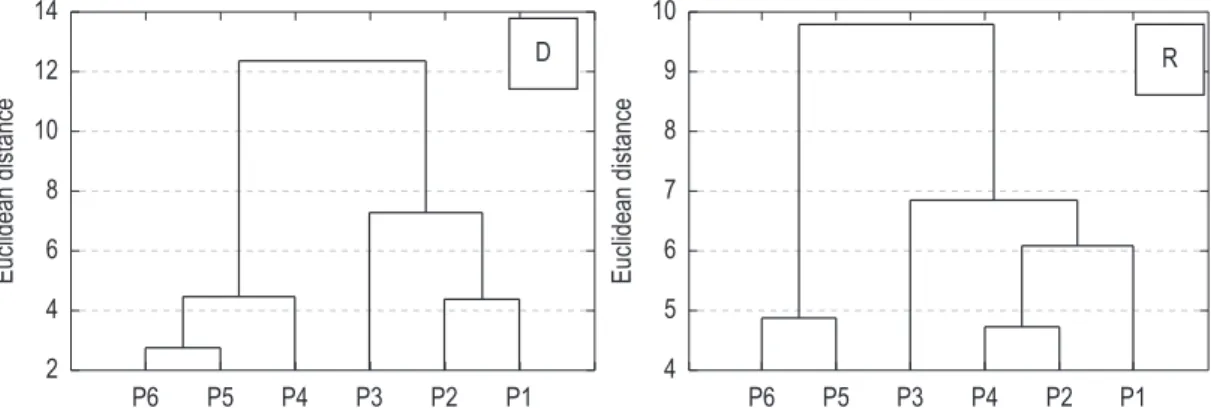
Similarity analysis for physical, chemical and microbiological parameters showed the formation of two groups during the rainy and dry seasons. P3, P4, P2 and P1 points during the rainy season were markedly different from P6 and P5, due to the direct influence of nutrient and organic matter inflow. P3, P2 and P1 were different from P6, P5 and P4 during the dry season (Figure 2).
Principal Components Analysis, conducted with the limnological variables obtained during the monitoring period, showed that the first three components concentrated 87% of the available original information (Figure 3).
Axis 1 (45%) showed a sharp opposition between points P1, P2 and P3 during the rainy season and between points P4, P5 and P6 during the dry season, with greater and lesser load of nutrients, organic matter and fecal coliforms in the environment (Figure 3a). During the dry season, points P4, P5 and P6 on axis 1 were greatly related to transparency and dissolved oxygen, whereas during the rainy season P1, P2 and P3 were related to nitrite, pH, rainfall, temperature, orthophosphate, ammonia, total phosphorus, chlorophyll-a, BOD5, organic matter in the sediment, phosphorus in the sediment, TSS, total coliforms and Escherichia coli (Figure 3).
A sharp opposition between P4, P5 and P6 during the rainy season and P1, P2 and P3 during the dry season may be observed on axis 2 (29%). The points were related to nitrate and TDS during the dry season (Figure 3a). Since P3 on axis 3 was greatly related with electrical conductivity during the dry season (Figure 3b), it should be
(0.3 NMP.mL–1) and P
6 (0.2 NMP.mL–1) (Table 1). During the rainy season, significant differences (p < 0.05) were observed between E. coli and fecal coliforms at points P3 (24.8 NMP.mL–1 and 21.1 NMP.mL–1), P
5 (0.4 NMP.mL–1 and 0.5 NMP.mL–1) and P
6 (0.5 NMP.mL–1 and 0.5 NMP.mL–1) (Table 1).
No significant difference (p > 0.05) was reported for transparency, organic matter and phosphorus in the sediment between seasons and points. P2 had a higher rate in organic matter (23.6%) and P4 had a lower one (9.9%) (Table 1). Total phosphorus differences between P1 and P5 occurred with
mean concentrations 66.9 µg.L–1 and 38.3 µg.L–1 respectively. There was no significant difference for orthophosphate (p > 0.05) among the points (Table 1).
Significant differences (p < 0.05) were detected during the dry season for E. coli between P1 and P5 and P6 (6.6 NMP.mL–1, 0.4 NMP.mL–1 and 0.3 NMP.mL–1 respectively). In the case of fecal coliforms, P1 (6.8 NMP.mL–1) differed (p < 0.05) from P6 (0.2 NMP.mL–1), whereas P
3 (12.3 NMP.mL–1) differed (p < 0.05) from P
5
a
b
Figure 3. Interpolation of autovalues from the matrix of abiotic and microbiological parameters in the pond, where a) the first two components, b) the first and third components, D = dry, R = rainy, DO = dissolved oxygen, Rain = rain-fall, Orto = orthophosphate, Cond = conductivity, OMs = organic matter in the sediment, Ps = phosphorus in the
sediment, TC = total coliforms, E. coli = Escherichia coli, TSS = total suspended solids, TDS = total dissolved solids,
Physical, chemical and micr
obiological aspects...
Table 1. Means and deviation standard of variables analyzed: Rain = Rainfall (mm), Temp = temperature (°C), pH, Transp = transparency (cm), DO = dissolved oxygen (mg.L–1),
Cond = conductivity (µS.cm–1), Chloa = chlorophyll-a (mg.L–1), nitrate, nitrite and ammonia (µg.L–1), Orto = orthophosphate (µg.L–1), TP = total phosphorus (µg.L–1), TC = total
coliforms (NMP.100 mL–1), E. coli (NMP.100mL–1), OMsed = organic matter in the sediment (% dry weight), Psed = phosphorus in the sediment (mg.g–1), BOD
5 = 5-day biochemical
oxygen demand (mg.L–1), TDS = total dissolved solids (mg.L–1) and TSS = total suspended solids (mg.L–1).
Variables Dry season Rainy season
(n = 6) P1 P2 P3 P4 P5 P6 Z1 P
1 P2 P3 P4 P5 P6 Z
2 Z3
Rain 18.9 ± 20.7 18.9 ± 20.7 18.9 ± 20.7 18.9 ± 20.7 18.9 ± 20.7 18.9 ± 20.7 - 179.7 ± 85.2 179.7 ± 85.2 179.7 ± 85.2 179.7 ± 85.2 179.7 ± 85.2 179.7 ± 85.2 - –2.9**
Temp 20.1ns ± 1.1 19.9ns ± 1.3 19.8ns ± 1.4 19.8ns ± 1.5 19.5ns ± 1.5 19.7ns ± 1.5 0.5ns 23.3ns ± 1.5 23.5ns ± 1.4 23.4ns ± 1.5 23.4ns ± 1.5 23.3ns ± 1.5 23.5ns ± 1.5 0.0ns –2.9** Cond 45.2A ± 2.8 46.0ns ± 3 51.0A ± 2.2 45.5ns ± 2.7 46.0ns ± 2 48.0ns ± 0.9 0.2ns 45.3ns ± 1.8 45.2ns ± 2.2 49.0ns ± 2.3 47.3ns ± 1.8 49.2ns ± 3.6 49.3ns ± 1.4 –2.1* –0.4ns pH 7.5ns ± 0.4 7.4ns ± 0.4 7.5ns ± 0.4 7.5ns ± 0.4 7.5ns ± 0.4 7.5ns ± 0.4 –0.1ns 7.9ns ± 0.2 8.0ns ± 0.2 7.9ns ± 0.1 8.0ns ± 0.2 8.0ns ± 0.2 7.9ns ± 0.2 –0.2ns –2.9** DO 3.4ns ± 0.6 3.3ns ± 1.2 3.0ns ± 1.3 3.4ns ± 1.3 3.3ns ± 1.2 3.4ns ± 1.1 –0.3ns 2.0ns ± 0.8 1.9ns ± 1 2.5ns ± 0.7 2.3ns ± 0.4 2.1ns ± 0.8 1.9ns ± 0.8 0.6ns 2.9** Nitrate 806.7A ±
220.5
714.2ns ± 186.5
905.7ns ± 203.3
773.5ns ± 203.6
582.9A ± 139
611.3ns ± 97.7
1.9* 634.3ns ± 32.9
557.6ns ± 70.4
659.3A ± 143.9
507.3ns ± 139.3
498.5A ± 111.1
525.3ns ± 77.8
2.2* 2.2*
Nitrite 3.4ns ± 1.5 3.8ns ± 1.4 4.7ns ± 1.8 4.7ns ± 1.7 4.1ns ± 2.5 3.8ns ± 2 0.3ns 4.1ns ± 1.1 5.3ns ± 1.6 7.2ns ± 2.3 5.4ns ± 1.7 5.5ns ± 1 5.6ns ± 0.7 0.0ns –2.4* Ammonia 38.6ns ± 19.3 43.7ns ± 37.4 103.5ns ± 125.1 58.4ns ± 63.9 39.5ns ± 36.3 54.0ns ± 68.4 1.4ns 73.2ns ± 35.4 75.1ns ± 34.5 81.0ns ± 44.6 82.5ns ± 48.1 61.8ns ± 41.8 66 ± 36.7 0.6ns –1.9ns TP 52.0A ± 23.4 35.4ns ± 11.4 43.7ns ± 8.5 33.5ns ± 17.1 29.5ns ± 12.8 22.7A ± 14.3 1.8ns 66.9A ± 8.7 47.2ns ± 5.3 66.4ns ± 19.3 54.5ns ± 11.3 38.3A ± 6.2 47.6ns ± 9.1 2.9** –2.2* Ortho 4.1ns ± 6.5 2.2ns ± 4.4 4.1ns ± 6.5 4.1ns ± 7.7 2.8ns ± 4.4 1.8ns ± 4.3 0.6ns 9.6ns ± 3.8 6.2ns ± 4.8 10.2ns ± 5.5 6.3ns ± 5.3 7.3ns ± 5.8 4.0ns ± 3.2 1.9* –2.4* E. coli 6.6AB ± 5.6 6.7ns ± 6.6 14.2ns ± 9.8 0.8ns ± 0.2 0.4A ± 0.4 0.3B ± 0.1 2.9** 6.0ns ± 5.2 5.1ns ± 3.4 24.8 AB ± 16.4 0.8ns ± 0.4 0.4A ± 0.2 0.5B ± 0.2 2.9** –0.2ns
TC 6.8A ± 5.3 5.1ns ± 5.9 12.3BC ± 11.8 0.8ns ± 0.2 0.3B+ ± 0.3 0.2AC ± 0.2 2.9** 11.4ns ± 17.8 7.4ns ± 8.7 21.1AB ± 19.6 0.9ns ± 0.6 0.5A ± 0.3 0.5B ± 0.3 2.9** –0.8ns
OMsed 17.9ns ± 2.6 12.8ns ± 7.5 15.1ns ± 5.7 9.9ns ± 6.2 - - NS 20.4ns ± 3.7 23.6ns ± 8.8 15.8ns ± 6.7 15.6ns ± 3.9 - - NS –1.0ns
Psed 0.9ns ± 0.2 0.7ns ± 0.3 0.7ns ± 0.3 0.6ns ± 0.3 - - NS 0.9ns ± 0.2 0.8ns ± 0.2 0.7ns ± 0.2 0.9ns ± 0.1 - - NS –1.0ns
Chloa 11.2A ± 5.6 11.6ns ± 10.8 9.9ns ± 6.3 5.6ns ± 3.5 4.0ns ± 4 2.6A ± 3.1 2.2* 29.3A ± 12.2 20.0ns ± 10.9 25.6ns+ ± 13.8 7.9ns ± 5.4 6.7ns ± 4.2 5.3A ± 4.9 2.9** –1.3ns
Transp - - - 149.0ns ± 31.5 113.3ns ± 12.5 110.8ns ± 11.1 NS - - - 124.2ns ± 12.8 113.3ns ± 14 101.7ns ± 10.3 NS 0.2ns
BOD5 2.9A ± 0.7 2.2ns ± 0.8 2.5ns ± 1.5 1.0ns ± 0.7 0.9A ± 0.6 0.9ns ± 0.6 2.7** 3.4ns ± 0.7 3.4ns ± 1 3.0ns ± 0.7 1.3ns ± 0.6 1.2ns ± 0.5 1.2ns ± 0.5 2.9** –1.4ns TSS 153.3A ± 127.9 105.0ns ± 90.5 143.3B ± 113.1 56.7ns ± 46.8 23.3AB ± 16.3 25.0ns ± 10.5 2.7** 253.3A ± 162 181.7ns ± 119 205.0ns ± 110 71.7ns ± 29.3 31.7ns ± 19.4 30.0A ± 11 2.9** –1.1ns
TDS 2441.7ns ±
2484
3516.7ns ± 2963
2325.0ns ± 1666
1176.7ns ± 1029
613.3ns ± 288
436.7ns ± 278
2.7** 3088.3A ± 2308
2121.7B ± 715
2193.3ns ± 698
1501.7ns ± 338
713.3ns ± 481
435.0AB ± 176
2.9** 1.1ns
Mann-Whitney U-test: Z1 = comparison between inflow and outflow in dry season (n = 18); Z2 = comparison between inflow and outflow in rainy season (n = 18); Z3 = mean comparison between dry season and rainy season (n = 36); Kruskall-Wallis test statistic, points with the same letter do not differ (n = 6), *p < 0.05; **p < 0.01; - = not measured, NS = not significant.
ol. 24, no
. 3, p
. 276-284
oxygen in the pond and influenced directly the trophic state.
Distinct conditions between the dry and rainy seasons determined changes in leaves, biomass and survival of macrophytes (Touchette et al., 2010). In current study, rainfall affected the inflow of nutrients into the pond, increased the environmental trophic load and impaired the quality of water supply for the aquaculture system.
Insignificant pH oscillations in water are frequent in small ponds with macrophytes and the presence of sediment and plants determine low rates in dissolved oxygen and electrical conductivity with slight acidification of the water (Crispim et al., 2009). However, in current study rainfall was the main factor that increased pH of the water column.
Mean dissolved oxygen concentration remained below 3.4 mg.L–1 during the dry season and 2.5 mg.L–1 during the rainy season. This fact has been reported by Takamura et al. (2003), who reported that high macrophyte densities decreased the penetration of light and the inflow of allochthonous material during the rainy season, increased water turbidity and impaired the photosynthesis activities of the phytoplankton.
Although fecal bacteria are frequently found in environments with high nutrient concentrations (Wilcock et al., 2011), organic carbon is a determining factor for the development of bacteria in water. Principal components analysis in current study revealed the relationship between fecal coliforms and rainfall, suspended matter, nutrients in the water, organic matter and phosphorus in the sediment.
Aquatic plants are greatly recommended because of their high efficiency in removing coliforms, with the subsequent simplifying and lowering of costs in water treatment (Kacar and Gungor, 2010) and a decrease in risks for public health, as recommended by several international organizations (Agatemor and Okolo, 2007).
Current data demonstrated that local fauna (capybara) influenced the rate of fecal bacteria, in the sediment had a higher concentration at P1
(0.9 mg.g–1) and a lower one at P
4 (0.6 mg.g–1) (Table 1). Water transparency was higher at P4 (149 cm) and lower at P6 (101 cm) (Table 1).
Chlorophyll-a concentration differed significantly (p < 0.05) for Z1 and Z2, which revealed a higher association of phytoplankton due to the inflow of nutrients. Significant difference (p < 0.05) was detected between P1 and P6 in the two seasons, with 11.2 µg.L–1 and 2.6 µg.L–1 in the dry season and 29.3 µg.L–1 and 5.3 µg.L–1 in the rainy season, with the highest concentrations at P1 (Table 1).
BOD5, TDS and TSS rates were significantly different (p < 0.05) for Z1 and Z2 and showed that macrophytes and allochthonous material caused an increase in organic matter within the environment. Significant differences (p < 0.05) in BOD5 only occurred between P1 (2.9 mg.L–1) and P5 (0.9 mg.L–1) during the dry season. With regard to TSS, significant difference (p < 0.05) occurred between P1 (153.3 mg.L–1), P
3 (143.3 mg.L –1) and P5 (23.3 mg.L–1) during the dry season, and between P1 (253.3) and P6 (30 mg.L–1) during the rainy season (Table 1).
High rates of Trophic State Index (Table 2) occurred at the inflow area of runoff water. Riparian vegetation did not adequately constrain flooding from the pastureland surrounding the pond. Consequently, an increase in the concentrations of phosphorus and other nutrients occurred, favoring vegetal development, especially at the supereutrophic points P1 and P3 respectively during the dry and rainy seasons. Throughout the experimental period P4 was mesotrophic due to its transitional condition between water inflow and outflow (Table 2).
4. Discussion
Some factors caused variations among the sampling points and between the dry and rainy seasons. The capybaras affected the rates of suspended material, BOD5 and fecal coliforms in the water, even though rainfall was a determining factor in nutrient concentration, pH and dissolved
Table 2. Trophic state at sampling points (P1-P6) during the dry and rainy seasons.
Season Point TSI Season Point TSI
Dry P1 Supereutrophic Rainy P1 Eutrophic
P2 Eutrophic P2 Eutrophic
P3 Eutrophic P3 Supereutrophic
P4 Mesotrophic P4 Mesotrophic
P5 Oligotrophic P5 Mesotrophic
group of the Limnology and Plankton Production Laboratory of CAUNESP.
References
AGATEMOR, C. and OKOLO, PO. 2007. University of Benin water supply system: Microbiological and
physical-chemical assessments. Environmentalist,
vol. 27, no. 2, p. 227-239. http://dx.doi.org/10.1007/ s10669-007-9000-4
ANDERSEN, JM. 1976. An ignition method for determination of total phosphorus in lake sediments.
Water Research, vol. 10, p. 329-331. http://dx.doi. org/10.1016/0043-1354(76)90175-5
BRAINWOOD, MA. and MAHESHWARI, SBS. 2004. Temporal variations in water quality of farm dams:
impacts of land use and water source. Agricultural
Water Management, vol. 70, no. 2, p. 151-175. http:// dx.doi.org/10.1016/j.agwat.2004.03.006
BOYD, CE. and TUCKER, CS. 1992. Pond aquaculture
water quality management. Alabama: Agricultural Experiment Station. p. 183.
CALIJURI, MC., CUNHA, DGF., QUEIROZ, LA. and MIWA, ACP. 2008. Nutrients and chlorophyll-a concentrations in tropical rivers of Ribeira de Iguape
Basin, SP, Brazil. Acta Limnologica Brasiliensia,
vol. 20, no. 2, p. 131-138.
CRISPIM, MC., VIEIRA, ACB., COELHO, SFM. and MEDEIRO, AMA. 2009. Nutrient uptake efficiency by macrophyte and biofilm: practical strategies
for small-scale fish farming. Acta LimnologicaS
Brasiliensia, vol. 21, no. 4, p. 387-391.
GOLTERMAN, HL., CLYMO, RS. and OHNSTAD,
MAM. 1978. Methods for physical and chemical
analysis of freshwater. London: Blackwell Sci. Publ. p. 213.
GREENBERG, AE., CLESCERI, LS. and EATON,
AD. 1992. Standard methods for examination of water
wastewater. 18th ed. Washington: American Public Health Association. p. 1100.
JONIAK, T., KUCZYNSKA-KIPPEN, N. and NAGENGAST, B. 2007. The role of aquatic macrophytes in microhabitatual transformation of physical-chemical features of small water bodies.
Hydrobiologia, vol. 584, no. 1, p. 101-109. http:// dx.doi.org/10.1007/s10750-007-0595-8
KACAR, A. and GUNGOR, F. 2010. Comparison of fecal coliform bacteria before and after wastewater treatment plant in the Izmir Bay (Eastern Aegean
Sea). Environmental Monitoring Assessment, vol. 162,
no. 1-4, p. 355-363. PMid:19234749. http://dx.doi. org/10.1007/s10661-009-0801-4
KOROLEFF, F. 1983. Determination of ammonia. In GRASSHOFF, K., EHRHARDT, M. and
KREMLING, K. Methods of seawater analysis:
second, revised and extended edition. German: Verlag Chemie. p. 126-133.
LISHAWA, SC., ALBERT, DA. and TUCHMAN, NC. 2010. Water level decline promotes Typha x
BOD5, suspended solids and conductivity. The capybaras in the environment under analysis deteriorated the water quality by fecal coliforms and sediment suspensions.
Points P1, P2 and P3 are greatly related to chlorophyll-a, total phosphorus and electrical conductivity in the water, due to the inflow of nutrients, runoff of pastureland near the pond, and to animals that affect sediment suspension in shallow environments. Sediment re-suspension may increase phosphorus rates in the water and enhance the increase of phytoplankton in many aquatic environments (Thomaz et al., 2007).
Although a moderate trophic state in water reservoirs may benefit the aquatic organism populations due to an increase in nutrient availability for phytoplankton and zooplankton communities, it may also be a liability because of the supply of nutrients to the toxic microorganisms in the environment (Takenaka et al., 2006). Current study showed that water outflows would become oligotrophic and mesotrophic if the capybaras and the surrounding area were not properly managed. In fact, the trophic status would increase in points P5-P6 in the near future.
Water plants may contribute towards an increase in eutrophication during the decomposition processes (Thomaz and Bini, 2003). Macrophytes in current study became biological filters and improved the environmental conditions of points P1, P2 and P3 at the water inflow in the pond and for the water outflow at P5-P6 that supply the several ponds of the aquaculture farm.
The system under analysis is directly influenced by rainfall, local fauna and the lack of adequate management around the pond. Water quality during the dry season was adequate for supply even though the nutrients, fecal coliforms and trophic state index increased during the rainy season and dissolved oxygen concentration decreased because of the high load of allochthonous material from the surrounding area. Water deterioration may affect the production capacity and the quality of organisms of the aquaculture farm. The control of allochthonous material from the cattle-raising (cattle- and sheep-breeding) area introduced into the pond by leaching, the isolation of animals that deteriorate water quality and the maintenance of macrophytes in the pond are recommended.
Acknowledgements
SIPAÚBA-TAVARES, LH., GUARIGLIA, CST. and BRAGA, FMS. 2007. Effects of rainfall on water quality in six sequentially disposed fishponds with
continuous water flow. Brazilian Journal of Biology,
vol. 67, no. 4, p. 643-649. PMid:18278315. http:// dx.doi.org/10.1590/S1519-69842007000400008 SUDING, KN., GROSS, KL. and HOUSEMAN,
GR. 2004. Alternative states and positive feedbacks in
restoration ecology. Trends in Ecology and Evolution,
vol. 19, no. 1, p. 46-53. PMid:16701225. http:// dx.doi.org/10.1016/j.tree.2003.10.005
TAGUCHI, K. and NAKATA, K. 2009. Evaluation of biological water purification functions of inland
lakes using an aquatic ecosystem model. Ecological
Modelling, vol. 220, no. 18, p. 2255-2271. http:// dx.doi.org/10.1016/j.ecolmodel.2009.05.007 TAKAMURA, N., KADONO, Y., FUKUSHIMA,
M., NAKAGAWA, M. and KIM, BHO. 2003. Effects of aquatic macrophytes on water quality and phytoplankton communities in shallow lakes.
Ecological Research, vol. 18, no. 4, p. 381-395. http:// dx.doi.org/10.1046/j.1440-1703.2003.00563.x TAKENAKA, RA., SOTERO-SANTOS, RB. and
ROCHA, O. 2006. Water quality assessment by Ecotoxicological and Limnological Methods in Water
Supplies, Southeast Brazil. Ecotoxicology, vol. 15,
no. 7, p. 73-82. PMid:16374663.
THOMAZ, SM., BINI, LM. and BOZELLI, RL. 2007. Floods increase similarity among aquatic habitats in
river-floodplain systems. Hydrobiologia, vol. 579,
no. 1, p. 1-13. http://dx.doi.org/10.1007/s10750-006-0285-y
THOMAZ, SM. and BINI, LM. 2003. Ecologia e manejo
de macrófitas aquáticas. Maringá: Eduem. p. 341. TOLEDO JUNIOR, AP., TALARICO, M., CHINEZ,
SJ. and AGUDO, EG. 1983. A aplicação de modelos simplificados para a avaliação do processo de eutrofização em lagos e reservatórios tropicais. In Anais do 12° Congresso Brasileiro de Engenharia Sanitária e Ambiental, 1983. Camburiú. p. 34. TOUCHETTE, BW., IANNACONE, LR., TURNER,
G. and FRANK, A. 2010. Ecophysiological responses of five emergent-wetlands plants to diminished water
supply: an experimental microcosm study. Aquatic
Ecology, vol. 44, no. 1, p. 101-112. http://dx.doi. org/10.1007/s10452-009-9246-7
WILCOCK, RJ., NASH, D., SCHMIDT, J., LARNED, ST., RIVER, MR. and FEEHAN, P. 2011. Inputs of nutrients and fecal bacteria to freshwaters from irrigated agriculture: Cases studies in Australia and
New Zealand. Environmental Management, vol. 48,
no. 1, p. 198-211. PMid:21365272. http://dx.doi. org/10.1007/s00267-011-9644-1
ZAR, JH. Biostatistical Analysis. New Jersey: Prentice-Hall
Inc., 1999. p. 620.
Received: 02 January 2012 Accepted: 05 November 2012 glauca establishment and vegetation change in great
lakes coastal wetlands. Wetlands, vol. 30, no. 6,
p. 1085-1096. http://dx.doi.org/10.1007/s13157-010-0113-z
MANLY, BFJ. 1986. Multivariate Statistical Methods.
London: Chapman Hall. p. 159.
MEADOR, MR. and GOLDSTEIN, RM. 2003. Assessing water quality at large geographic scales: Relations among land use, water physicochemistry, riparian condition and fish community structure.
Environmental Management, vol. 31, no. 4, p. 504-517. PMid:12677296. http://dx.doi. org/10.1007/s00267-002-2805-5
NEILL, H., GUTIERREZ, M. and ALEY, T. 2004. Influences of agricultural practices on water quality of Tumbling Creek cave stream in Taney County,
Missouri. Environmental Geology, vol. 45, no. 4,
p. 550-559. http://dx.doi.org/10.1007/s00254-003-0910-2
NUSCH, EA. 1980. Comparison of different method for chlorophyll and pheopigments determination.
Archiv für Hydrobiologie, vol. 14, p. 14-36.
PEEL, MC., FINLAYSON, BL. and McMAHON, TA. 2007. Updated world map of the
Köppen-Geiser climate classification. Hydrology and Earth
System Sciences, vol. 11, p. 1633-1644. http://dx.doi. org/10.5194/hess-11-1633-2007
PLUMMER, JD. and LONG, SC. 2007. Monitoring source water for microbial contamination: evaluation
of water quality measures. Water Research, vol. 41,
no. 16, p. 3716-3728. PMid:17560623. http:// dx.doi.org/10.1016/j.watres.2007.05.004
RUGGIERO, A., SOLIMINI, AG. and CARCHINI, G. 2003. Nutrient and chlorophyll-a temporal patterns in eutrophic mountain ponds with
contrasting macrophyte coverage. Hydrobiologia,
vol. 506-509, no. 1-3, p. 657-663. http://dx.doi. org/10.1023/B:HYDR.0000008549.04464.cc
SIEGEL, S. 1975. Non-Parametric Statistics for the
behavioral sciences. São Paulo: McGraw-Hill do Brasil. p. 350.
SILVA, AMM. and SACOMANI, LB. 2001. Using chemical and physical parameters to define the quality
of Pardo River water (Botucatu SP Brazil). Water
Research, vol. 35, no. 6, p. 1609-1616. http://dx.doi. org/10.1016/S0043-1354(00)00415-2
SIPAÚBA-TAVARES, LH., OLIVEIRA, DBS., CASTAGNOLLI, MC., BACHION, MA. and DURIGAN, JG. 1991. Estudo batimétrico e
morfométrico em represas. Ciência Zootécnica, vol. 6,
no. 1, p. 10-12.
SIPAÚBA-TAVARES, LH. 2006. Aspectos limnológicos de um viveiro utilizado como abastecimento de água
para sistemas de aquicultura. Boletim Técnico do