The Impact of Competitive Foods on
C
hildren’s
Fruit and Vegetable Consumption:
An Observational Plate Waste Study
Janie W. Cole Christopher R. Aloia
Lacy M. Dodd Kathy B. Knight University of Mississippi
Little is known about the effect of competitive foods on children’s consumption of lunch meals in elementary schools in Mississippi. The objective of this
observational study was to examine how competitive food purchases affect entrée, fruit, and vegetable consumption using the quarter-waste method. A total of 862 meals and purchase of competitive foods were observed. Children who purchased ice cream or pudding were 1.6 times more likely to throw away more than 50% of their entrée, 3.5 times more likely to not eat their vegetables, and more than two times more likely to not eat their fruit than children who did not purchase ice cream or pudding. Children who purchased chips were also less likely to
consume more than 50% of their entrée. These findings suggest that competitive foods can impact children’s fruit and vegetable consumption.
Keywords: childhood obesity, child nutrition programs, school lunch, competitive foods, plate waste, fruit and vegetable consumption
Introduction
With obesity rates doubling in preschool children and tripling in adolescents over the last four decades and increasing concern over the nutritional status of the nation’s youth, the United States government declared childhood obesity a national priority in 2005 (Hoelscher, Kirk, Ritchie, Cunningham-Sabo, & Academy Positions Committee, 2013). Mississippi and neighboring states are ground zero for childhood obesity and other diet-related diseases (Centers for Disease
to policy decisions and school nutrition interventions that encouraged healthier school lunches and better nutrition choices by students (Kolbo et al., 2012; Story, Kaphingst, & French, 2006). Since school attendance is required by law, schools offer a long-term opportunity to provide healthy food to more than 95% of U.S. youths and adolescents (Story, 1999; Story et al., 2006).
Competitive Foods
Although all foods served as part of reimbursable meals in child nutrition programs are required to meet nutritional standards (United States Department of Agriculture [USDA] Food and Nutrition Service, 2013), there are other foods sold “a la carte” or in vending machines that are broadly referred to as “competitivefoods” (Fox, Gordon, Nogales, & Wilson, 2009). In 2010, the Mississippi Department of Education (2014) developed a strong policy regarding competitive foods, which decreased their availability but still allowed some access by specifically identifying ice cream as a milk product, thus allowing children to purchase ice cream with meals. The purchase of baked and other reduced-fat chips, a popular snack, is also allowed because they meet the USDA “SmartSnacks” standards for fat, saturated fat, sugar, and sodium (Mississippi Department of Education, 2014; USDA Food and Nutrition Service, 2015). Additionally in 2010, the Mississippi School Nutrition Environment Evaluation Data System (MS NEEDS) found that over the course of four years, the number of Mississippi public schools in compliance with the state policy on competitive foods increased, and ice cream and reduced-fat chips were the main competitive food items sold (Carithers et al., 2010).
In a review of the influence of competitive foods on consumption of school meals and students’ body mass indexes (BMIs), Chriquip, Pickel, and Story (2014) concluded that there was ample evidence to suggest that limiting competitive foods reduced children's consumption of them, but there were mixed findings as to whether this reduction would decrease BMIs. Earlier studies found that the purchase of competitive foods decreased school lunch consumption and increased plate waste, which resulted in lower intakes of vital nutrients (Larson & Story, 2010; Templeton, Marlette, & Panemangalore, 2005). Although Mississippi has made modest progress in
stabilizing childhood obesity and has restricted the sales of competitive foods, more
understanding is needed about the use of competitive foods and how they affect the consumption of fruits and vegetables in Mississippi children. The objective of this research was to determine if competitive food purchases, specifically ice cream, pudding, and chips, affect lunch entrée and fruit and vegetable consumption.
Methodology
Sample and Study Design
where ice cream, pudding, and potato chips are available for children to purchase with meals. An observer at the cafeteria line checkout station noted competitive food purchases. The quarter-waste method was used to measure tray consumption because it has been found to be an accurate and cost-effective method of measuring plate waste (Hanks, Wansink, & Just, 2014). This study was approved by the University of Mississippi Institutional Review Board. The
Eating Good…and Moving Like We Should project was funded by the W.K. Kellogg Foundation.
Instrument and Protocol
Six trained observers were present in the cafeteria on three nonconsecutive days (24-2014, 2-25-2014, and 3-14-2014). The convenience sample included only trays of children who received a school lunch meal with an entrée, vegetable, and fruit (n = 862) at the one elementary school in the district for third and fourth graders. Before lunchtime on each of the three days, a registered dietitian and a health educator trained the research assistants and the school lunch staff on the quarter-waste method for measuring food consumption (Hanks et al., 2014). A tray was prepared with an entrée, vegetable, and fruit, which was considered a 100% serving. Tray servings were standardized, with all children receiving the same portion sizes as outlined in the USDA’sNutrition Standards in the National School Lunch and School Breakfast Programs: Proposed Rule (Concanno, 2011). Study trainers then removed a quarter of the contents to provide the observers with an example of a 25% consumed plate. They took another quarter away from each menu item to show what 50% consumption looked like. Finally, another quarter was taken to show 75% consumption. Although during training, the research assistants
expressed similar observations regarding plate waste amounts, their tray observations were not weighed to assess inter-rater reliability.
Data sheets with columns of the 0, 25, 50, and 75 percentages were then distributed to research assistants to circle the amount consumed for each student. Effort was made to not let the teachers or the children know that food consumption was being measured. Observers
approached the tables as the children were preparing to take their trays to the “dish window” for food disposal. They then walked around the table and observed the children's trays. If asked by the children what they were doing, the observers were instructed to say they were looking at the trays to see if the cafeteria needed new trays. This was to guard against the possibility of observer influence on children’s meal consumption. It is important to note that the school has a policy of not allowing children to bring their backpacks to the cafeteria, and children cannot take food out of the cafeteria.
Statistical Analysis
children who consumed less than 50% of each item were placed in the low food consumer group for that item. The creation of a binomial variable allowed for the data to be analyzed using odds ratios. Only the unadjusted odds ratios were reported (confidence interval of 95%) because this study did not investigate other factors that could influence plate consumption such as
socioeconomic status, recess times, or taste preferences (Szklo & Nieto, 2007). Significance was tested with a value derived from the Mantel-Haenszel common odds ratio estimate (i.e., a p-value of 0.05 and less was considered statistically significant). All analyses were performed on a personal computer using IBM® SPSS® Statistics 22.
Results and Discussion
During the three-day data collection period, an average of 297 reimbursable school meals were servedper day at one elementary school in North Mississippi. Although chef salads were
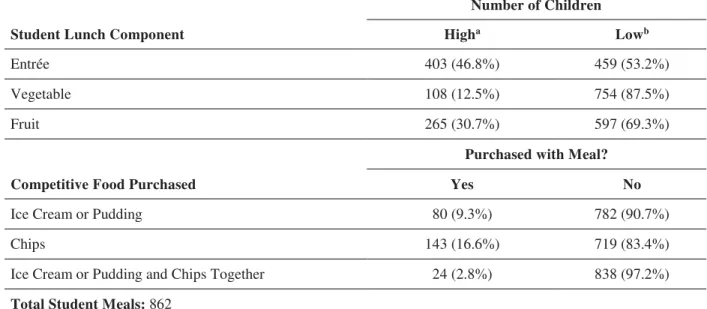
available as an alternate entrée on all days, the relatively few (n < 10 per day) students that chose these were not included in the study. A total of 862 meals with entrées, vegetables, and fruit were observed by either the researchers or the trained assistants. Only the children receiving those meals were counted when observing the purchase of competitive foods. Of those, 80 children purchased ice cream or pudding, 143 purchased chips, and 24 purchased both ice cream or pudding and chips (see Table 1). Ice cream and pudding were counted together as one group because of similar nutrient content and because there were only 4 pudding purchases. No competitive foods were purchased with 639 of the observed meals.
Table 1. Numbers of Children in Each School Meal Consumption and Competitive Foods Purchase Category
Student Lunch Component
Number of Children
Higha Lowb
Entrée 403 (46.8%) 459 (53.2%)
Vegetable 108 (12.5%) 754 (87.5%)
Fruit 265 (30.7%) 597 (69.3%)
Competitive Food Purchased
Purchased with Meal?
Yes No
Ice Cream or Pudding 80 (9.3%) 782 (90.7%)
Chips 143 (16.6%) 719 (83.4%)
Ice Cream or Pudding and Chips Together 24 (2.8%) 838 (97.2%)
Total Student Meals: 862
The entrées served during the observation periods were chicken nachos, Philly cheesesteak sandwiches, and chicken-pot-pie. The vegetables served to the children included broccoli, green beans, and whole kernel corn. The fruits offered were applesauce on day 2 and different fruit cups on days 1 and 3.
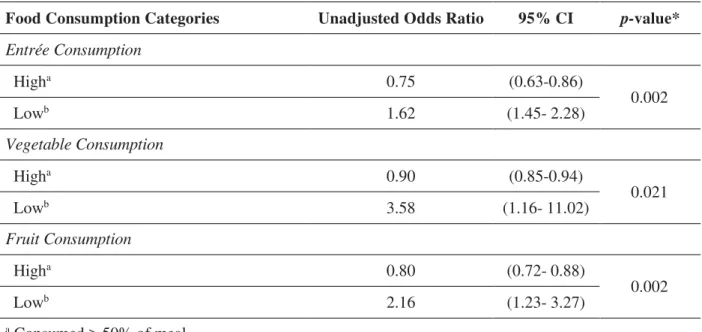
The children who chose ice cream or pudding were 1.6 times more likely to throw away greater than 50% of their entrée (p < 0.01). When comparing vegetable consumption, the ice cream or pudding purchasers were over 3.5 times more likely to not eat their vegetables and over 2 times more likely to not eat their fruit than children who did not purchase ice cream or pudding (p < 0.02) (see Table 2). This finding is consistent with the findings of Fox et al. (2009), Larson and Story (2010), and Templeton et al. (2005), who all reported an impact of competitive foods on the consumption of school meals that meet USDA requirements and suggested that total nutrient density of the children’s diets were being affected.
Table 2. School Lunch Consumption with Ice Cream or Pudding Purchases
Food Consumption Categories Unadjusted Odds Ratio 95% CI p-value*
Entrée Consumption
Higha 0.75 (0.63-0.86)
0.002
Lowb 1.62 (1.45- 2.28)
Vegetable Consumption
Higha 0.90 (0.85-0.94)
0.021
Lowb 3.58 (1.16- 11.02)
Fruit Consumption
Higha 0.80 (0.72- 0.88)
0.002
Lowb 2.16 (1.23- 3.27)
a Consumed > 50% of meal b Consumed < 50% of meal
*A p-value of 0.05 and less was considered statistically significant using the Mantel-Haenszel common odds ratio estimate.
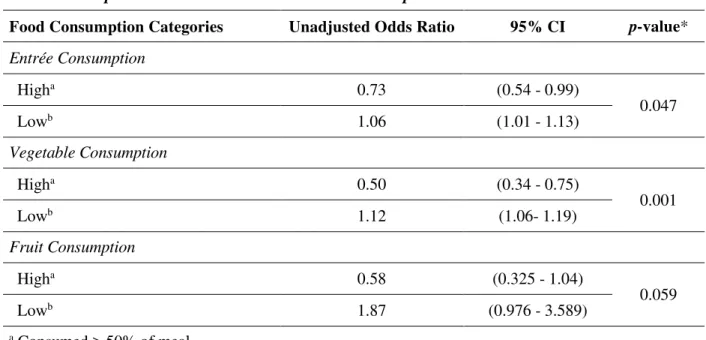
The other finding regarding competitive food purchases revealed that more children purchased chips (n = 143) than ice cream or pudding (n = 80) (see Table 1). The prevalence of chip purchases was nearly double that of ice cream or pudding purchases. While the data for this study show that the purchase of chips had less impact on entrée, fruit, and vegetable
surprising finding, chips did not significantly affect fruit consumption (see Table 3). One
possible explanation for this could be that the sweetness of the ice cream or pudding could satiate the desire for the fruit, whereas the saltiness of the chips could initiate a desire for sweetness. Although there is some research to suggest that dietary salt intake increased sweetened beverage consumption, this may or may not be extrapolated to an increased desire for fruit (Mennella, Finkbeiner, Lipchock, Hwang, & Reed, 2014; Sijtsema, Reinders, Hiller, & Guàrdia, 2012; Wansink, Bascoul, & Chen, 2006). Classic taste studies have reported that salt highlights sweet tastes, while sugar reduces saltiness (McWilliams, 2012), so the interaction of these flavors may produce even more pleasurable sensations than either alone.
Table 3. Chip Purchases and School Lunch Consumption
Food Consumption Categories Unadjusted Odds Ratio 95% CI p-value*
Entrée Consumption
Higha 0.73 (0.54 - 0.99)
0.047
Lowb 1.06 (1.01 - 1.13)
Vegetable Consumption
Higha 0.50 (0.34 - 0.75)
0.001
Lowb 1.12 (1.06- 1.19)
Fruit Consumption
Higha 0.58 (0.325 - 1.04)
0.059
Lowb 1.87 (0.976 - 3.589)
a Consumed > 50% of meal
b Consumed < 50% of meal
*A p-value of 0.05 and less was considered statistically significant using the Mantel-Haenszel common odds ratio estimate.
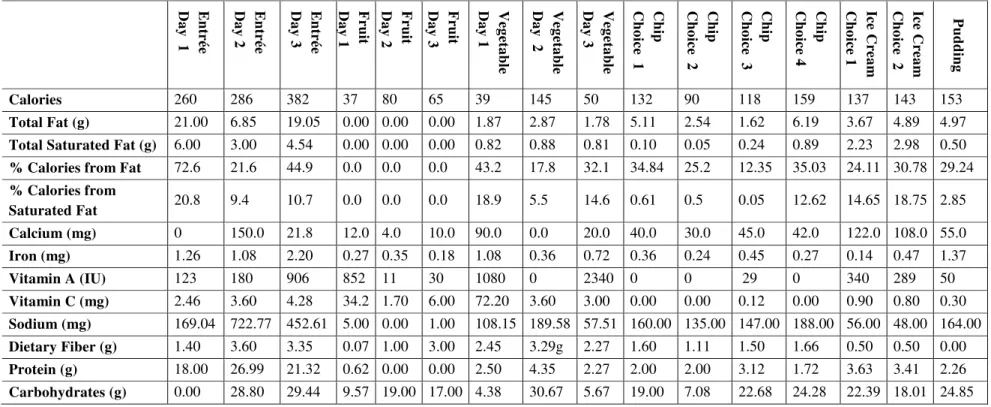
Table 4. Nutrient Compositions for Meals Served vs. Those in Competitive Foods E ntr ée Da y 1 E ntr ée Da y 2 E ntr ée Da y 3 F ruit Da y 1 F ruit Da y 2 F ruit Da y 3 Veg et a ble Da y 1 Veg et a ble Da y 2 Veg et a ble Da y 3 Chip C ho ice 1 Chip C ho ice 2 Chip C ho ice 3 Chip C ho ice 4 Ice Cre a m C ho ice 1 Ice Cre a m C ho ice 2 P ud din g
Calories 260 286 382 37 80 65 39 145 50 132 90 118 159 137 143 153 Total Fat (g) 21.00 6.85 19.05 0.00 0.00 0.00 1.87 2.87 1.78 5.11 2.54 1.62 6.19 3.67 4.89 4.97 Total Saturated Fat (g) 6.00 3.00 4.54 0.00 0.00 0.00 0.82 0.88 0.81 0.10 0.05 0.24 0.89 2.23 2.98 0.50 % Calories from Fat 72.6 21.6 44.9 0.0 0.0 0.0 43.2 17.8 32.1 34.84 25.2 12.35 35.03 24.11 30.78 29.24 % Calories from
Another theory is that low-caloric entrées or vegetables may offer low satiety, while the high-caloric competitive food options hold the promise of satiety. While at the time of the study, the nutrition standards for competitive foods as reflected in the Interim Final Rule on Smart Snacks (USDA Food and Nutrition Service, 2013) were proposed rules only and were not established, this school district adhered to those standards. Thus, when comparing nutrient content for all items served (see Table 4), the energy and fat contents of the chip, ice cream, and pudding choices were not greater than the entrées. Two of the three vegetable choices were lower in fat and kcalories than the competitive foods but were not chosen significantly more or less than the vegetable choice that was higher in fat and comparable in kcalories. Therefore, the children were not gaining greater satiety from competitive foods than from the foods in their meal.
Finally, as stated in classic nutrition literature (Stunkard, 1975), satiety is a conditioned response. Most Americans see ice cream and pudding as an end to a meal, while chips, when served at mealtime, are eaten with the meal. Further research is needed to identify whether sweets, regardless of fat or protein content, significantly impact the amounts of food eaten in the school lunch setting.
Conclusions and Application
The results of this study suggest that the type of competitive food purchased affects lunch component consumption. Specifically, children who purchased ice cream or pudding with their meal were more likely to eat that and throw away most of the meal, thus working against the
USDA’s efforts to provide healthy school meals. Also, although in relation to ice cream, chips
do not have as strong an impact on the consumption of the total meal, chips still had an impact. Interestingly, children who purchased chips were more likely to consume their fruit than children who purchased ice cream. This study's findings were consistent with Gonzalez, Jones, and Frongillo's 2009 study that concluded that eliminating availability of competitive foods was more effective at encouraging children to eat healthier foods than simply limiting their choices of competitive foods. Future studies should explore the influence of specific competitive foods on lunch completion, especially using larger samples of children in different regions of the U.S. Additionally, it would be interesting to investigate barriers that child nutrition programs have experienced in eliminating competitive foods altogether and how revenue generated by competitive foods influences policies that allow them.
Limitations
In future studies, more variables should be included, such as socioeconomic status, BMI, recess times, and family eating patterns. This would allow use of the adjusted odds ratios.
Competing Interests
The authors declare no competing interests in the writing and researching of the information in this paper.
References
Astrup, A. (2006). Carbohydrates as macronutrients in relation to protein and fat for body weight control. International Journal of Obesity, 30, S4–S9. doi:10.1038/sj.ijo.0803485
Carithers, T., Lambert, L., Parkes, E., Dickerson, A., Edwards, P., Zhang, L., … Coyle, K.
(2010). Mississippi School Nutrition Environment Evaluation Data System (MS NEEDS), Technical report year one (2008-2009) outcomes. Retrieved from
http://stage.mshealthpolicy.com/wp-content/uploads/2012/06/MSNEEDSYearOne_Report1-1-2010.pdf
Centers for Disease Control and Prevention (CDC). (2012). Diabetes report card, 2012. Retrieved from http://www.cdc.gov/diabetes/pubs/pdf/diabetesreportcard.pdf
Centers for Disease Control and Prevention (CDC). (2015). Obese youth over time. Retrieved from http://www.cdc.gov/healthyyouth/obesity/obesity-youth.htm
Chriquip, J. F., Pickel, M., & Story, M. (2014). Influence of school competitive food and beverage policies on obesity, consumption, and availability: A systematic review. JAMA Pediatrics, 168(3), 279–286. doi:10.1001/jamapediatrics.2013.4457
Concanno, K. (2011). Nutrition standards in the National School Lunch and School Breakfast Programs: Proposed rule. Federal Register, 76, 2493–2570.
ElementarySchools.org. (2015). Mississippi elementary schools. Retrieved from http://elementaryschools.org/directory/ms/
Fox, M. K., Gordon, A., Nogales, R., & Wilson, A. (2009). Availability and consumption of competitive foods in US public schools. Journal of the American Dietetic Association, 109(2 Suppl. 1), S57–S66. doi:10.1016/j.jada.2008.10.063
Gonzalez, W., Jones, S. J., & Frongillo, E. A. (2009). Restricting snacks in U.S. elementary schools is associated with higher frequency of fruit and vegetable consumption. The Journal of Nutrition, 139(1), 142–144. doi:10.3945/jn.108.099531
Hanks, A. S., Wansink, B., & Just, D. R. (2014). Reliability and accuracy of real-time
Hoelscher, D. M., Kirk, S., Ritchie, L., Cunningham-Sabo, L., & Academy Positions Committee. (2013). Position of the Academy of Nutrition and Dietetics: Interventions for the
prevention and treatment of pediatric overweight and obesity. Journal of the Academy of Nutrition and Dietetics, 113(10), 1375–1394.doi:10.1016/j.jand.2013.08.004
Kolbo, J. R., Zhang, L., Molaison, E. F., Harbaugh, B. L., Hudson, G. M., Armstrong, M. G., & Werle, N. (2012). Prevalence and trends in overweight and obesity among Mississippi public school students, 2005-2011. Journal of the Mississippi State Medical Association, 53(5), 140–146.
Larson, N., & Story, M. (2010). Are ‘competitivefoods’ sold at school making our children fat? Health Affairs, 29(3), 430–435. doi:10.1377/hlthaff.2009.0716
McWilliams, M. (2012). Foods: Experimental perspectives (7th ed.). Boston, MA: Prentice Hall. Mennella, J. A., Finkbeiner, S., Lipchock, S. V., Hwang, L. -D., & Reed, D. R. (2014).
Preferences for salty and sweet tastes are elevated and related to each other during childhood. PloS One, 9(3), e92201. doi:10.1371/journal.pone.0092201
Mississippi Department of Education. (2014). MS Department of Education Office of Child Nutrition vending regulations for food and beverages. Retrieved from
http://www.mde.k12.ms.us/child-nutrition/resources/vending-regulations
Mississippi Legislature. (2007). Senate Bill 2369 (The Mississippi Healthy Students Act). Retrieved from http://www.mde.k12.ms.us/docs/healthy-schools/senatebill2369.pdf Sijtsema, S. J., Reinders, M. J., Hiller, S. R. C. H., & Guàrdia, M. D. (2012). Fruit and snack
consumption related to sweet, sour and salty taste preferences. British Food Journal, 114(7), 1032–1046. doi:10.1108/00070701211241608
Story, M. (1999). School-based approaches for preventing and treating obesity. International Journal of Obesity, 23(Suppl. 2), S43–S51. doi:10.1038/sj.ijo.0800859
Story, M., Kaphingst, K. M., & French, S. (2006). The role of schools in obesity prevention. The Future of Children, 16(1), 109–142. doi:10.1353/foc.2006.0007
Stunkard, A. (1975). Satiety is a conditioned reflex. Psychosomatic Medicine, 37(5), 383–387. doi:10.1097/00006842-197509000-00001
Szklo, M., & Nieto, F. J. (2007). Epidemiology: Beyond the basics (2nd ed.). Sudbury, MA: Jones and Bartlett.
Templeton, S. B., Marlette, M. A., & Panemangalore, M. (2005). Competitive foods increase the intake of energy and decrease the intake of certain nutrients by adolescents consuming school lunch. Journal of the American Dietetic Association, 105(2), 215–220.
doi:10.1016/j.jada.2004.11.027
United States Department of Agriculture (USDA) Food and Nutrition Service. (2012). New meal pattern requirements and nutrition standards: USDA’s National School Lunch and School Breakfast Programs [PowerPoint slides]. Retrieved from
United States Department of Agriculture (USDA) Food and Nutrition Service. (2013). National School Lunch Program and School Breakfast Program: Nutrition standards for all foods sold in school as required by the Healthy, Hunger-Free Kids Act of 2010. Interim final rule. Federal Register, 78(125), 39068–39120. Retrieved from
http://www.gpo.gov/fdsys/pkg/FR-2013-06-28/pdf/2013-15249.pdf
United States Department of Agriculture (USDA) Food and Nutrition Service. (2015). Healthier school day. Tools for schools: Focusing on smart snacks. Retrieved from
http://www.fns.usda.gov/healthierschoolday/tools-schools-focusing-smart-snacks Wansink, B., Bascoul, G., & Chen, G. T. (2006). The sweet tooth hypothesis: How fruit
consumption relates to snack consumption. Appetite, 47(1), 107–110. doi:10.1016/j.appet.2005.07.011
Janie W. Cole, MS, RD, LD, is director of the coordinated graduate program in Dietetics and Nutrition and an instructor in the Department of Nutrition and Hospitality Management at the University of Mississippi.
Christopher R. Aloia, MPH, is a research consultant and has worked with the Department of Nutrition and Hospitality Management at the University of Mississippi.
Lacy M. Dodd, MS, is a health educator and was a research associate in the Department of Nutrition and Hospitality Management at the University of Mississippi.
Kathy B. Knight, PhD, RD, LD, is an associate professor in the Department of Nutrition and Hospitality Management at the University of Mississippi.
Acknowledgements
The study was funded as a part of Eating Good…and Moving Like We Should, an ongoing school-based nutrition intervention program conducted by the Department of Nutrition and Hospitality Management at the University of Mississippi. Eating Good…and Moving Like We Should was supported by the W.K. Kellogg Foundation under Grant # P3023331.