Abstract
Objective: To assess the availability of food in relation to their degree of industrial processing and the types of food stores in the perimeters of elementary schools.
Method: This is a cross-sectional study. 82 food stores located within a 500 m radius buffer of three public schools located in three distinct regions with different socioeconomic levels in the municipality of Santos, state of São Paulo, Brazil, were assessed. All streets within a 500-meter radius of the schools were covered, geographic coordinates were recorded and information about the stores and food items available were collected by direct observation and interview with store managers. Available food items were classiied in relation to their degree of industrial processing as ultra-processed foods and minimally processed foods. Kernel’s density maps were used to assess the degree of agglomeration of stores near the schools.
Results: The stores that offered mostly ultra-processed foods were signiicantly closer to schools than those who offered mostly minimally processed foods. There was a signiicant difference between the availability of processed food in different types of stores and between the three regions assessed.
Conclusions: The data found by this work evidences that children who attend the three public schools assessed are exposed to an environment that encourages the consumption of ultra-processed foods through easier access of these products in the studied stores.
J Pediatr (Rio J). 2012;88(4):328-34: Nutritional environment, child, processed foods.
O
riginala
rticleCopyright © by Sociedade Brasileira de Pediatria
328
Introduction
Studies have shown that the health and behavior of individuals are inluenced by the physical and social environment they inhabit. Many studies have focused on the characteristics of the neighborhood environment as determinants of socioeconomic differences in individuals’ diet and physical activity.1,2
The prevalence rates of obesity and non-transmissible chronic diseases associated with diet have been rising at an accelerated pace. This epidemiological picture is marked by a contemporary urban environment that leads to an increased intake of energy,3 while physical activity is limited due to, among other factors, the environmental
Availability of processed foods
in the perimeter of public schools in urban areas
Fernanda Helena Marrocos Leite,1 Maria Aparecida de Oliveira,2 Elena de Carvalho Cremm,1
Débora Silva Costa de Abreu,1 Luana Rieffe Maron,3 Paula Andrea Martins4
1. MSc in Sciences. Ciências do Movimento Humano, Instituto Saúde e Sociedade, Universidade Federal de São Paulo (UNIFESP), São Paulo, SP, Brazil. 2. PhD in Public Health. Saúde Ambiental, Faculdade de Saúde Pública, Universidade de São Paulo (USP), São Paulo, SP, Brazil.
3. Specialist in Public Health. Ciências do Movimento Humano, Instituto Saúde e Sociedade, UNIFESP, São Paulo, SP, Brazil. 4. PhD in Sciences. Ciências do Movimento Humano, Instituto Saúde e Sociedade, UNIFESP, São Paulo, SP, Brazil.
No conflicts of interest declared concerning the publication of this article.
Financial support: Fundação de Amparo à Pesquisa do Estado de São Paulo (FAPESP), protocols no. 2009/01393-0 and no. 2009/01361-1.
Suggested citation: Leite FH, de Oliveira MA, Cremm EC, de Abreu DS, Maron LR, Martins PA. Availability of processed foods in the perimeter of public schools in urban areas. J Pediatr (Rio J). 2012;88(4):328-34.
Manuscript submitted Fev 28 2012, accepted for publication May 02 2012.
characteristics of neighborhoods that often have no place (bike lanes, parks and sports courts) where these activities can be performed.4
Moreover, although many studies stress the importance of nutrients and foods in achieving a healthy diet, very little is discussed – in the guidelines, information on nutrition and health and in public policy – about the industrial processing these products undergo.5
Generally, processed foods have a high energy density, an excess of fats (especially saturated fats), sugar and additives (colorants, preservatives) and lack or have a shortage of ibers and micronutrients.6
Taking into account that the consumption of processed foods by the Brazilian population has increased in recent decades, access to adequate nutrition in childhood has become the focus of discussion, since this is strongly conditioned by the purchasing power of households, which depends on the availability, quality and quantity of food consumed.7
In addition to the actions of parents to provide food for their children, the school environment is an especially suitable space for the development of actions to improve the health condition and nutritional status of children.8
However, students are not always faced with an environment conducive to the consumption of nutritional foods that promote a healthy diet. The school food environment has undergone numerous changes in recent years, since there is a large supply of high-fat food – like crackers, snack chips, ice cream and soda – in canteens or in vending machines in schools, prompting many students to not consume the school program meal.9
This study aimed to evaluate the supply of ultra-processed foods (UPF) and minimally processed foods (MPF) at food outlets classiied as food stores, located in the perimeters of three public schools in the municipality of Santos, state of São Paulo, Brazil.
Methods
Study design and sample
This study had a cross-sectional observational design. The data were collected from December, 2008, to October, 2009, in the municipality of Santos. The research focused on characteristics related to food availability and access in areas close to three municipal schools (kindergarten and elementary school), located in three distinct regions of Santos (Regions 1, 2 and 3) and representing different socioeconomic levels. Regions 1 and 2 are located at the Orla (Waterside) and Ponta da Praia areas in Santos and are characterized by higher population density and higher socioeconomic level.10 Region 3 is located in the downtown area and has a lower socioeconomic level.10 Schools were
selected through a lot stratiied by region, proportionally to the population living in the municipality.
The sample was composed of 82 outlets classiied as stores included in the vicinity of assessed schools, comprising 12% of the insular area of the municipality. Every street in the perimeters of the schools was covered, assuming a radius of 500 meters for the delimitation of the area. The geographic coordinates were registered and information about the stores and on foods sold was collected through observation and interview with those responsible for the store.
The study was approved by the Research Ethics Committee of Universidade Federal de São Paulo (CEP n. 2058/08).
Register and characterization of geographic points of interest
The measurement of geographic coordinates was conducted by the ield staff with a Global Positioning System (GPS) unit. All stores located at the perimeter of the schools included in the study were measured. The characterization of these stores was also performed.
The researchers stood at one meter from the store and read the information recorded in the GPS (latitude and longitude). The data were entered into a geographic information system.
Assessment of food stores
The characterization of stores was made from information supplied by those responsible for them and observation, using an instrument validated by the research group.11 The questionnaire was developed with based on the study of the Glanz et al.12 Through this instrument, issues relating to the characteristics of stores were investigated, such as: more frequent public – children (≥ 0 and < 10 years) with or without guardians, adolescents (≥ 10 and ≤ 19 years) with or without guardians, adults (> 19 and < 60 years) and elderly (≥ 60 years)13; physical structure – closed environment (when the space/place where meals are prepared has walls) or in the open air; number of food outlets (two or more stores, one immediately next to each other, with the same ultimate purpose, i.e., serve meals, regardless of type) or isolated; ixed or mobile outlet; and category – butcher, poultry and ishmonger shop; candy store; fresh food stand; food retailing; grocery store/shop; bakery; “sacolão” (a type of bargain grocery store); supermarket; convenience store; mini bomboniere and fresh pasta store.
Classiication of stores and foods available
This study focused on stores classiied as food stores, that is, those that offered food for purchase but not for consumption on site. These comprised supermarkets, butcher shops, bakeries, grocery stores and shops, candy stores, among others.17 All visited stores had as their main activity the sale of food and were open during the day.
The existing foods in these stores were classiied in three groups, according to the degree of industrial processing: UPF, processed foods as ingredients for culinary preparations (PFCP) and MPF.18
The irst group (MPF) was composed of unprocessed foods or foods that underwent minimal industrial processing – mostly physical – in order to make them more available, accessible and safe, such as fresh meats and milk, grains, legumes, oilseeds, fruits and vegetables, roots and tubers, tea, coffee, herbal infusions and bottled waters. In the second group (PFCP) were inserted MPFs characterized by being used as culinary and/or industrial ingredients: oils, fats, lour, pasta, starches and sugars, corn syrup, lactose and soy and milk protein. In the third group (UPF) were included foods produced from various foodstuffs, including foods from group 1 and ingredients from group 2. Foods part of this group were: bread, cereal bar, biscuits, chips, cakes, candies, ice cream and soda, frozen pasta and pizzas, sausages, breaded chicken, ish strips, canned or dehydrated soups, infant formulas and baby foods. In the analysis, second group foods (PFCP) were grouped with MPF, as there were no trades that offered more foods from this group in comparison with the others.
Later, stores were classiied as having greater availability of UPF or greater availability of MPF (MPF + PFCP), according to what types of food were predominantly offered.
Analyses
A descriptive analysis of the stores was conducted, to verify their frequency in the regions, physical structure, categories, more frequent public and food groups offered in the different categories. The analyses of the offer of UPF and MPF in the different categories of stores in the three regions of the municipality of Santos, as well as the analysis of the mean distances of the stores in relation to the schools, were performed using the nonparametric Kruskal-Wallis statistical test. The post-hoc Tukey’s test was performed when there was at least a statistically signiicant difference between the averages of the variables. The analysis of the distance of stores with a smaller or larger predominance of UPFs to the schools was performed by the nonparametric Mann-Whitney test. A signiicance level of 5% was used.
To assess the degree of agglomeration of the stores in the perimeters of schools maps of spatial distribution of points collected by GPS were prepared, using the Kernel density map. In this analysis, the stronger (dark) colors
represent a larger agglomeration of points in relation to the centroid (school) of the buffer.
The database was developed with the software Epi-Info version 3.4 and the statistical analyzes with Statistical Package for Social Sciences version 16. For the modeling of geographic information systems and the spatial analyses, the softwares Terraview 3.1.4 and ArcView 9.2 were used.
Results
The study sample consisted of 82 stores in the vicinity of three public schools (kindergarten and elementary school). These food outlets were present in three regions assessed in the sudy. A higher percentage of stores were in Region 3 (51.2%) – which represents the central region of the municipality – than in other regions (Region 1 = 18.3%, Region 2 = 30.5 %). Regarding the physical properties of the stores, most of them had closed environment (81.7%) and were located at isolated (72%) and ixed points (85.4%). The public most often consisted of adults (78%) and elderly (37.8%), while children with and without guardians and adolescents with and without guardians represented, respectively, 8.5, 13.4, 8.5 and 13.4% of the public. The main categories of stores existing in the three assessed regions were the fresh food stands (30.5%), bakeries (15.9%) and butcher, ishmonger and poultry shops (14.6%). The categories candy store (6.1%), food retailing (9.8%), grocery store/shop (9.8%), supermarkets (6.1%), fresh pasta stores (1.2%), mini bombonieres (0%), convenience stores (2.4%) and “sacolão” (3.7%) were less present in the perimeters.
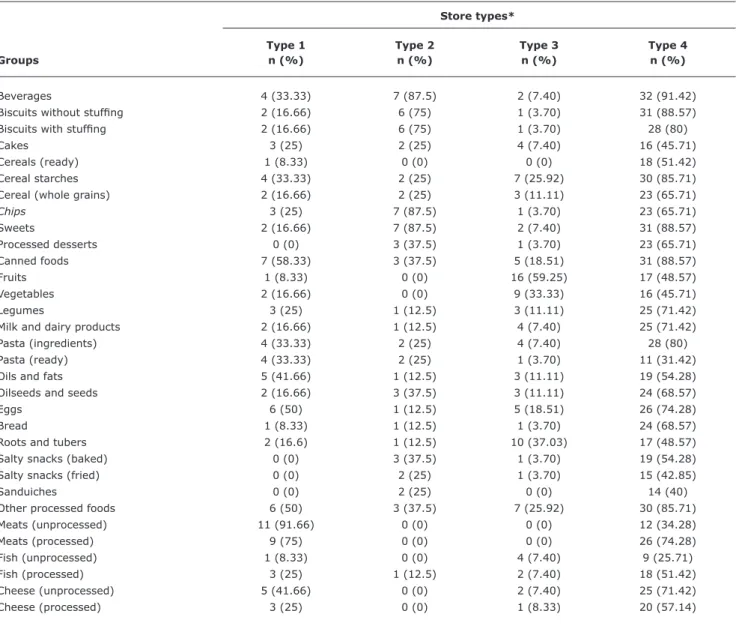
The food groups that made up the questionnaire are distributed in relation to the different types of stores in Table 1. The irst type (butcher, ishmonger and poultry stores) had a higher availability of groups: unprocessed meats, processed meats, canned goods and eggs. As for the type 2 (candy store, fresh pasta store, food retailing, mini bombonieres, convenience stores) offered mostly the groups: beverages, biscuits with or without stufing, chips and sweets. In contrast, the groups most prevalent in the type 3 stores (fresh food stands, “sacolão”) were: fruits, roots and tubers, vegetables, cereal starches, eggs and other foods. Since type 4 groups food retailing, grocery stores/ shops, bakeries and supermarkets, they offered most of the food groups, especially: beverages, biscuits with or without stufing, cereal starches, sweets, canned foods.
In order to assess the degree of processing in the food available in the stores classiied as food stores every UPF and MPF was counted. The aim was to see which group was more present and to assess the availability of food in areas close to schools.
Table 1 - Offer of food groups in the different stores categories (municipality of Santos, Brazil, 2012)
* Type 1: butcher, fishmonger and poultry stores; type 2: candy store, fresh pasta store, food retailing, mini bombonieres, convenience stores; type 3: fresh food stand, “sacolão”; type 4: food retailing, grocery store/shop, bakery, supermarket.
Store types*
Type 1 Type 2 Type 3 Type 4
Groups n (%) n (%) n (%) n (%)
Beverages 4 (33.33) 7 (87.5) 2 (7.40) 32 (91.42)
Biscuits without stufing 2 (16.66) 6 (75) 1 (3.70) 31 (88.57)
Biscuits with stufing 2 (16.66) 6 (75) 1 (3.70) 28 (80)
Cakes 3 (25) 2 (25) 4 (7.40) 16 (45.71)
Cereals (ready) 1 (8.33) 0 (0) 0 (0) 18 (51.42)
Cereal starches 4 (33.33) 2 (25) 7 (25.92) 30 (85.71)
Cereal (whole grains) 2 (16.66) 2 (25) 3 (11.11) 23 (65.71)
Chips 3 (25) 7 (87.5) 1 (3.70) 23 (65.71)
Sweets 2 (16.66) 7 (87.5) 2 (7.40) 31 (88.57)
Processed desserts 0 (0) 3 (37.5) 1 (3.70) 23 (65.71)
Canned foods 7 (58.33) 3 (37.5) 5 (18.51) 31 (88.57)
Fruits 1 (8.33) 0 (0) 16 (59.25) 17 (48.57)
Vegetables 2 (16.66) 0 (0) 9 (33.33) 16 (45.71)
Legumes 3 (25) 1 (12.5) 3 (11.11) 25 (71.42)
Milk and dairy products 2 (16.66) 1 (12.5) 4 (7.40) 25 (71.42)
Pasta (ingredients) 4 (33.33) 2 (25) 4 (7.40) 28 (80)
Pasta (ready) 4 (33.33) 2 (25) 1 (3.70) 11 (31.42)
Oils and fats 5 (41.66) 1 (12.5) 3 (11.11) 19 (54.28)
Oilseeds and seeds 2 (16.66) 3 (37.5) 3 (11.11) 24 (68.57)
Eggs 6 (50) 1 (12.5) 5 (18.51) 26 (74.28)
Bread 1 (8.33) 1 (12.5) 1 (3.70) 24 (68.57)
Roots and tubers 2 (16.6) 1 (12.5) 10 (37.03) 17 (48.57)
Salty snacks (baked) 0 (0) 3 (37.5) 1 (3.70) 19 (54.28)
Salty snacks (fried) 0 (0) 2 (25) 1 (3.70) 15 (42.85)
Sanduiches 0 (0) 2 (25) 0 (0) 14 (40)
Other processed foods 6 (50) 3 (37.5) 7 (25.92) 30 (85.71)
Meats (unprocessed) 11 (91.66) 0 (0) 0 (0) 12 (34.28)
Meats (processed) 9 (75) 0 (0) 0 (0) 26 (74.28)
Fish (unprocessed) 1 (8.33) 0 (0) 4 (7.40) 9 (25.71)
Fish (processed) 3 (25) 1 (12.5) 2 (7.40) 18 (51.42)
Cheese (unprocessed) 5 (41.66) 0 (0) 2 (7.40) 25 (71.42)
Cheese (processed) 3 (25) 0 (0) 1 (8.33) 20 (57.14)
2). Type 3 stores had a larger supply of MPF than type 1 (p < 0.05), 2 (p < 0.001) and 4 (p < 0.001), since these were composed of fresh food stalls and “sacolão”. UPFs were more present in type 4 stores (p < 0.001), i.e., food retailing, grocery stores/shops, bakery and supermarkets, and in all type 2 stores.
In assessing the distribution of food in the three regions of the municipality it was found that region 3, despite having a lower socioeconomic level, showed a signiicantly higher (p < 0.01) availability of MPF in comparison to region 2, that has a higher socioeconomic status. This result was due to the presence of a municipal market which had a large number of fresh food stands. UPFs were found more
frequently (p < 0.01) in region 2. Region 1 also showed a signiicant frequency of UPF (p = 0.052) when compared to MPF.
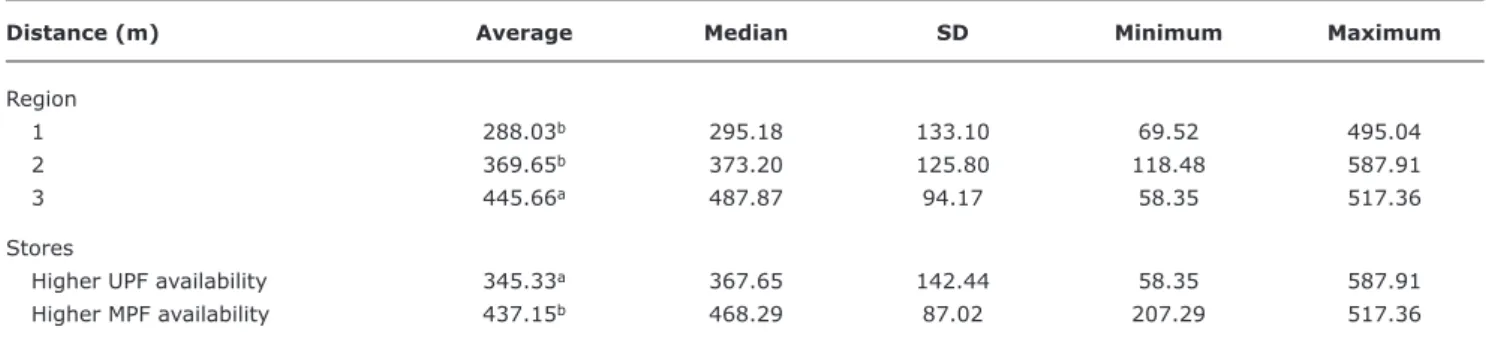
To assess students’ access to food outlets, their distances in relation to the selected schools were measured. Food outlets located in Region 3 were signiicantly more distant from schools than those in region 1 (p < 0.001) and region 2 (p < 0.05) (Table 3). Moreover, outlets which offered mostly UPFs were signiicantly closer to the schools (p < 0.01) than those who offered mostly less processed foods.
Table 2 - Offer of ultra processed foods and minimally processed foods in the different store categories and in the three assessed regions of the municipality of Santos (Santos, Brazil, 2012)
UPF MPF
Variables n (%) n (%) Total (%)
Types of store*
1 4 (33.3) 8 (66.7)a 12 (100)
2 8 (100) 0 (0)b 8 (100)
3 1 (3.7) 26 (96.3)c 27 (100)
4 30 (85.7) 5 (14.3)b d 35 (100)
Regions of Santos
1 10 (66.7) 5a (33.3) 15 (100)
2 19 (76) 6a (24) 25 (100)
3 14 (33.3) 28b (66.7) 42 (100)
Total 43 (52.4) 39 (47.6) 82 (100)
UPF = ultra processed foods; MPF = minimally processed foods.
Different letters represent significant differences (p < 0.001; except type 1 x type 3, p < 0.05).
* Type 1: butcher, fishmonger and poultry stores; type 2: candy store, fresh pasta store, food retailing, mini bombonieres, convenience stores; type 3: fresh food stand, “sacolão”; type 4: food retailing, grocery store/shop, bakery, supermarket.
Table 3 - Analysis of stores distance in relation to the schools in the three regions of the municipality of Santos (Santos, Brazil, 2012)
SD = standard deviation; UPF = ultra processed foods; MPF = minimally processed foods.
Different letters represent significant differences (p < 0.05 for distances between regions and p < 0.01 for distances between stores more or less processed).
Distance (m) Average Median SD Minimum Maximum
Region
1 288.03b 295.18 133.10 69.52 495.04
2 369.65b 373.20 125.80 118.48 587.91
3 445.66a 487.87 94.17 58.35 517.36
Stores
Higher UPF availability 345.33a 367.65 142.44 58.35 587.91
Higher MPF availability 437.15b 468.29 87.02 207.29 517.36
of some degree of inaccuracy in the data collection instrument (Table 3).
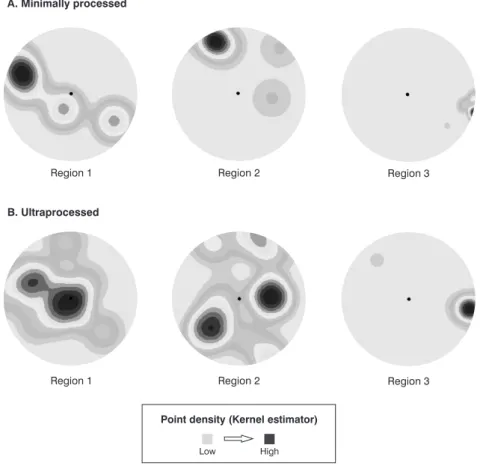
In relation to the intensity of stores around schools located in region 1 and region 3 of the municipality of Santos, it was noticeable that, although the latter has a larger number of stores that offer MPF, these were not much aggregated around the school (Figure 1). In region 1 and region 2, despite the higher aggregation of stores around schools, the degree of agglomeration for the UPF group was higher compared to the minimally processed group.
Discussion
There was a higher number of stores in the central region of the municipality (region 3) of Santos, Brazil, when compared to regions 1 and 2. This fact can be explained by the commercial importance of the region. Although there is a higher supply of MPF in Region 3 due to the presence of a municipal market, it was noticeable that stores that offered mostly MPF were less agglomerated around schools than those that offered mostly UPF. In regions 1 and 2 there was a greater aggregation of stores that offered most of their food classiied as ultra processed closer and around the school.
Although the cost of food is an important barrier to food consumption, the location of stores can prevent individuals from having a healthy nutrition.19 This analysis is consistent with what was observed in the present study, since it was found a different percentage of stores that offered more or less UPF in the three assessed regions.
Most research on childhood obesity has focused on investigating the school environment, assessing the availability of food in canteens and in the meals provided by the school. However, one must consider the students’ exposure to the food environment around schools during periods of arrival and departure, because many children go to school by foot or driving bicycles.20
Figure 1 - Assessment of the agglomeration of stores with a predominance of ultraprocessed and minimally processed foods in the three regions of the municipality of Santos (Santos, Brazil, 2012)
schools, with 78% of schools having at least one such store at a distance of 800 meters.22
Although the majority of stores in this study have a ixed physical structure, approximately 15% of the assessed stores were mobile. A study that assessed the number of such stores around primary and secondary schools in Oakland showed the presence of about ive vendors (mobile food stores) around each school, which offered foods like ice cream, fruit and vegetables, scratch, tacos, hot dogs, churros and roasted corn.20 Researching type of outlet is important, since they typically are very close to schools and offer mostly high energy density foods low in nutrients.
A study of the vicinity of 10 schools in Philadelphia assessed the contribution of corner shop purchases in energy intake among children from the 4th to 6th grade. The results showed that children who participated in the study
acquired an average of 356 kcal per purchase, reaching 712 kcal/day and 3,560 kcal/week for children who bought items in these shops twice daily for 5 days a week. The most popular foods were low cost ones, with high energy density and low nutrition value.23
References
1. Winkler E, Turrell G, Patterson C. Does living in a disadvantaged area entail limited opportunities to purchase fresh fruit and vegetables in terms of price, availability, and variety? Findings from the Brisbane Food Study. Health Place. 2006;12:741-8. 2. Timperio A, Crawford D, Telford A, Salmon J. Perceptions about
the local neighborhood and walking and cycling among children.
Prev Med. 2004;38:39-47.
3. Claro RM, Machado FM, Bandoni DH. Evolução da disponibilidade domiciliar de alimentos no município de São Paulo no período de 1979 a 1999. Rev Nutr. 2007;20:483-90.
4. Moore LV, Diez Roux AV, Evenson KR, McGinn AP, Brines SJ.
Availability of recreational resources in minority and low socioeconomic status areas. Am J Prev Med. 2008;34:16-22. 5. Monteiro CA. Nutrition and health. The issue is not food,
nor nutrients, so much as processing. Public Health Nutr. 2009;12:729-31.
6. World Health Organization (WHO). Diet, nutrition and the prevention of chronic diseases. Report of a Joint WHO/FAO Expert Consultation. Geneva: World Health Organization; 2003. 7. de Aquino R de C, Philippi ST. Association of children’s consumption
of processed foods and family income in the city of São Paulo, Brazil. Rev Saude Publica. 2002;36:655-60.
8. Schmitz B de A, Recine E, Cardoso GT, da Silva JR, Amorim NF, Bernardon R, et al. Promotion of healthy eating habits by schools: a methodological proposal for training courses for educators and school cafeteria owners. Cad Saude Publica. 2008;24:S312-22.
9. French SA, Story M, Fulkerson JA. School food policies and practices: a state-wide survey of secondary school principals. J Am Diet Assoc. 2002;102:1785-9.
10. Instituto Brasileiro de Geograia e Estatística (IBGE). Pesquisa nacional por amostra de domicílios 2007. http://www.ibge.gov. br. Access: 03/11/2011.
11. Martins PA, Cremm EC, Leite FH, Maron LR, Oliveira MA, Scagliusi FB. Development of a Brazilian food environment assessment tool. J Nutr Educ Behav. 2012, submitted.
12. Glanz K, Sallis JF, Saelens BE, Frank LD. Nutrition Environment Measures Survey in stores (NEMS-S): development and evaluation.
Am J Prev Med. 2007;32:282-9.
13. World Health Organization (WHO). Physical status: use and interpretation of anthropometry. Genova: World Health Organization; 1995.
14. Willett W, Skerrett PJ, Giovannucci EL, Callahan M. Eat, drink, and be healthy: the Harvard Medical School guide to healthy eating. New York: Simon & Schuster Source; 2001.
15. Monteiro CA. The big issue is ultra-processing. World Nutrition. 2010;1:237-59.
16. Monteiro CA, Levy RB, Claro RM, de Castro IR, Cannon G. Increasing consumption of ultra-processed foods and likely impact on human health: evidence from Brazil. Public Health Nutr. 2011;14:5-13. 17. Glanz K, Sallis JF, Saelens BE, Frank LD. Healthy nutrition
environments: concepts and measures.Am J Health Promot. 2005;19:330-3.
18. Monteiro CA, Levy RB, Claro RM, Castro IR, Cannon G. A new classiication of foods based on the extent and purpose of their processing. Cad Saude Publica. 2010;26:2039-49.
19. Morland K, Wing S, Diez Roux A, Poole C. Neighborhood characteristics associated with the location of food stores and food service places. Am J Prev Med. 2002;22:23-9.
20. Tester JM, Yen IH, Laraia B. Mobile food vending and the after-school food environment. Am J Prev Med. 2010;38:70-3. 21. Lucan SC, Karpyn A, Sherman S. Storing empty calories and
chronic disease risk: snack-food products, nutritive content, and manufacturers in Philadelphia corner stores. J Urban Health. 2010;87:394-409.
22. Austin SB, Melly SJ, Sanchez BN, Patel A, Buka S, Gortmaker SL. Clustering of fast-food restaurants around schools: a novel application of spatial statistics to the study of food environments.
Am J Public Health. 2005;95:1575-81.
23. Borradaile KE, Sherman S, Vander Veur SS, McCoy T, Sandoval B, Nachmani J, et al. Snacking in children: the role of urban corner stores. Pediatrics. 2009;124:1293-8.
Correspondence: Paula Andrea Martins Av. Ana Costa, 95
CEP 11060-001 - Santos, SP - Brazil Tel.: +55 (13) 3787.3700, ramal 3796 E-mail: [email protected] The data in this study show that children who attend the
three assessed public schools are exposed to an environment that encourages the consumption of highly processed foods through easier access in the investigated stores.
This shows the importance of developing interventions targeted directly to children through nutrition education in schools, of encouraging store owners to offer healthier food items, and of government policies that promote the location of stores that offer healthier foods in the vicinity of schools.
Acknowledgements