Impact of ultra-processed
foods on micronutrient
content in the Brazilian diet
I Programa de Pós-Graduação em Nutrição em Saúde Pública. Faculdade de Saúde Pública. Universidade de São Paulo. São Paulo, SP, Brasil
II Núcleo de Pesquisas Epidemiológicas em Nutrição e Saúde. Universidade de São Paulo. São Paulo, SP, Brasil
III Departamento de Nutrição Aplicada. Instituto de Nutrição. Universidade do Estado do Rio de Janeiro. Rio de Janeiro, RJ, Brasil IV Departamento de Medicina Preventiva.
Faculdade de Medicina. Universidade de São Paulo. São Paulo, SP, Brasil V Departamento de Nutrição. Universidade
Federal de Minas Gerais. Belo Horizonte, MG, Brasil
VI Departamento de Nutrição. Faculdade de Saúde Pública. Universidade de São Paulo. São Paulo, SP, Brasil
Correspondence:
Carlos Augusto Monteiro
Departamento de Nutrição – FSP/USP Av. Dr. Arnaldo, 715 2º andar 01246-903 São Paulo, SP, Brasil E-mail: [email protected] Received: 2/22/2015 Approved: 4/24/2015
ABSTRACT
OBJECTIVE: To evaluate the impact of consuming ultra-processed foods on the micronutrient content of the Brazilian population’s diet.
METHODS: This cross-sectional study was performed using data on individual food consumption from a module of the 2008-2009 Brazilian Household Budget Survey. A representative sample of the Brazilian population aged 10 years or over was assessed (n = 32,898). Food consumption data were collected through two 24-hour food records. Linear regression models were used to assess the association between the nutrient content of the diet and the quintiles of ultra-processed food consumption – crude and adjusted for family income per capita.
RESULTS: Mean daily energy intake per capita was 1,866 kcal, with 69.5% coming from natural or minimally processed foods, 9.0% from processed foods and 21.5% from ultra-processed foods. For sixteen out of the seventeen evaluated micronutrients, their content was lower in the fraction of the diet composed of ultra-processed foods compared with the fraction of the diet composed of natural or minimally processed foods. The content of 10 micronutrients in ultra-processed foods did not reach half the content level observed in the natural or minimally processed foods. The
higher consumption of ultra-processed foods was inversely and signiicantly
associated with the content of vitamins B12, vitamin D, vitamin E, niacin, pyridoxine, copper, iron, phosphorus, magnesium, selenium and zinc. The
reverse situation was only observed for calcium, thiamin and ribolavin. CONCLUSIONS: The indings of this study highlight that reducing the
consumption of ultra-processed foods is a natural way to promote healthy eating in Brazil and, therefore, is in line with the recommendations made by the Guia Alimentar para a População Brasileira (Dietary Guidelines for the Brazilian Population) to avoid these foods.
DESCRIPTORS: Industrialized Foods. Food Composition. Micronutrients. Food Quality. Food Consumption.
Maria Laura da Costa LouzadaI,II
Ana Paula Bortoletto MartinsII
Daniela Silva CanellaII,III
Larissa Galastri BaraldiI,II
Renata Bertazzi LevyII,IV
Rafael Moreira ClaroII,V
Jean-Claude MoubaracII
Geoffrey CannonII
Micronutrient deiciencies are among the 20 most
important risk factors for diseases and affect around two billion people worldwide.14 At least half the world’s population of children aged between six months and
ive years, most of whom live in developing countries, suffer from one or more micronutrient deiciencies.29
Although micronutrient deiciencies can be caused by factors that are unrelated to diet, such as iron deiciency
caused by intestinal parasites, they are mainly caused
by insuficient quantities of micronutrients in the diet.26 Studies based on a food consumption survey that were performed between 2008 and 2009, using a represen-tative sample of the Brazilian adolescent, adult and elderly population, documented a high prevalence of dietary inadequacy in several vitamins and minerals.1,5,30 Regional studies that were restricted to children also indicate inadequate micronutrient intake in Brazil.2,6,27
Based on a food consumption survey from 2008-2009, this study’s authors evaluated the impact of consuming ultra-processed foods18,19,21-23 on nutritional indica-tors of diet associated with chronic noncommunicable diseases.15 The consumption of ultra-processed foods proved to be directly linked to the energy density of the diet and the content of saturated fats, trans fats and
free sugar, and proved to be inversely associated to iber
and protein content, thereby demonstrating the poten-tial harmful characteristics of these foods related to increasing the risk of obesity, diabetes, cardiovascular disease and some types of cancer. This study’s objec-tive was to evaluate the impact of ultra-processed foods on the micronutrient content of food consumed by the Brazilian population.
METHODS
The data analyzed in this study was taken from the individual food consumption module of the Brazilian Household Budget Survey (HBS), which was performed by the Brazilian Institute of Geography and Statistics
(IBGE) between May 2008 and May 2009.10
This module from the HBS was applied to all residents aged 10 years or over, from a probabilistic sample of 13,569 households, totaling 34,003 individuals. The sample of households was randomly selected using a conglomerates plan with a census sector draw in the
irst stage, and households, in the second. The census tracts were grouped prior to the draw in strata with sufi -cient geographical and socioeconomic homogeneity. The households drawn in each stratum were uniformly distributed for study over the four quarters in the year.9
The 2008-2009 HBS obtained data on each individu-al’s food consumption with two 24-hour food records.
INTRODUCTION
The individuals were asked to record all the food and beverages that they consumed during a 24-hour period over two nonconsecutive days, the objective of which was to show the quantities consumed using homemade measurements as well as the preparation method. The quantity of each food or drink was converted into grams or milliliters using a measurement table that refers to food consumed in Brazil.11 These amounts were subse-quently converted into kilocalories of energy and into grams or milligrams of nutrients based on the Table of Nutritional Composition of Food Consumed in Brazil.12
The 1,120 food items listed in the 2008-2009 HBS data-base were divided into three main groups according to the industrial processing characteristics to which the items were submitted: natural or minimally processed (including culinary preparations based on these foods), processed foods and ultra-processed foods.18,19,21-23
Natural or minimally processed foods include: foods obtained directly from plants or animals (like leaves, fruit, eggs and milk) and acquired for consumption without having undergone any alteration following their harvest; and foods that, prior to their acquisition, were cleaned, had their inedible or unwanted parts removed, been subjected to drying, packing,
pasteur-ization, freezing, reinement, fermentation as well as
other processes that do not include adding substances to the original food. Included in this food group are culi-nary preparations that contain one or more natural or minimally processed foods, these may include the food that is used as the main recipe item and other ingre-dients, including any other foods or food substances used in the culinary process such as salt, sugar, vinegar and oils.18,19,21-23
Processed foods are manufactured products that are primarily made by adding salt or sugar (and eventually oil, vinegar or other culinary substances) to an natural or minimally processed food.18,19,21-23
Ultra-processed foods are industrial formulations that are entirely or predominantly made from substances that are extracted from food (oils, fats, sugar, proteins), and these are derived from food constituents
(hydro-genated fats, modiied starch) or synthesized in a labo
-ratory from organic materials (colorants, lavorings, lavor enhancers and various additives that are used to
give the products desirable sensory properties).18,19,21-23 A detailed list of foods from each of the three groups can be found in a previous publication.15
nutrient consumption was estimated based on the mean values obtained during the two days.
The micronutrients evaluated were vitamins A, B12,
C, D and E, niacin, pyridoxine, ribolavin and thia -mine, and the minerals assessed were calcium, copper, iron, phosphorus, magnesium, manganese, selenium and zinc. The content of each nutrient in the diet was expressed in mg or μg per 1,000 kcal.
Firstly, the mean content of each micronutrient in the total diet of the Brazilian population was estimated. The mean content of each nutrient in the fraction of the diet composed only by ultra-processed foods was compared to the fraction of the diet that was restricted to natural or minimally processed foods and with the fraction
restricted to processed foods. The statistical signii -cance of the differences found during the comparisons was evaluated with the Student’s t-test.
The individuals were classified into five strata in accordance with their consumption of ultra-processed foods. These strata corresponded to quintiles of the population distribution according to the contribution of ultra-processed foods to the total caloric value of the diet. The micronutrient content of the diet in these strata was subsequently evaluated. Linear regression analyses were used to describe the trend and the
statis-tical signiicance of the association between the quin -tiles of relative ultra-processed food consumption and micronutrient content of the diet, with and without adjustment for monthly household income per capita. The household location (urban or rural), region of the country (Midwest, North, Northeast, Southeast and South), age and gender characteristics did not alter the regression model estimates and therefore were not included in the analyses.
The statistical analyses performed in this study were done using Stata version 13.0 software, considering the complex sample design of the 2008-2009 HBS and its weighting factors. This study was approved by the Committee of Ethics in Research at the Faculdade de Saúde Pública of the Universidade de São Paulo (Protocol 128,958, 10/19/2012).
RESULTS
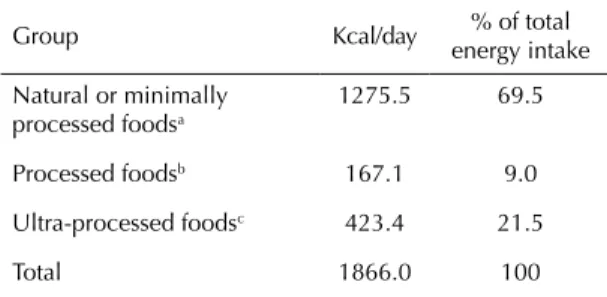
The mean daily energy consumption by Brazilians was 1,866 kcal, of which 69.5% was natural or minimally processed foods, 9.0% processed foods and 21.5% ultra-processed foods (Table 1).
Table 2 shows the micronutrient content in the Brazilian diet and in the fractions of this diet referring to natural or minimally processed foods, processed foods and ultra-processed foods, respectively.
For 16 of the 17 micronutrients studied, the content of such found in the fraction referring to the ultra-processed foods was below the level found in the fraction referring to the natural or minimally processed foods. Contents of vitamin B12, vitamin C, vitamin D, vitamin E, niacin, pyridoxine, copper, magnesium, manganese and zinc found in the ultra-processed foods were at least two times lower than the contents found in the natural or minimally processed foods. The observed differences for vitamin B12, vitamin C and magnesium were particularly evident, whose contents
were respectively four, ive and 13 times lower in the
ultra-processed foods. For vitamin A, iron and phos-phorus, the content found in ultra-processed foods represented between 70.0% and 60.0% of that found in the natural or minimally processed foods. Less intense disadvantages for ultra-processed foods were found for
ribolavin, calcium and selenium content. Thiamine
was the only micronutrient whose content in the frac-tion of ultra-processed foods exceeded that found in the fraction of natural or minimally processed foods, albeit only to a slight extent.
Less striking contrasts concerning micronutrient content are evident when comparing ultra-processed and processed food. In general terms, this compar-ison also tends to put ultra-processed foods at a detri-ment, as is the case with the contents of vitamin B12,
pyridoxine, ribolavin, thiamin, calcium, phosphorus,
magnesium, manganese, and zinc. This comparison is detrimental for processed foods in the case of vitamin A, vitamin C, vitamin D, vitamin E, and niacin. The processed foods and ultra-processed foods had similar levels of copper, iron, and selenium.
Table 1. Means for the absolute and relative consumption of natural or minimally processed foods, processed foods and ultra-processed foods in the Brazilian population aged 10 years or over (2008-2009).
Group Kcal/day % of total energy intake
Natural or minimally processed foodsa
1275.5 69.5
Processed foodsb 167.1 9.0
Ultra-processed foodsc 423.4 21.5
Total 1866.0 100
a Includes rice and other cereals, beans and other legumes, meats, and poultry, fruits, roots and tubers, milk, coffee and tea, fish and other seafood, vegetables, eggs, nuts and other seeds.
b Includes “French bread” (bread rolls), cheeses, canned vegetables, and dried and salted meats.
Table 3 describes the crude analyses of the associa-tion between the quintiles of relative consumpassocia-tion of ultra-processed foods and micronutrient content in the diet. The mean contribution of ultra-processed foods to the total caloric intake ranged from 1.8% in the lower quintile, to 49.2%, in the upper quintile. There was a
signiicant and negative association between relative
consumption of ultra-processed foods and micronutrient content in the diet for 11 of the 17 micronutrients studied, namely: vitamin B12, vitamin D, vitamin E, niacin, pyri-doxine, copper, iron, phosphorus, magnesium, selenium, and zinc. Three micronutrients – vitamin A, vitamin C
and manganese – showed no signiicant association
between the consumption of ultra-processed foods and
the nutrient content in the diet. A signiicant decrease in
micronutrient content in the diet along with the increase in ultra-processed food consumption was found only for
calcium, thiamine and Ribolavin, although with very
small magnitude in the last two cases.
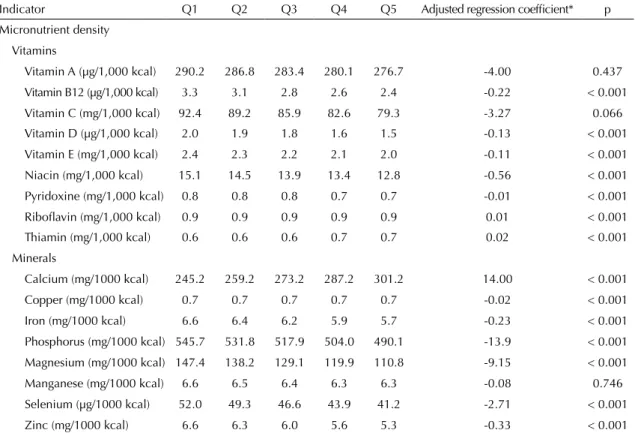
Table 4 describes the analyses of the association between relative consumption of ultra-processed foods and micro-nutrient content in the diet that have been adjusted for household income per capita. The adjustment for income does not substantially alter the results of this association. The only highlights are the decrease in the magnitude
of the positive association between relative consump-tion of ultra-processed foods and calcium content in the diet, and the negative association between the relative consumption of these foods and the content of vitamin C
in the diet, which is close to being statistically signiicant.
DISCUSSION
The results from this study, which are representative of the Brazilian diet, show that the micronutrient content in ultra-processed foods tends to be lower than this content that exists in other foods. The inferiority of ultra-processed foods is even more evident when they
are compared with naturalor minimally processed
foods. For 16 of the 17 micronutrients under study, the mean content found in the set of ultra-processed foods consumed by Brazilians was lower than the mean content found in the natural or minimally processed foods. The content of 10 micronutrients (vitamin B12, C, D, E, niacin, pyridoxine, copper, magnesium, manga-nese, and zinc) that are present in the ultra-processed foods was not even half the content observed in the natural or minimally processed foods. Crude and adjusted for family income analysis indicate that the content of the diet in 11 of the 17 micronutrients under
study decreased signiicantly with the increase in the
Table 2. Mean micronutrient content in total food consumption and in fractions of this consumption relating to natural or minimally processed foods, processed foods and ultra-processed foods. Brazilian population aged 10 years or over (2008-2009).
Micronutrient Total food consumption
Food consumption fraction Natural or minimally
processed foods
Processed foods
Ultra-processed foods Vitamins
Vitamin A (µg/1,000 kcal) 286.7 340.5 118.7 239.1*
Vitamin B12 (µg/1,000 kcal) 2.8 3.5 1.2 1.0*
Vitamin C (mg/1,000 kcal) 87.4 121.2 1.9 23.8*
Vitamin D (µg/1,000 kcal) 1.7 2.1 0.6 0.9*
Vitamin E (mg/1,000 kcal) 2.2 2.7 0.4 1.4*
Niacin (mg/1,000 kcal) 14.1 17.1 4.7 7.3*
Pyridoxine (mg/1,000 kcal) 0.8 0.8 1.6 0.4*
Riboflavin (mg/1,000 kcal) 0.9 0.8 1.9 0.7*
Thiamin (mg/1,000 kcal) 0.6 0.5 1.1 0.7*
Minerals
Calcium (mg/1,000 kcal) 278.7 265.8 312.3 243.1*
Copper (mg/1,000 kcal) 0.7 0.9 0.4 0.4*
Iron (mg/1,000 kcal) 6.2 7.0 3.5 4.1*
Phosphorus (mg/1,000 kcal) 522.4 548.6 578.4 356.3*
Magnesium (mg/1,000 kcal) 129.2 150.2 91.9 66.4*
Manganese (mg/1,000 kcal) 6.5 9.6 1.3 0.7*
Selenium (µg/1,000 kcal) 46.6 28.6 18.9 24.6*
Zinc (mg/1,000 kcal) 6.0 7.0 4.3 3.0*
relative consumption of ultra-processed foods. There was only an inverse situation found for three
micro-nutrients: calcium, thiamine and ribolavin, with the association found in the case of thiamin and ribolavin
being of very small magnitude.
The positive association between the relative consumption of ultra-processed foods and the calcium content in the diet was unexpected, since the content of this mineral in these foods is smaller than in natural or minimally processed foods. Detailed analyses (not shown in this article) of the variation in the composition of ultra-processed items in the diets according to the quintiles of the relative
consumption of those foods show a signiicant increase in
ultra-processed items that are particularly rich in calcium, such as ready and semi-ready-to-eat meals, fast foods (all often containing cheese in their ingredients) and dairy drinks with added sugar.
Despite the lack of other studies that evaluated the asso-ciation between consumption of ultra-processed foods and micronutrient content in the diet, evidence that their consumption could dilute the concentration of micro-nutrients in the diet was documented by studies that focused on soft drink4,16,32 or fast-food consumption.24
The negative impact of ultra-processed foods on micro-nutrient content in the diet, as was observed during this
study, is of great importance when the critical roles that vitamins and minerals play in cell signaling are considered, as they are critical for hormone production, immune responses and the development and mainte-nance of the vital functions.31 Although micronutrient
deiciency does not always manifest itself clinically, subclinical deiciencies can be harmful to health.31
Deiciencies in iron, zinc, and vitamin A, nutrients that
are present in smaller quantities in ultra-processed foods when compared to natural or minimally processed foods, are among the nutritional problems of greatest magni-tude in the world, affecting mainly children, pregnant women, and populations in developing countries.14 The consequences of these are extremely relevant to public health, they include stunted growth and development of children and increased fetal and maternal mortality.14
Iron, zinc, and vitamin A, as well as vitamin B12,
vitamin C, ribolavin and selenium act as immuno
-modulators that inluence infectious disease suscep -tibility and the severity of their effects.7,31 Suficient intake of vitamin D, calcium, magnesium and phos-phorus is in turn important for bone mass develop-ment and maintenance,25 while the vitamins of the B
complex (thiamine, ribolavin, niacin and pyridoxine)
are involved in maintaining cognitive function.8
Table 3. Mean micronutrient content in the diet according to quintiles of ultra-processed food contribution to the total energy consumption. Brazilian population aged 10 years or over (2008-2009).
Micronutrient Quintiles of ultra-processed food consumption Crude regression coefficient* p
Q1 Q2 Q3 Q4 Q5
Vitaminas
Vitamin A (µg/1,000 kcal) 254.6 290.5 339.3 300.0 249.3 -0.12 0.974 Vitamin B12 (µg/1,000 kcal) 3.2 3.0 3.1 2.7 2.2 -0.23 < 0.001 Vitamin C (mg/1,000 kcal) 74.1 98.5 106.2 87.6 71.0 -1.71 0.147 Vitamin D (µg/1,000 kcal) 2.1 1.9 1.7 1.6 1.5 -0.14 < 0.001
Vitamin E (mg/1,000 kcal) 2.4 2.3 2.3 2.1 1.9 -0.10 < 0.001 Niacin (mg/1,000 kcal) 14.7 14.6 14.3 13.9 13.1 -0.41 < 0.001 Pyridoxine (mg/1,000 kcal) 0.8 0.8 0.8 0.8 0.7 -0.02 < 0.001 Riboflavin (mg/1,000 kcal) 0.8 0.9 0.9 0.9 0.9 0.01 < 0.001 Thiamin (mg/1,000 kcal) 0.6 0.6 0.6 0.6 0.7 0.03 < 0.001
Minerals
Calcium (mg/1,000 kcal) 248.9 254.5 271.0 291.5 327.9 19.50 < 0.001 Copper (mg/1,000 kcal) 0.7 0.7 0.8 0.7 0.6 -0.03 < 0.001 Iron (mg/1,000 kcal) 6.7 6.3 6.2 6.0 5.7 -0.22 < 0.001
Phosphorus (mg/1,000 kcal) 543.9 528.7 522.2 512.5 504.7 -9.47 < 0.001 Magnesium (mg/1,000 kcal) 147.2 136.8 130.8 121.5 109.7 -9.02 < 0.001 Manganese (mg/1,000 kcal) 6.2 6.3 7.0 7.3 5.9 0.02 0.913 Selenium (µg/1,000 kcal) 52.4 49.0 46.3 43.9 41.7 -2.66 < 0.001
Lastly, micronutrients with antioxidant functions such as vitamins C and E and minerals selenium and zinc have key roles in the etiology and prognosis of chronic diseases.3,13
Documenting the negative effects, which result from consuming ultra-processed foods, on micronutrient content in the diet becomes even more important because of the rapidly increasing sales of these foods in Brazil and, more generally, in middle income coun-tries.20,28 Household food budget surveys performed in Brazilian metropolitan areas from 1987 to1988 and 2008 to 2009 confirm that consumption of ultra-processed foods is increasing and consumption of natural or minimally processed foods and culinary ingredients such as oils, fats and sugar is decreasing.17
The strong aspects of this study were the rigorously probabilistic nature of the studied sample, the fact that more than 30,000 people residing in urban and rural areas from all regions of the country were included in the study and that there were two 24-hour food consumption recording periods in 96.8% of those studied in the individual consumption module of the HBS. The limitations of this study include inaccura-cies when quantifying the consumption of foods and nutrients that are inherent to food records and food
composition tables. To minimize these inaccuracies, we have employed various quality control procedures
and food composition tables that had been specii -cally built for this research.10 In addition, the survey
performed in 2008-200910 did not include people
younger than 10 years of age, which means that its results are not necessarily applicable to the diet of infants and preschoolers.
The results relating to the adverse impact from consuming ultra-processed foods on micronutrient content in the diet, in addition to the results docu-menting the equally unfavorable impact related to macronutrient content – increase in energy density and content of saturated fats, trans fats and free sugar,
and decrease in iber and protein content15 – show that reducing ultra-processed food consumption is a natural way to promote healthy eating in Brazil.
Moreover, our study, while also considering the study on the macronutrient content in the Brazilian diet,15 support the recommendations set out in the new edition of the Dietary Guidelines for the Brazilian Population,
particularly the recommendation for basing the diet on natural or minimally processed foods, moderating the consumption of processed foods and avoiding ultra-processed foods.18
Table 4. Micronutrient content in the diet according to quintiles of ultra-processed food contributionto the total energy consumption, adjusted for household income per capita. Brazilian population aged 10 years or over (2008-2009).
Indicator Q1 Q2 Q3 Q4 Q5 Adjusted regression coefficient* p Micronutrient density
Vitamins
Vitamin A (µg/1,000 kcal) 290.2 286.8 283.4 280.1 276.7 -4.00 0.437
Vitamin B12 (µg/1,000 kcal) 3.3 3.1 2.8 2.6 2.4 -0.22 < 0.001
Vitamin C (mg/1,000 kcal) 92.4 89.2 85.9 82.6 79.3 -3.27 0.066 Vitamin D (µg/1,000 kcal) 2.0 1.9 1.8 1.6 1.5 -0.13 < 0.001
Vitamin E (mg/1,000 kcal) 2.4 2.3 2.2 2.1 2.0 -0.11 < 0.001
Niacin (mg/1,000 kcal) 15.1 14.5 13.9 13.4 12.8 -0.56 < 0.001
Pyridoxine (mg/1,000 kcal) 0.8 0.8 0.8 0.7 0.7 -0.01 < 0.001
Riboflavin (mg/1,000 kcal) 0.9 0.9 0.9 0.9 0.9 0.01 < 0.001 Thiamin (mg/1,000 kcal) 0.6 0.6 0.6 0.7 0.7 0.02 < 0.001
Minerals
Calcium (mg/1000 kcal) 245.2 259.2 273.2 287.2 301.2 14.00 < 0.001 Copper (mg/1000 kcal) 0.7 0.7 0.7 0.7 0.7 -0.02 < 0.001
Iron (mg/1000 kcal) 6.6 6.4 6.2 5.9 5.7 -0.23 < 0.001
Phosphorus (mg/1000 kcal) 545.7 531.8 517.9 504.0 490.1 -13.9 < 0.001
Magnesium (mg/1000 kcal) 147.4 138.2 129.1 119.9 110.8 -9.15 < 0.001
Manganese (mg/1000 kcal) 6.6 6.5 6.4 6.3 6.3 -0.08 0.746
Selenium (µg/1000 kcal) 52.0 49.3 46.6 43.9 41.2 -2.71 < 0.001
1. Araujo, MC, Bezerra IN, Barbosa FS, Junger WL, Yokoo EM, Pereira RA, et al. Macronutrient consumption and inadequate micronutrient intake in adults. Rev Saude Publica. 2013;47(Suppl 1):177-89. DOI: 10.1590/S0034-89102013000200004
2. Bueno MB, Fisberg RM, Maximino P, Rodrigues GP, Fisberg M. Nutritional risk among Brazilian children 2 to 6 years old: a multicenter study. Nutrition. 2013;29(2):405-10. DOI:10.1016/j.nut.2012.06.012
3. Cherubini A, Vigna GB, Zuliani G, Ruggiero C, Senin U, Fellin R. Role of antioxidants in atherosclerosis: epidemiological and clinical update. Curr Pharm Des. 2005;11(16):2017-32. DOI:10.2174/1381612054065783
4. Fiorito LM, Marini M, Mitchell DC, Smiciklas-Wright H, Birch LL. Girls’ early sweetened carbonated beverage intake predicts different patterns of beverage and nutrient intake across childhood and adolescence. J Am Diet Assoc. 2010;110(4):543-50. DOI:10.1016/j.jada.2009.12.027
5. Fisberg RM, Marchioni DM, Castro MA, Verly Junior E, Araújo MC, Bezerra IN et al. Inadequate nutrient intake among the Brazilian elderly: National Dietary Survey 2008-2009. Rev Saude Publica. 2013;47, Suppl 1:222s-30s. DOI:10.1590/S0034-89102013000700008
6. Garcia MT, Granado FS, Cardoso MA. Complementary feeding and nutritional status of 6-24-month-old children in Acrelandia, Acre State, Western Brazilian Amazon. Cad Saude Publica. 2011;27(2):305-16. DOI:10.1590/S0102-311X2011000200012
7. Guerrant RL1, Lima AA, Davidson F. Micronutrients and infection: interactions and implications with enteric and other infections and future priorities. J Infect Dis. 2000;182(Suppl 1):S134-8. DOI:10.1086/315924
8. Huskisson E, Maggini S, Ruf M. The influence of micronutrients on cognitive function and performance. J Inter Med Res. 2007;35(1):1-19. DOI:10.1177/147323000703500101
9. Instituto Brasileiro de Geografia e Estatística. Pesquisa de orçamentos familiares 2008-2009: avaliação nutricional da disponibilidade de alimentos no Brasil. Rio de Janeiro; 2010.
10. Instituto Brasileiro de Geografia e Estatística. Pesquisa de orçamentos familiares 2008-2009: análise do consumo alimentar pessoal no Brasil. Rio de Janeiro; 2011.
11. Instituto Brasileiro de Geografia e Estatística. Pesquisa de orçamentos familiares 2008-2009: tabela de medidas referidas para os alimentos consumidos no Brasil. Rio de Janeiro; 2011.
12. Instituto Brasileiro de Geografia e Estatística. Pesquisa de orçamentos familiares 2008-2009: tabelas de composição nutricional dos alimentos consumidos no Brasil. Rio de Janeiro; 2011.
13. Kaliora AC, Dedoussis GV, Schmidt H. Dietary antioxidants in preventing atherogenesis. Atherosclerosis. 2006;187(1):1-17. DOI:10.1016/j.atherosclerosis.2005.11.001
14. Lopez AD, Mathers CD, Ezzati M, Jamison DT, Murray CJL, editors. Global burden of disease and risk factors. Washington (DC): World Bank; 2006.
15. Louzada MLC, Martins APB, Canella DS, Baraldi LG, Levy RB, Claro M et al. Alimentos ultraprocessados e perfil nutricional da dieta no Brasil. Rev Saude Publica. 2015;49:38. DOI:10.1590/S0034-8910.2015049006132
16. Lyons J, Walton J1, Flynn A1. Food portion sizes and dietary quality in Irish children and adolescents. Public Health Nutr. 2015;18(8):1444-52.
DOI:10.1017/S1368980014001979. Epub 2014 Sep 16.
17. Martins APB, Levy RB, Claro RM, Moubarac J-C, Monteiro CA. Increased contribution of ultra-processed food products in the Brazilian diet (1987-2009). Rev Saude Publica. 2013;47(4):656-65. DOI:10.1590/S0034-8910.2013047004968
18. Ministério da Saúde. Guia alimentar para a população brasileira. 2a. ed. Brasília (DF); 2014.
19. Monteiro CA. Nutrition and health. The issue is not food, nor nutrients, so much as processing. Public Health Nutr. 2009;12(5):729-31. DOI:10.1017/S1368980009005291
20. Monteiro CA, Moubarac J-C, Cannon G, Ng SW, Popkin B. Ultra-processed products are becoming dominant in the global food system. Obes Rev. 2013;14(Suppl 2):21-28. DOI:10.1111/obr.12107
21. Monteiro CA, Cannon G, Levy RB, Claro RM, Moubarac J-C. Ultra-processing and a new
classification of foods. In: Neff R, editor. Introduction to U.S. Food System: public health, environment, and equity. San Francisco: Jossey Bass; 2015.
22. Moodie R, Stuckler D, Monteiro C, Sheron N, Neal B, Thamarangsi T, et al. Profits and pandemics: prevention of harmful effects of tobacco, alcohol, and ultra-processed food and drink industries. Lancet. 2013;381(9867):670-9. DOI:10.1016/S0140-6736(12)62089-3
23. Moubarac J-C, Parra DC, Cannon G, Monteiro CA. Food classification systems based on food processing: significance and implications for policies and actions: a systematic literature review and assessment. Curr Obes Rep. 2014;3(2):256-72. DOI:10.1007/s13679-014-0092-0
24. Paeratakul S, Ferdinand DP, Champagne CM, Ryan DH, Bray GA. Fast-food consumption among US adults and children: dietary and nutrient intake profile. J Am Diet Assoc. 2003;103(10):1332-8. DOI:10.1016/S0002-8223(03)01086-1
25. Palacios, C. The role of nutrients in bone health, from A to Z. CritRev Food Sci Nutr. 2006;46(8):621-8. DOI:10.1080/10408390500466174
26. Rosenfeld L. Vitamine – vitamin. The early years of discovery. Clin Chem 1997;43(4):680-5.
27. Silva JV, Timóteo AK, dos Santos CD, Fontes G, da Rocha EM. Food consumption of children and adolescents living in an area of invasion in Maceio, Alagoas, Brazil. Rev Bras Epidemiol 2012;13(1):83-93. DOI: 10.1590/S1415-790X2010000100008
Research supported by the Fundação de Amparo à Pesquisa do Estado de São Paulo (FAPESP – Process 2012 /18027-0). Based on the doctoral thesis by Maria Laura da Costa Louzada to be presented to the Postgraduate Program in Public Nutritional Health, Faculdade de Saúde Pública of the Universidade de São Paulo, in 2015.
The authors declare no conflict of interest.
28. Stuckler D, McKee M, Ebrahim S, Basu S. Manufacturing epidemics: the role of global producers in increased consumption of unhealthy commodities including processed foods, alcohol, and tobacco. PLoS Med. 2012;9(6):e1001235. DOI:10.1371/journal.pmed.1001235
29. UNICEF. The Micronutrient Initiative. Investing in the Future: A United Call to Action on Vitamin and Mineral Deficiencies. Global Report. Washington (DC): Fundo das Nações Unidas para a Infância; 2009.
30. Veiga GV, Costa RS, Araújo MC, Souza AM, Bezerra IN, Barbosa FS, et al. Inadequate
nutrient intake in Brazilian adolescents. Rev Saude Publica. 2013;47 Suppl 1: 212s-21s. DOI:10.1590/S0034-89102013000700007
31. World Health Organization. Vitamin and mineral requirements in human nutrition. Geneva: World Health Organization; 2004.