American Journal of Applied Sciences 1(3): 215-219, 2004 ISSN 1546-9239
© Science Publications, 2004
215
Development of Growth Medium for
Centella Asiatica Cell Culture via Response Surface Methodology
1
Rozita Omar,
2M.A. Abdullah,
2M.A. Hasan and
3M. Marziah
1
Department of Chemical Engineering,
2
Department of Biotechnology,
3
Department of Microbiology and Biochemistry,
Universiti Putra Malaysia, 43400 Serdang, Selangor, Malaysia
Abstract: The effects of sucrose, Indole-3-Acetic Acid (IAA) and 6-BenzylAminoPurine (BAP) concentrations on cell growth of Centella asiatica cell suspension culture were studied. The concentrations were designed using Central-composite experimental design and regression analysis was carried out to obtain response surface model describing cell growth for prediction of optimum conditions. Only sucrose as a single factor was positively significant for cell growth. Increasing sucrose concentration from 3.32 to 6.68% (w/v) resulted in an increase in dry cell weight from 16-27 g L−1. IAA and BAP as single factors and other possible interaction effect were insignificant. The optimum values predicted to be 6.68% (w/v) sucrose, 0.84 mg L−1 IAA and 1.17 mg L−1 BAP yielding 27.4 g L−1 dry cell weight with 81.4% regression equation fitness of the experimental data.
Key words: Central Composite, Centella asiatica, Plant Growth Regulator, Response Surface Methodology Sucrose
INTRODUCTION
Interest in pharmaceutical products and drugs derived from plants has increased tremendously in recent years. In Malaysia the value of herbal market is estimated to be at US$3. 8 billion and is growing at 10 to 20% yearly[1]. The plant of interest in this study is
Centella asiatica or its Malaysian name pegaga is of
Umbellifarae species generally found in tropical and sub-tropical countries. Being famous traditionally as health enhancer, its bioactive compounds, triterpenoids (Asiatic acid, Madecassic acid, Asiaticoside and Madecassoside) and antioxidant are responsible for its therapeutic ability. Modern research has found that C.
asiatica possess antibacterial, anti-malarial,
antiproliferative and wound healing properties. With the success of gene cloning that encode enzymes of terpenoid synthesis, genetic or metabolic engineering of plant terpenoid metabolism presents a venue for studies on terpenoid-based insect repellants, pest control or plant with enhanced terpenoid vitamins[2].
Sugars are the main respiratory substrates for energy generation and metabolic intermediates to synthesize macromolecules and other cell constituents. In addition, ribosomal and deoxy-ribosomal sugars are part of the structure of DNA and RNA, and polysaccharides are major structural elements of plant cell walls where linkage of many proteins and lipids to sugar is required for proper functioning. The availability of sugars or their derivatives therefore initiate different responses and would affect plant
metabolism, growth and development[3]. A sucrosefed cell culture is probably similar to the whole plant in terms of its primary metabolic pathways[4] and the level of carbon source affects both cell growth and product formation. Sucrose and glucose have been the most effective carbon source in supporting high growth rates, biomass yield and production[5].
Plant Growth Regulators (PGRs) affect cell growth, metabolism, cell differentiation and induction or repression of biosynthetic pathways. Auxins promote cell elongation and root initiation; while cytokinins promote cell division and shoot differentiation[6]. PGRs are taken up and the level increases intracellular but only temporarily as they could become rapidly inactive after uptake. Their immediate effects depend on the rate of uptake from the medium, stability in the medium and on the sensitivity of the target tissue[6]. The effects of PGRs also depend on diverse factors such as plant species, hormone type and concentration[5]. For example α-Naphthalene Acetic Acid (NAA) is superior to Indole-3-Acetic Acid (IAA) and 2,4-dichlorophenoxyacetic acid (2,4-D) in promoting both cell growth and anthraquinone yield in Rubia cordifolia
but may become inhibitory at 2 to 5 mg L-1[7]. The cytokinins such as 6-BenzylAminoPurine (BAP) and 6- furfurylaminopurine (Kinetin) are mostly used to increase biomass yield and secondary metabolite production such as in Aphelandra[8] cell culture. Nevertheless, little effect of cytokinin is found in
Cinchona succirubra cell growth and anthraquinone
The medicinal properties of many plant species are attributable to their secondary metabolites. Since secondary metabolites are unique to each plant species, strategies must be devised for optimization of medium and cultural conditions for optimum cell growth and secondary metabolite production. This has led to the development of growth and production medium utilizing two-stage fermentation processes such as for
Lithospermum erythrorhizon[10] cell culture. The first
stage is for optimum biomass production in the shortest duration, and the second stage for maximum secondary product synthesis. Recently, intermediary and production medium strategies have also been proposed[11] for C. asiatica cell culture. The strategies for optimization involves screening steps to identify important factors and concentration range; and optimization steps within the defined factors and concentration range of important variables using statistical experimental design such as Response Surface Methodology (RSM). The aim of this study therefore was to optimize the cell growth of C. asiatica
cell culture using sucrose, IAA and BAP concentrations. Central-composite experimental design was utilized to design the concentrations of the factors.
MATERIALS AND METHODS
Cell suspension cultures: C. asiatica cell suspension cultures (CA-01 accession) were initiated from callus obtained from the leaf.
Maintenance medium and experimental approach:
The maintenance of the stock culture and experimental approach was as described before[12].
Analytical procedure and statistical analysis: The determination of cell growth and triterpenoids analysis were as described before[12].
Central-composite experimental design: The Central-Composite Design (CCD) generally consists of a 2k factorial with nF runs, 2k axial or star runs denoted as α
and nc center runs. There are two parameters in the
design that must be specified: The distance α of the axial runs from the design center and the number of center points, nc. α (Star points) value is chosen such
that the central composite design is rotatable which means that the value is at the same distance from the design center[13]. α value depends on the number of points in the factorial portion of the design that is α = (nF)1/4. In this study, three factors (k = 3) were
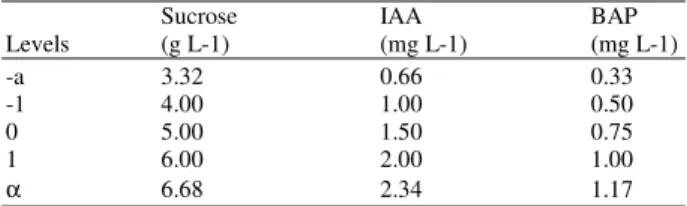
considered resulting in 17 total number of runs. Table 1 shows the maximum, minimum, central, and α values for sucrose, IAA and BAP concentrations, respectively.
Table 1: Maximum, Central, Minimum and Star Points of Central-composite Design for Sucrose, IAA and BAP
Sucrose IAA BAP
Levels (g L-1) (mg L-1) (mg L-1)
-a 3.32 0.66 0.33
-1 4.00 1.00 0.50
0 5.00 1.50 0.75
1 6.00 2.00 1.00
α 6.68 2.34 1.17
RESULTS AND DISCUSSION
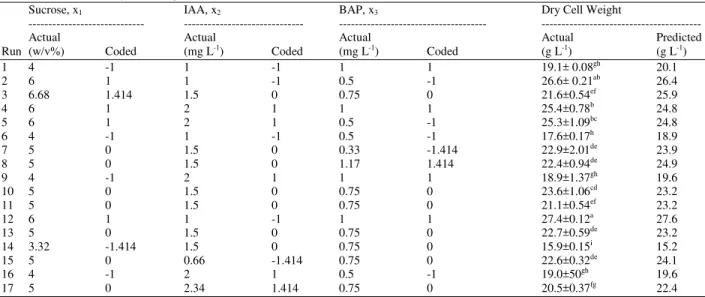
Screening experiments conducted earlier identified sucrose, IAA and BAP as important factors in promoting cell growth of C. asiatica cell culture. In this study, three-level central-composite experimental design was carried out to determine the optimum values and interactive effects of the factors. The design and results are shown in Table 2. The highest dry cell weight was 27.4 g L-1 in run 12 at 6% (w/v) sucrose, 1 mg L-1 IAA and 1 mg L-1 BAP, followed by run 2 with 26.6 g L-1 at 6% (w/v) sucrose, 1 mg L-1 IAA and 0.5 mg L-1 BAP. Low biomass around 18 to 19 g L-1 was obtained in runs 1, 6, 9, 14 and 16, where the sucrose level was noted lower than 4% (w/v).
Pareto chart (Fig. 1), shows that sucrose is the dominant positive factor in cell growth, but sucrose-sucrose interactions could have a significant negative effect. Regression of experimental data gives second order polynomial equation as follows:
DW=-23.6+14.5x1+6.43x2–4.98x3–0.96x1 2
–1.15x1x2- 0.24x2x3+0.06x2 2–2.24x2x3+6.60x3 2 (1)
The multiple coefficient of determination, R2, 81.4 % implies that the sample variations are attributable to the independent variables. Optimum values calculated using Eq. (1) are 66.8 g L-1 sucrose, 0.84 mg L-1 IAA and 1.17mg L-1 BAP and the predicted optimum dry cell weight was 28.1 g L-1. These are close to 60 g L-1 sucrose 1 mg L-1 IAA and 1 mg L-1 BAP which obtained 27.4 g L-1 dry cell weight in Run 12. Surface response plot in Fig. 2 clearly indicates that the maximum point for sucrose concentration can be further increased and the optimum sucrose level coincides with the maximum range tested (Table 2).
Tubulin controls cell shape and chromosome separation and provides cytoskeletal tracks for intracellular vesicular transport via Tual and Incw1 genes. In the absence of sucrose, these genes are not expressed but the addition of sucrose turns on their expression[15]. Intracellular carbohydrate storage may elevate dry cell weight. In carrot cell suspension, intracellular sucrose and glucose concentration during early exponential phase increases from 18 and 10 mol g−1 FW, respectively, to almost 60 mol g−1 FW at the end of logarithmic phase when external sugar was still available in the medium[16]. In intact plant, sucrose is found in the phloem and cell sap at a concentration around 10 to 25% (w/v)[4]. Normally 2 to 3% (w/v) concentrations are able to support growth and at 4 to 10% (w/v) could increase product formation in plant cell cultures. In a medium in which all nutrients are in excess, an increase in sugar concentration will result in a proportional increase in biomass but not necessarily the in secondary metabolite production. Utilization of sugar and other macronutrients are also influenced by the types and combination of PGRs. In Panax ginseng
suspension culture, high IBA and 2,4-D at 10 and 2 mg L−1, respectively, result in sucrose utilization only at 28%; whereas at the 5 mg L−1 IBA and in the absence of 2,4-D, almost 60% sucrose is utilized[17].
The triterpenoids production in G medium cultures was generally lower than 2.5 mg g−1 DW except for Asiaticoside which was detected highest at 4.26 mg g−1 DW (Data not shown). Madecassoside was highest at 2.34 mg g−1 DW whilst Madecassic acid was detected between 0.1 to 0.71 mg g−1 DW. AA was only produced in Runs 4 to 10 at 0.2 to 1.4 mg g−1 DW. The statistical models developed for all four triterpenoids show lack of fitness at 45.4 to 56.7 %. Although it is a significant factor for dry cell weight, sucrose did not affect TTPs
production appreciably probably due to higher concentration range selected as the lower sucrose level (3%) had been reported to have all triterpenoids detected higher than 4 mg g−1 DW[12].
Fig. 1: Pareto Chart for Standardized Effects of Sucrose, IAA and BAP on Cell DW of C.
Asiatica Cell Culture in Growth Medium
Fig. 2: Response Surface Plot of DW of C. Asiatica
Cell Culture in Growth Medium
Table 2: Central Composite Design Matrix Defining Composition of Sucrose, IAA and BAP, Their Coded Values, Experimental and Predicted Data of The Dry Cell Weight of C. asiatica Cell Culture
Sucrose, x1 IAA, x2 BAP, x3 Dry Cell Weight
--- --- --- ---
Actual Actual Actual Actual Predicted
Run (w/v%) Coded (mg L-1) Coded (mg L-1) Coded (g L-1) (g L-1)
1 4 -1 1 -1 1 1 19.1± 0.08gh 20.1
2 6 1 1 -1 0.5 -1 26.6± 0.21ab 26.4
3 6.68 1.414 1.5 0 0.75 0 21.6±0.54ef 25.9
4 6 1 2 1 1 1 25.4±0.78b 24.8
5 6 1 2 1 0.5 -1 25.3±1.09bc 24.8
6 4 -1 1 -1 0.5 -1 17.6±0.17h 18.9
7 5 0 1.5 0 0.33 -1.414 22.9±2.01de 23.9
8 5 0 1.5 0 1.17 1.414 22.4±0.94de 24.9
9 4 -1 2 1 1 1 18.9±1.37gh 19.6
10 5 0 1.5 0 0.75 0 23.6±1.06cd 23.2
11 5 0 1.5 0 0.75 0 21.1±0.54ef 23.2
12 6 1 1 -1 1 1 27.4±0.12a 27.6
13 5 0 1.5 0 0.75 0 22.7±0.59de 23.2
14 3.32 -1.414 1.5 0 0.75 0 15.9±0.15i 15.2
15 5 0 0.66 -1.414 0.75 0 22.6±0.32de 24.1
16 4 -1 2 1 0.5 -1 19.0±50gh 19.6
17 5 0 2.34 1.414 0.75 0 20.5±0.37fg 22.4
Fig. 3: Suspension and Harvested Culture in (A) M and (B) G Medium
Fig. 4: Micrograph of 7-day-old Cells Cultured in a) M Medium b) G Medium (100 X Magnification) Figure 3 shows cells grown and harvested from
maintenance medium (M) and growth medium (G). Cells from G medium were slightly darker as compared to M which was pale yellowish in color. The color in G could be indicative of induction of flavonoids or penniless as a result of stress due to the high sucrose level at 6.68% (w/v) in G as compared to 3% (w/v) in M. Figure 4 shows that the cells from G medium appeared were more rounded as compared to more elongated cells in the M. Rounder cells may be a result of high sucrose level which exerts osmotic pressure on the cells in G medium. IAA could affect cell size expansion to provide more space for the high sugar influx. Cell size expansion is also described by[11] as a possible contributing factor for higher cell DW in NAA than 2,4-D in C. asiatica cell cultures initiated from 2- weeks-old inoculum age and 6% (w/v) sucrose level.
CONCLUSION
Cell growth of C. asiatica was significantly positively influenced by sucrose as a single factor. High dry cell weight was achieved at 27.4 g L−1 utilizing 6% w/v sucrose, 1 mg L−1 IAA and 1 mg L−1 BAP. The response surface model fitted to the data with 81.4% fitness predicted optimum concentrations at 6.68%
(w/v) sucrose, 0.84 mg L−1 IAA and 1.17 mg L−1 BAP to yield 28.1 g L−1 of cell dry weight, which was close to the experimental values.
ACKNOWLEDGEMENT
We wish to thank the Government of Malaysia for financing this project.
REFERENCES
1. Anonymous, 2002. Panel to Superhead R and D on Herbal Drugs. The Sun, pp 3.
2. Buchanan, B., W. Gruissem and R. Jones, 2000. Biochem. Mol. Biol. Of Plants. Am. Soc. Of Plant Physiol.
3. Yu, S-M., 1999. Cellular and genetic responses of plants to sugar starvation. Plant Physiol., 121, 687. 4. Cresswell, R. C., M. W. Fowler, A. Stafford and G.
Stepan-Sarkissian, 1989. Input and Outputs: Primary substrates and secondary metabolism. Springer-Verlag, Berlin.
6. de Klerk, G. J., 2000. Plant hormones in tissue culture. Duchefa Biochemie by Haarlem.
7. Suzuki, H., T. Matsumoto and Y. Mikami, 1984. Effect of nutritional factors on the formation of anthraquinones by Rubia cordifolia plant cells in suspension cultures. Biol. Chem., 48, 603.
8. Nezbedova, L., M. Hesse, J. Dusek and C. Werner, 1999. Chemical potential of Aphelandra sp. Cell cultures. Plant Cell, Tissue & Organ Culture, 58, 133.
9. Khouri, H. E., R. K. Ibrahim and M. Rideau, 1986. Effect of nutritional and hormonal factors on growth and production of anthraquinone glucosides in cell cultures of C. succirubra. Plant Cell Rep., 5, 423.
10. Curtin, M. E., 1983. Harvesting Profitable Products from Plant Tissue Culture. Biotech., 1, 649. 11. Abdullah, M. A., N. Gorret, S. Oppenheim and D.
Choi, 2001. Cell growth, triterpenoids production and induction of potent stress related compounds in Centella asiatica (CA01) cell cultures. Report submitted to The Natl. Biotech. Directorate Malaysia for MMBPP: Kuala Lumpur.
12. Omar, R., M. A. Abdullah, M. A, Hassan and M. Mazriah, 2003. Optimization and Elucidation of Interactions between Ammonia, Nitrate and Phosphate in Centella asiatica Cell Culture. Int’l Conf. Chem. & Bioprocess Engr. Proc.; Universiti Malaysia Sabah: Kota Kinabalu, pp. 187-193. 13. Deming, S. N., 1990. Quality by design – part 5.
Chemtech, 20, 118.
14. Koch, K.E., 1996. Carbohydrate-modulated gene expression in plants. Ann. Rev. Plant Physiol, 47, 509.
15. Datta, R. And P. S. Chourey, 2001. Sugarregulated control of _-tubulin in maize culture. Plant Cell Rep. 20.
16. Kanabus, J., R. A. Bressen and N. C. Carpita, 1986. Carbon assimilation in carrot cells in liquid culture. Plant Physiol., 82, 363.