So maclo nal variatio n: a mo rpho ge ne tic
and bio che mical analysis o f
Mand e villa
ve lutina
culture d ce lls
1Laboratório de Morfogênese e Bioquímica Vegetal,
Universidade Federal de Santa Catarina, Florianópolis, SC, Brasil
2Department of Biochemistry, Purdue University, West Lafayette, IN, USA
3Laboratório de Celula Neoplásica, Universidade Federal do Paraná, Curitiba, PR, Brasil 4Laboratório Central de Pesquisa e Desenvolvimento, LACTEC, Curitiba, PR, Brasil 5Laboratório de Microbiologia, Imunologia e Parasitologia,
Universidade Federal de Santa Catarina, Florianópolis, SC, Brasil 6Leiden/Amsterdam Center for Drug Research, Leiden University,
Division of Pharmacognosy, Leiden, The Netherlands
7Laboratório de Q uimio-Biotecnologia de Biomassa, Universidade Federal do Paraná,
Curitiba, PR, Brasil M. Maraschin1,
J.A. Sugui7, K.V. Wood2, C. Bonham2, D.F. Buchi3, M.P. Cantao4, S.G. Carobrez5, P.S. Araujo1, M.L. Peixoto1, R. Verpoorte6 and J.D. Fontana7
Abstract
Cell cultures of Mandevilla velutina have proved to be an interesting production system for biomass and secondary metabolites able to inhibit the hypotensive activity of bradykinin, a nonapeptide gener-ated in plasma during tissue trauma. The crude ethyl acetate extract of cultured cells contains about 31- to 79-fold more potent anti-bradyki-nin compounds (e.g., velutinol A) than that obtained with equivalent extracts of tubers. Somaclonal variation may be an explanation for the wide range of inhibitor activity found in the cell cultures. The hetero-geneity concerning morphology, differentiation, carbon dissimilation, and velutinol A production in M. velutina cell cultures is reported. Cell cultures showed an asynchronous growth and cells in distinct develop-mental stages. Meristematic cells were found as the major type, with several morphological variations. Cell aggregates consisting only of meristematic cells, differentiated cells containing specialized cell structures such as functional chloroplasts (cytodifferentiation) and cells with embryogenetic characteristics were observed. The time course for sucrose metabolism indicated cell populations with signifi-cant differences in growth and metabolic rates, with the highest biomass-producing cell line showing a cell cycle 60% shorter and a metabolic rate 33.6% higher than the control (F2 cell population).
MALDI-TOF mass spectrometric analysis of velutinol A in selected cell lines demonstrated the existence of velutinol A producing and nonproducing somaclones. These results point to a high genetic heterogeneity in general and also in terms of secondary metabolite content.
Co rre spo nde nce
M. Maraschin
Laboratório de Morfogênese e Bioquímica Vegetal, CCA, UFSC 88049-900 Florianópolis, SC Brasil
Fax: + 55-48-331-5400 E-mail: m2@ cca.ufsc.br
Some of these data were presented at the 20th Symposium on Biotechnology for Fuels and Chemicals, O ak Ridge National Laboratory, Gatlinburg, TN, USA, May, 1998.
Received O ctober 24, 2001 Accepted March 19, 2002
Ke y words
•Mandevilla velutina •Secondary metabolism •Plant cell cultures •Somaclonal variation •Phytosteroid
Intro ductio n
Mandevilla velutina (Apocynaceae) is a plant native to Brazil and in several central-western regions folk medicine prescribes the use of infusion or alcoholic extracts of its tuber for the treatment of inflammatory states, including those caused by Bothrops jara-raca snake bites. The tubers are a source of bioactive compounds able to selectively an-tagonize the hypotensive activity of bradyki-nin (BK) and other kibradyki-nins (1). These anti-BK compounds are secondary metabolites chemi-cally characterized as triterpenoids, e.g., velutinol A (2). However, no significant amounts (~0.001 to 0.0001%, fresh weight) were found in crude plant extracts (3,4). Recently, a patent covering velutinol A and its glycosylated derivatives was issued in Canada (Canadian Patent No. 70857-228, September, 1998; 5), but large-scale bio-mass production by conventional methods seems not to be economically feasible.
As an alternative method to the destruc-tive exploitation of nadestruc-tive plant populations,
in vitro cell culture of M. velutina was adopted (6). The extraction of the bioactive com-pounds with ethyl acetate from cultured cells yielded crude extracts with an anti-BK ac-tion about 31- to 79-fold more potent than that obtained with extract of tubers of the plant (3). This result indicated the potential of this method for obtaining the anti-BK compounds. Somaclonal variation, a com-mon phenomenon in plant cell cultures, char-acterized by phenotypic variation of either genetic or epigenetic origin, may be an ex-planation for the wide range of inhibitor activity found. Accordingly, somaclonal variation can be either an advantage (vari-ability increase) or disadvantage (loss of stability of cell lines), depending on the aim of the study (7-9). However, it has become apparent that, rather than being an unex-plainable aberration in an otherwise uniform cell proliferation process, the appearance of variants in cell cultures may be a routine
occurrence for certain types of plants or specific explant sources. Since all cells of an organism are derived from a single cell, it has been assumed that plants derived from cells of a donor plant would yield identical individuals. Nonetheless, studies on soma-clonal variation have indicated that soma-clonal uniformity is now recognized as the excep-tion rather than the rule (10,11). Recently, quantitative analyses of velutinol A and its glycosylated form (MV 8612) revealed the occurrence of higher content in cell culture extracts when compared to the native plant (12).
Since somaclonal variants result, by defi-nition, from genetic changes ultimately caused by inheritance (13), several critical analyses of this subject have been conducted focusing on the phenotypic, genetic (e.g., aneuploidy, polyploidy, or mixoploidy), cy-togenetic and molecular (DNA methylation) alterations found in plant cells and/or tissues in crop breeding programs (8). Several stud-ies have shown that somaclonal variation can be assessed by analysis of phenotype, chromosome number and structure, proteins or direct DNA evaluation of plants (14). The types of variation that are frequently ob-served may differ from species to species, and it is often difficult to determine the genetic nature of the observed variation (15). How-ever, one should keep in mind that the corre-spondence between changes at the phenotypic and cytological/molecular level should be con-sidered, since good correlation might not be found between the extent of mutations (mo-lecular level) and phenotypic changes (14). Thus, in the present state of knowledge, we are able to exploit somaclonal variation, but we are still unable to control it (16).
lines with characteristics of interest even on an industrial scale. As an example, we may mention the production of shikonin from
Lithospermum erythrorhizon (17), of ber-berine from Coptis japonica (18), and of ginsenosides from Panax ginseng (19). Thus, the information about somaclonal variability can be considered fundamental to studies concerning the production of secondary me-tabolites (7).
The in vitro screening and selection of M. velutina somaclones with a high potential for anti-BK production could be done on a chemical basis, taking into account the con-tent of the triterpenoids of interest (13). How-ever, the objective of the present study is to investigate the phenotypic heterogeneity of
M. velutina cell cultures in a broader sense, taking into account their morphological and metabolic profiles, using light and scanning electron microscopy and growth analysis by the determination of the rate of metabolism of sugars by the cell populations. Further-more, an investigation concerning second-ary metabolites of interest in selected cell lines is reported. In fact, the improvement of the yield of velutinol A in M. velutina cell cultures is currently the bottleneck which remains to be overcome before the applica-tion of this biotechnological system on a commercial scale.
Mate rial and Me thods
Ce ll line culture s
Primary callus cultures were obtained using nodal segments (~8 mm long; 6.5-8.0 mg) from a single 4-month-old plantlet cul-tured in vitro, native to the Cerrado ecosys-tem (Coromandel, MG, Brazil), on semi-solid MS medium (20) supplemented with 2 mg/l 2,4-dichlorophenoxyacetic acid, 2 mg/l 6-benzylaminopurine, and 3 mg/l 6-furfuryl-aminopurine (MC24 medium; 12). The cell lines were set up by a classical method (cell-aggregate cloning; 7), selecting high
bio-mass-producing clones from regular subcul-tures (28 days). Briefly, cell aggregates (~3 mm in diameter) were subcultured from a single cell colony 28 days after inoculation onto filter paper (21) in contact with liquid MC24 medium. The cultures were kept at 24 ± 1ºC, 16-h photoperiod, 31.5 µmol photons m2 s-1 (Philips TLF 33), and 85-90% relative humidity. Cell growth biomass was moni-tored daily by visual inspection for 28 days, followed by transferring ca. 0.1 g of cells of the higher biomass-producing clones selected to fresh semi-solid MC24 culture medium. From each selected cell line, 0.5 g of 21-day-old cells were subcultured in MC24 liquid medium to obtain cell suspension cultures as previously described (12). Cell suspensions were maintained in 250-ml Erlenmeyer flasks under continuous light (31.5 µmol photons m2 s-1, Philips TLF 33) and shaking at 110 rpm at 24 ± 1ºC. Stock cell line cultures have been cultured according to the above condi-tions for eight years in our laboratory.
D e te rmination of dissimilation curve s
the analysis of the data was kindly furnished by the Division of Pharmacognosy, Leiden University, Leiden, The Netherlands.
Synchronous ce ll culture s
Synchronous cell cultures were obtained by collecting cell samples (10 ml) from a single 30-day-old cell suspension culture (3 g cells/50 ml culture medium - stationary phase), in order to minimize the effect of any error or variation source, followed by filtra-tion (1.0 mm in diameter) and inoculafiltra-tion of 0.5 g cells on 20 ml MC24 semi-solid medi-um. The growth analysis was carried out by determining the dissimilation curves for two independent cell populations.
Light microscopy
Samples of 0.5 ml from 21-day-old M. velutina cell suspension cultures (2.1 x 10⁶ cells/ml) were collected weekly, centrifuged at 251.5 g for 5 min and washed twice with sterile saline solution (0.85% NaCl). The cells were resuspended in saline solution and samples were stained with 0.2% Coo-massie brilliant blue R-250 prior to visual-ization. Data were recorded by micrography under visible light (100X and 400X) using a microscope (Nikon Labophot, Tokyo, Ja-pan) equipped with a Nikon FX-35 camera.
Scanning e le ctron microscopy
Cells resuspended in saline solution were centrifuged at 1062 g for 5 min and washed extensively with 0.1 M sodium cacodylate buffer, pH 7.2, followed by a 2% glutaralde-hyde/2-h dark treatment. Samples were washed twice with sodium cacodylate buf-fer, resuspended in 1% OsO4/15 min in the dark and washed again (three times) in buf-fer. After centrifuging at 1062 g for 5 min, cells were sequentially treated with EtOH (50, 75, 90 and 100%, 15 min/concentra-tion), gold coated. The material was
exam-ined with a Philips XL 30 scanning electron microscope operating at 15 kV and data were recorded with a Linhof camera.
Chromatographic analysis of ve lutinol A
For the analysis of the steroid velutinol A
in selected cell cultures, 150 g of cells (fresh weight) from 30-day-old cell cultures (in-oculum density = 3 g cells/50 ml culture medium) were collected, lyophilized and stored at -20ºC. The compound of interest was extracted from lyophilized cells with 2 volumes of ethyl acetate at 4ºC/7 days. The extract was filtered, concentrated under re-duced pressure (crude extract), followed by the isolation of velutinol A by column chro-matography on silica gel, using methylene chloride with increasing amounts of ethyl acetate as eluent (23). The presence of the compound in the column effluent was moni-tored by TLC on silica gel (Kilselgel 60 F254, 0.25 mm, Merck, Darmstadt, Germany), us-ing hexane:diisopropyl ether:acetone (4:4:3) as the solvent system. Detection was per-formed by first spraying the chromatoplates with anisaldehyde-sulfuric acid, followed by heating at 100ºC (3).
MALDI-TO F mass spe ctrome try analysis of
ve lutinol A
ap-plied to the sample target and allowed to dry prior to mass spectrometry analysis. A nitro-gen laser with a 337 nm output was used and the spectra were taken in the positive-ion mode using an accelerating voltage of 28 kV. The laser power output was set just above the threshold for ion production.
Re sults and D iscussion
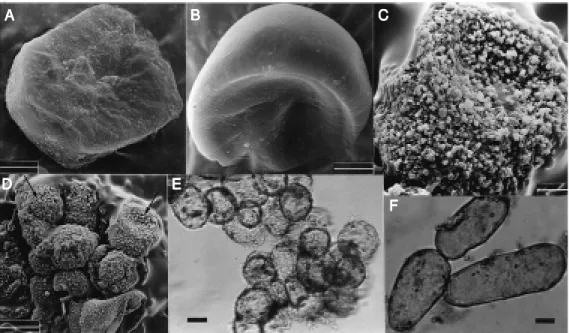
Cell cultures of M. velutina showed an asynchronous growth pattern and somaclones in distinct development stages. Typical mer-istematic cells with a round shape and trans-lucent cytoplasm were found as the major type, especially along the lag phase (Figure 1A,B,E,F). We also observed a tendency to an elongated shape as the cultures entered the exponential growth phase (Figure 1F). Plant cells are naturally asynchronous with respect to the mitotic cycle, and at any time a culture will contain a combination of cells in different cycle phases (25) as described here. The heterogeneity found might be attributed to the fact that the cell cultures did not originate from a single cell (26). In fact, to account for the lack of uniformity in multi-cellular explants as in this case, it has been suggested that explants derived from sources
other than protoplasts be called complex cultures due to their multicellular origin (27,28). Because it is unlikely that any two cell types have exactly the same prolifera-tion rate, even after prolonged culture cell lines often remain highly heterogeneous in cellular constitution. As an example, a wide variation in berberine content of individual cells within a Coptis japonica cell suspen-sion culture was detected by flow cytometric analysis (29). Indeed, it has been recognized that a cultured cell line seems better defined as a population formed by cells having var-ied characters at the genetic, biochemical, physiological, and morphological levels, with the resulting phenotype of the population being determined by the predominant cell type. Furthermore, the response of the cell types to external stimuli in terms of the biosynthesis of secondary metabolites, for instance, depends upon their morphological and/or physiological state (16). This is be-cause the cell culture environment not only could induce variations in the cultured cells but could also select a particular cell type. So any cell carrying this trait has a selective advantage over the normal ones and the prob-ability to obtain a mutant with a specific trait is highly increased (30).
Figure 1. Scanning electron (A, B, C, and D) and light (E, F) mi-crographs of M andevilla velutina
cultured cells show ing variations in size, morphology and cell ag-gregates. A, B, Typical m er-istematic 7- and 21-day-old cells, respectively (bar = 5 µm). C, De-tails of the cell surface rugosity of a single cell (bar = 10 µm). D, Cell aggregates w ith the pre-dominance of globular cell types from a 21-day-old culture. Ar-row s show the cell surface rug-osity (bar = 50 µm). E, Seven-day-old cells (bar = 60 µm). F, Protein staining w ith 0.2% Coo-massie brilliant blue R-250 in 21-day-old cells show ing an elon-gated shape (bar = 60 µm).
A AA A
A BBBBB CCCCC
D DD D
D EEEEE
by analyzing surface molecules (biomarkers) by mass spectrometry (MALDI-TOF), re-sulting in a mass fingerprint typical of the particular species, and in some cases at the strain level, demonstrating the feasibility of this approach (31).
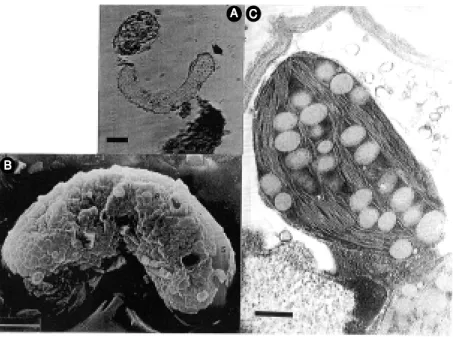
Cells with embryogenetic characteristics (Figure 2A,B) were also found, suggesting the existence of this morphogenetic path-way. To the best of our knowledge, the oc-currence of embryogenesis in cultured cells of M. velutina has not been previously re-ported. As M. velutina cultured cells express such a development after a callus stage, this seems to be a case of indirect embryogenesis which is the most common embryogenetic pathway. Previous analyses of M. velutina
calli showed the occurrence of embryoge-netic cells only in cultures older than 21 days. It seems that frequent subculturing (time intervals <15 days) inhibits this mor-phogenetic pathway, since embryogenetic cells were not found in these populations (32). Again, the existence of any differentia-tion stage in M. velutina cell suspension cultures demonstrated in the present work is interesting, considering that the focus is on the secondary metabolite synthesis (33).
The cultures were able to synthesize chlo-rophyll (data not shown), thus exhibiting a specialized function, and further transmis-sion electron microscopy analysis (Figure 2C) showed the presence of chloroplasts exhibiting a normal architecture. This aspect is worth mentioning since the absence of specialized cell structures in some cultures may be a further reason for the absence or at least for much reduced levels of accumu-lated secondary metabolites (16). Chloro-phyll content has been used as a parameter to evaluate the occurrence of variations in plant cell and tissue cultures (30,34). In rye, as in other Gramineae, very frequent chlorophyll variations were observed in plants regener-ated from immature embryo cultures (30). In
Picea mariana and P. glauca, 0.1 and 0.3% of the plants regenerated by somatic
em-Figure 2. Light (A) and scanning electron (B) micrographs of 21-day-old M andevilla velutina
cells show ing embryogenetic characteristics and specialized functions. A, Note the initial cell polarization (arrow ). Bar = 15 µm. B, Smooth (S) and rough (R) areas on the pro-embryogenetic cell surface. Bar = 3 µm. C, Electron transmission micrograph show ing a functional chloroplast containing starch-like granules. Bar = 400 nm.
Clearly green cell aggregates were usu-ally observed, being formed only of mer-istematic cells (Figure 1D,E), with a mean range of 16-22 cells/aggregate. We observed a strong tendency to form larger cell aggre-gates when the cells were cultured in medi-um containing growth regulators at concen-trations ten times lower than used in this study (data not shown). The size of the cell aggregates (240-330 µm) is a determinant factor of culture behavior because of the different microenvironments to which the cells are exposed. It is also possible that such cells represent a variant phenotype with al-tered properties (26). Meaningful differences in cell surface rugosity were detected be-tween single cells (Figures 1A-C and 2B) and cell aggregates (Figure 1D) along the culture stage. In fact, this trait seems to be useful for cell heterogeneity characteriza-tion in cultured plant cells, for clonal cell screening and for selection with polyclonal antibodies as biochemical markers (12). As a practical example, more recently the char-acterization of bacterial cells was performed
A AA A A CCCCC
bryogenesis were achlorophyllous and dis-played different distributions and proportion of green and white tissues (variegata pheno-type). However, chromosome number counts did not show differences between variegata
and normal plants, emphasizing the fact that phenotypic evaluation seems to be a valu-able tool to assess the genetic integrity of clonal propagation processes. Furthermore, in the absence of reliable genetic markers of somaclonal variation, phenotype still repre-sents the easiest and fastest way to identify putative mutants (34).
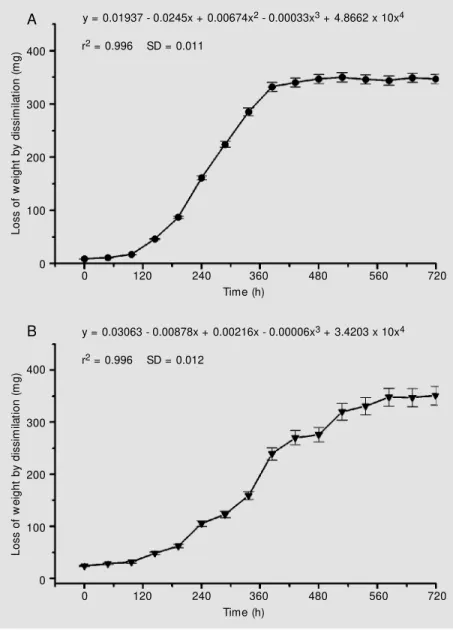
The dissimilation curves observed are shown in Figure 3A,B. Cell cultures pre-sented a variable growth index, suggesting the presence of somaclones with different metabolic rates in M. velutina cell suspen-sion cultures. Similar results were found in semi-solid medium and in cell suspension culture kinetic experiments performed in the absence of light (12).
A detailed analysis of dissimilation curves for the cultures with the highest growth in-dex (F2, F4, F6, and F7) revealed meaningful differences among them. The F2 cell popula-tion showed a typical sigmoid growth (r2 = 0.996), with a lag and exponential phase duration of 4 and 14 days, respectively. This growth curve has been characteristic for M. velutina cell suspension cultures along the subcultures (>30), with small variations, and we have considered it as a standard (hereaf-ter referred to as control) for the purpose of further comparative analysis. F6 and F7 cell populations differed from the control (F2) especially concerning lag phase duration (data not shown). A short lag phase (~24 h) was observed for both populations and their growth phase was longer, 16 and 10 days, respectively. In fact, a mathematical model based on linear regression seems to better represent the dissimilation curve for the F7 cell line (r2 = 0.956), considering its lag and growth phase. High biomass-producing cell lines of Tabernaemontana divaricata cells displayed a similar profile for the growth
curve with a short lag phase and also a linear growth phase, but without alterations in the alkaloid content (35). Furthermore, a math-ematical treatment by integrating the area of each dissimilation curve revealed highest metabolic rates for F6 and F7 cell lines, which were 22.4 and 33.5% greater than the control (F2), respectively, while F4 showed a dis-similation 15.9% lower than the control. Despite the differences for the cell cycle observed here, the maximum dissimilation at the stationary phase did not differ for these
L
o
s
s
o
f
w
e
ig
h
t
b
y
d
is
s
im
ila
ti
o
n
(
m
g
) 400
300
200
100
0
0 120 240 360 480 560 720 Time (h)
y = 0.01937 - 0.0245x + 0.00674x2 - 0.00033x3 + 4.8662 x 10x4
r2 = 0.996 SD = 0.011
y = 0.03063 - 0.00878x + 0.00216x - 0.00006x3 + 3.4203 x 10x4
r2 = 0.996 SD = 0.012
0 120 240 360 480 560 720 Time (h)
L
o
s
s
o
f
w
e
ig
h
t
b
y
d
is
s
im
ila
ti
o
n
(
m
g
) 400
300
200
100
0
A
B
Figure 3. Representative dissimilation curve (A) for a M andevilla velutina cell suspension culture show ing a sigmoidal grow th pattern - F2 cell line. A distinct grow th rate, w ith low er
three populations compared to the control (F2), with a mean value of about 356 mg (25-day-old cultures), suggesting a similar po-tential for biomass production. The cell sus-pension cultures with a lower growth rate (F1, F3 and F5) did not show cells with mor-phological changes that indicate degenera-tion or death.
Growth rate has been suggested as a cri-terion in experiments designed to select cell lines with higher performance (33). Indeed, one might consider it an expression of the genetic variability in cell cultures, which could be correlated with the synthesis rate of the metabolites of interest. Distinct dissimi-lation rates and indole alkaloid content were
found in three T. divaricata cell strains along a culture period of nearly one year (36). The N strain accumulated a lot of intracellular glucose and fructose, with a relatively low dissimilation, whereas strain S behaved in the opposite manner and strain A showed an intermediate behavior. The highest indole alkaloid production content was found in strain N, while strain A showed a lower but stable alkaloid production. No indole alka-loid production was detected in strain S. Interestingly, no evidence for random ge-netic instability was found in the experi-ments. Following this approach, thin layer chromatography analysis of the organosol-vent fraction (ethyl acetate) extracted from
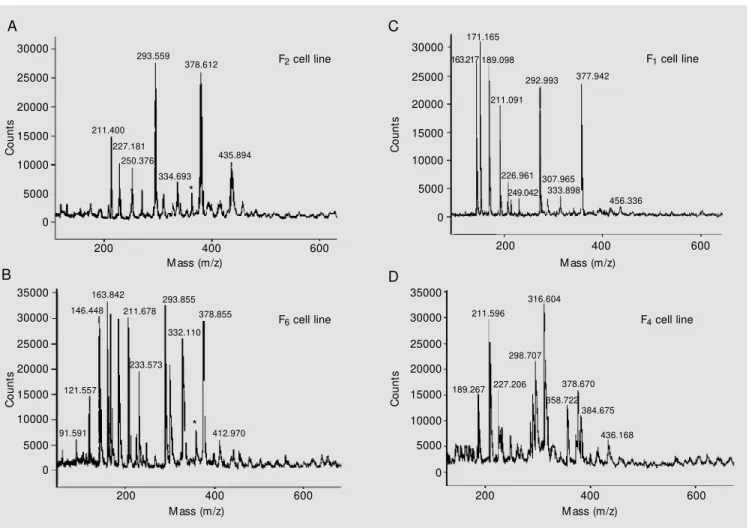
Figure 4. Partial, positive ion detection mode, M ALDI-TOF mass spectrometry obtained from the ethyl acetate samples (crude extract) of producing and nonproducing cell lines of M andevilla velutina. A, Producing F2 cell line and B, producing F6 cell line. The peak resulting from velutinol A (m/z 362) is
marked w ith an asterisk. C,NonproducingF1 cell line and D, nonproducing F4 cell line. Notice the absence of the peak resulting from velutinol A (m/z =
362) in C and D.
C
o
u
n
ts
30000 25000 20000 15000 10000 5000 0
35000 30000 25000 20000 15000 10000 5000 0
C
o
u
n
ts
200 400 600
M ass (m/z)
293.559 378.612
211.400
227.181 250.376
334.693
435.894
F2 cell line
146.448
*
163.842
211.678
233.573 332.110 293.855
378.855
121.557
91.591 412.970
F6 cell line
*
200 400 600 M ass (m/z)
C
o
u
n
ts
30000 25000 20000 15000 10000 5000 0
35000 30000 25000 20000 15000 10000 5000 0
C
o
u
n
ts
200 400 600
M ass (m/z)
292.993 377.942
211.091
226.961 333.898
456.336
F1 cell line
211.596
298.707 316.604
189.267 227.206
436.168
F4 cell line
200 400 600
M ass (m/z)
307.965 249.042 171.165
189.098 163.217
378.670
358.722 384.675
A C
M. velutina cell cultures revealed distinct chromatographic patterns for the compounds of interest (i.e., MV 8608, velutinol A and MV 8610, its glycosylated derivative - data not shown), indicating that some cell lines do not produce them. These findings prompted us to screen the cell lines selected according to their biomass yield in order to detect the compound of interest by using MALDI-TOF mass spectrometry with direct injection of the organosolvent samples into the mass spectrometer. For purposes of com-parative analysis among cell lines with re-spect to velutinol A production, the F5 cell line was used as control, as previously re-ported (24). Indeed, analysis of the MALDI-TOF spectra allowed us to confirm the chro-matographic findings described above, point-ing to the existence of velutinol A producing (Figure 4A,B) and nonproducing (Figure 4C,D) cell lines. Because of the soft ioniza-tion, MALDI mass spectrometry has been shown to be a robust technique for the anal-ysis of compounds in the complex biological matrix of a crude plant extract, as shown for chlorinated bisbibenzyls in crude extracts of
Bazzania trilobata (37). In a similar ap-proach, MALDI-TOF mass spectrometry analysis of 3-deoxyanthocyanidins and an-thocyanins was performed using crude ex-tracts of Sorghum bicolor tissues, with sen-sitivities at 15 pmol/µl for 3-deoxyanthocya-nidins and as low as 5 pmol/µl for pure samples of anthocyanidin (pelargonidin) and anthocyanin (malvin) (38). This approach would seem to be of interest in plant biotech-nology programs for early identification and selection of high producing cell lines, reduc-ing the duration of this usually time-consum-ing step, as well as for phytochemical stud-ies, monitoring secondary metabolism in plant or animal cells and tissues, and for rapid and accurate characterization of mi-croorganisms of interest (24,31,37). Gener-ally, a primary metabolite is synthesized as a direct result of the metabolic processes that keep the cells alive and growing and it
accu-mulates in parallel with cell biomass. Con-versely, a secondary metabolite is usually not formed as a direct result of metabolism that maintains cells in an actively dividing state and the accumulation of these metabo-lites tends to lag behind cell growth (16). Therefore, culture conditions favoring rapid growth are seldom considered as the best for the biosynthesis/accumulation of secondary metabolites. The present findings, especially considering the F6 and F7 cell lines, become interesting as one considers a two-stage strat-egy as a suitable way of increasing the pro-ductivity of plant cell cultures (39).
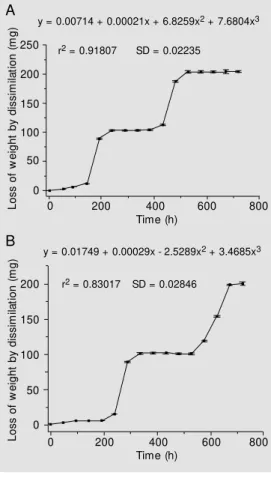
Since synchronous cell culture is an im-portant tool for further studies of secondary metabolism, the results prompted us to pur-sue this goal. In preliminary attempts, growth analysis was carried out by determining the dissimilation curves for two independent cell populations and the results are shown in Figure 5A,B. A similar dissimilation profile
L
o
s
s
o
f
w
e
ig
h
t
b
y
d
is
s
im
ila
ti
o
n
(
m
g
)
250 200 150 100 50 0
200 150 100 50 0
L
o
s
s
o
f
w
e
ig
h
t
b
y
d
is
s
im
ila
ti
o
n
(
m
g
)
200
0 400 600 800
y = 0.00714 + 0.00021x + 6.8259x2 + 7.6804x3
r2 = 0.91807 SD = 0.02235
y = 0.01749 + 0.00029x - 2.5289x2 + 3.4685x3
r2 = 0.83017 SD = 0.02846
Time (h)
200
0 400 600 800 Time (h)
Figure 5. Loss of w eight by dis-similation (mg) of tw o independ-ent synchronous cell lines of
M andevilla velutina grow n on M C24 semi-solid medium. The
duration of the w hole cell cycle (lag-stationary phase) is show n, being 288 h for the S1
popula-tion (A) and 384 h for the S2
population (B). P<0.05 using the Student t-test.
A
was observed for the cell populations in the time course experiments, which showed a synchronous cell cycle. This might be due to the cell harvesting time (30 days after inocu-lation - stationary phase), since it has been reported that the induction of synchroniza-tion of the cell cycle in cultures along the stationary phase can be due to lack of any nutrient (limiting factor). The elapsed time for the growth cycle (lag → stationary phase) was about 288 and 384 h for S1 and S2 populations, respectively. Accordingly, the total amount of dissimilation of the former cell population was somewhat higher (35.3%) as calculated by integrating the area of its dissimilation curve.
The results point to a high cell variability present in the cultured cell populations with respect to morphogenetic and metabolic as-pects. Furthermore, the findings are evidence that M. velutina cultured cells are heteroge-neous in their ability to produce the com-pounds of interest, being mixtures of pro-ducing and nonpropro-ducing cells. Many plant cell cultures also exhibit variation in second-ary product yield over successive subcul-tures. This phenomenon constitutes a
poten-tial problem for the commercialization of fine chemical production by plant cell cul-tures, particularly when the instability takes the form of a consistent reduction in yield. One should keep in mind that unpredictable yield fluctuations of 50% or more might make all the difference between an interest-ing observation and a commercial process. Thus, it seems clear that the variation gener-ated via the plant cell culture process could be interpreted as a hindrance to progress, for example, in an industrial program aiming at drug production from plant cell cultures. In this situation, however, this process of yield deterioration can be arrested by making se-lections at regular intervals, coupled to tech-niques scaled up to meet industrial produc-tion levels (25,34). Since the somaclonal variation appears to provide an interesting approach to study secondary metabolism in order to select high producing cell lines, the performance of some producing velutinol A
cell lines herein described was screened in a two-stage cell culture system (38) in order to optimize the yield of this compound and the results will be published elsewhere.
Re fe re nce s
1. Calixto JB, Strobel GH, Cruz AB & Yunes RA (1988). Blockade of the bradykinin-evoked diphasic response of isolated rat duodenum by the crude extract of com-pounds obtained from M andevilla velu-tina. Brazilian Journal of M edical and Bio-logical Research, 21: 1015-1018. 2. Bent o ES, Calixt o JB, Haw kes GE,
Pizzolatti M G, Sant’Ana AEG & Yunes RA (1996). The structure of velutinol A is (15R, 16R, 20S )-14,16:15,20:16,21-tri-epoxy-15-16-seco-14ß,17α -pregn-5-ene-3ß,15-diol. A combined quantitative Over-hauser effect and molecular modelling study. Journal of the Chemical Society. Perkin Transactions I, 2: 1359-1366. 3. Calixto JB, Silva AL, Reis M S, Costa
RM BFL, Yunes JA, Cruz AB & Yunes RA (1989). Demonstration of anti-bradykinin compounds in callus culture of M andevilla velutina.Brazilian Journal of M edical and
Biological Research, 22: 1275-1279. 4. Sant os AR, Cruz AB, M araschin M ,
Queiroz FP, Gorski F, Yunes RA & Calixto JB (1992). Produção dos com post os ativos de M andevilla velutina por cultura de tecidos in vitro. Análise química e farmacológica. In: Anais do XII Simpósio de Plantas M edicinais do Brasil, Universi-dade Federal do Paraná, Curitiba, PR, Bra-zil, September 1992, 75.
5. Bkaily G, Orleans PD, Calixto JB & Yunes RA (1998). Patent No. CG 70857228 -Specific steady-state R-type Ca2+ channel
blockers and used thereof. Canada, Sep-tember 1998.
6. M araschin M & Queiroz FP (1991). Curva de crescimento de callus de M andevilla velutina - Procedência Cerrado. In: Anais do III Encontro de Botânicos PR-SC, Uni-versidade Federal de Santa Catarina, Flori-anópolis, SC, Brazil, October 1991, 33.
7. Petiard V, Baubault C, Bariaud A, Hutin M & Courtois D (1985). Studies on variability of plant tissue cultures for alkaloid pro-duction in Catharanthus roseus and Pa-paver somniferum callus cultures. In: Neumann N (Editor), Primary and Second-ary M etabolism of Plant Cell Cultures. Springer-Verlag, Berlin, Germany. 8. Scow croft WR & Larkin PJ (1988).
Soma-clonal variation. In: Bock G & M arsh J (Editors), Applications of Plant Cell and Tissue Culture. Ciba Foundation Sympo-sium 137, John Wiley and Sons, Chiches-ter, England.
9. Hadi M Z & Bridgen M P (1996). Soma-clonal variation as a tool to develop pest resistant plants to Torenia fournieri ‘Com-pacta Blue’. Plant Cell, Tissue and Organ Culture, 46: 43-50.
Hohn B & Dennis ES (Editors), Genetic Flux in Plants. Springer-Verlag, Vienna, Austria.
11. Skirvin RM , M cPheeters KD & Norton M (1994). Sources of frequency of soma-clonal variation. Hortscience, 29: 1232-1237.
12. M araschin M (1998). Variação somaclonal, metabolismo de carbono e caracterização bioquímica e imunológica nos cultivos ce-lulares de M andevilla velutina (M ART) WOODSON (Apocynaceae). M aster’s the-sis, Departamento de Bioquímica, Univer-sidade Federal do Paraná, Curitiba, PR, Brazil.
13. Berlin J (1990). Screening and selection for variant cell lines w ith increased levels of secondary metabolites. In: Charlw ood BV & Rhodes M JC (Editors), Secondary Products from Plant Tissue Cultures. Clarendon Press, Oxford, England. 14. De Klerk GJ (1990). How to measure
so-maclonal variation. Acta Botanica Neer-landica, 39: 129-144.
15. Saunders JW, Acquaah G, Renner KA & Doley WP (1992). M onogenic dominant sulfonylurea resistance in sugarbeet from somatic cell selection. Crop Science, 32: 1357-1360.
16. M antell SH & Smith H (1983). Cultural factors that influence secondary metabo-lite accumulations in plant cell and tissue cultures. In: M antell SH & Smith H (Edi-tors), Plant Biotechnology. Cambridge University Press, Cambridge, England. 17. Fujita Y (1988). Shikonin production by
plant (Lithospermum erythrorhizon) cell cultures. In: Bajaj YPS (Editor), Biotech-nology in Agriculture and Forestry: M e-dicinal and Aromatic Plants I. Vol. 4. Springer-Verlag, Berlin, Germany. 18. Fujita Y & Tabata M (1987). Secondary
metabolites from plant cells: pharmaceu-tical applications and progress in commer-cial production. In: Somers DA, Hackett WP, Biesboer DD & Green CE (Editors),
Plant Tissue and Cell Culture. Alan R. Liss, Inc., New York, NY, USA.
19. Ushiyama K (1991). Large scale culture of ginseng. In: Komamine A, M isaw a M & DiCosmo F (Editors), Plant Cell Culture in Japan. CM C, Tokyo, Japan.
20. M urashige T & Skoog D (1962). A revised medium for rapid grow th and bioassays
w ith tobacco tissue cultures. Physiologia Plantarum, 15: 473-497.
21. George EF & Sherrington PD (1984). Plant Propagation by Tissue Culture. Eastern Press, Reading, England, 12-22. 22. Schripsema J, M eyer AH, Iren F van,
Hoopen HJG & Verpoorte R (1990). Dis-similation curves as a simple method for the characterization of grow th of plant cell suspension cultures. Plant Cell, Tissue and Organ Culture,22: 55-64.
23. Yunes RA, Pizzolatti M G, Sant’Ana AEG, Haw kes GE & Calixto JB (1993). The struc-ture of Velutinol A, an anti-inflammatory compound w ith a novel pregnane skel-eton. Phytochemical Analysis,4: 76-81. 24. M araschin M , Sugui JA, W ood KV,
Bonham C, Lanças FM , Araujo PS, Yunes RA, Verpoorte R & Fontana JD (2001). Supercritical CO2 extraction of velutinol A
from M andevilla velutina (Apocynaceae) cultured cells and M ALDI-TOF M S analy-sis. Biotechnology Letters, 23: 77-82. 25. Stafford A (1986). Genetics of cultured
plant cells. In:M orris P (Editor), Second-ary M etabolism Plant Cell Culture. Cam-bridge University Press, CamCam-bridge, Eng-land.
26. Ohta S & Verpoorte R (1992). Some ac-counts of variation (heterogeneity and/or instability) in secondary metabolite pro-duction by plant cell cultures. Annual Re-port of Natural Science and Home Eco-nomics, 32: 9-23.
27. Bright S, Jarret V, Nelson R, Creissen G, Karp A, Franklin J, Norbury P, Kueh J, Rognes S & M iflin B (1983). M odification of agronomic traits using in vitro technol-ogy. In: M antell SH & Smith H (Editors),
Plant Biotechnology. Cambridge Univer-sity Press, New York, NY, USA. 28. Phillips RL, Kaeppler SM & Olhoft P
(1994). Genetic instability of plant tissue cultures: Breakdow n of normal controls.
Proceedings of the National Academy of Sciences, USA, 91: 5222-5226. 29. M eins Jr F (1983). Heritable variation in
plant cell cultures. Annual Review of Plant Physiology, 34: 327-346.
30. Linacero R & Vázquez AM (1993). Soma-clonal variation in rye. M utation Research, 302: 205-210.
31. Welham KJ, Domin M A, Scannell DE, Cohen E & Ashton DS (1998). The
charac-terization of microorganisms by matrix-assisted laser desorption/ionization time-of-flight mass spectrometry. Rapid Com-munications in M ass Spectrometry, 12: 176-180.
32. Fontana JD, M araschin M , Buchi DF, Cant ao M P, Tof ol M , Peixot o M L & Verpoorte R (1998). Cell heterogeneity and grow th analysis of M andevilla velutina
(Apocynaceae) cultured cells. In: Proceed-ings of the 20th Symposium on Biotech-nology for Fuels and Chemicals, Oak Ridge National Lab., Gatlinburg, TN, USA, M ay 1998, 63.
33. Verpoorte R (1990). The production of plant secondary metabolites. In: Dekkers JJ, Plass HC van der & Vuijk DH (Editors),
AgriculturalBiotechnology in Focus in the Netherlands. Pudoc, Wageningen, The Netherlands.
34. Tremblay L, Levasseur C & Tremblay FM (1999). Frequency of somaclonal variation in plants of black spruce (Picea mariana, Pinaceae) and w hite spruce (P. glauca, Pinaceae) derived from somatic embryo-genesis and identification of some factors involved in genetic instability. American Journal of Botany, 86: 1373-1381. 35. Sierra M I (1991). Aspects of indole
alka-loid accumulation in Tabernaemontana tis-sue cultures: differentiation, peroxidases and stability. Doctoral thesis, Leiden Uni-versity, Leiden, The Netherlands. 36. Schripsema J & Verpoorte R (1992).
Fac-tors related to the indole alkaloid produc-tion in cell suspension cultures of Taber-naemontana divaricata. Planta M edica, 58: 245-249.
37. Speicher A, Hollemeyer K & Heinzle E (2001). Rapid detection of chlorinated bis-bibenzyls in Bazzania t rilobat a using M ALDI-TOF m ass spectrom etry. Phy-tochemistry, 57: 303-306.
38. Sugui JA, Bonham C, Lo SC, Wood KV & Nicholson RL (1998). M ALDI-TOF analy-sis of mixtures of 3-deoxyanthocyanidins and anthocyanins. Phytochemistry, 48: 1063-1066.