*Corresponding author, Email Address: tokhmechi@ut.ac.ir (B.Tokhmechi)
Using Bacillus Cereus as a Geo-Biological Marker
For Gold Prospecting in Iran
B. Tokhmechi1*and M. Mamarabadi2
1School of Mining, Petroleum and Geophysics Engineering, Shahrood University of Technology 2
Department of Plant Protection, Faculty of Agriculture, Shahrood University of Technology
Received 24 June2012; Received in revised form 3 October 2012; accepted 1 December 2012
Abstract
Several methods have been developed for gold exploration in the past, among which biological base method is known to be the most efficient with least expenses. This method can also be used for latent gold prospects exploration. In the present study, the possibility of applying Bacillus cereus frequency in soil as a biological marker was investigated for the exploration of latent gold prospecting in Iran. The study was performed on three gold sources in Iran known as Moteh, Zarmehr and Mahallat, however, the major focus was on Mahallat gold reserve. The results of bacterial cultivation showed that no bacteria have been isolated in samples taken from Moteh soil. On the other hand, the presence of bacteria was observed in cultural media which were prepared from the collected samples from Zarmehr and Mahallat. In Mahallat gold reserve the frequency of bacteria was noticeable, particularly in the soils with in-situ fine-grained. In addition, it was seen that when the gold grad increases the bacterial frequency of Bacillus cereus will also increase. Finally, a linear correlation was developed between bacterial frequency and the gold semi-quantified grad. Using this correlation the monitoring of semi-quantified gold grad can be undertaken.
Key words: Bacteria, Bacillus Cereus, Indicator, Gold Source, Biological Marker
1- Introduction
The price of gold has been increased in the world market during recent years. This has resulted in several new exploration activities in gold bearing deposits. Gold prospects exploration is exposed to significant complexity and difficulties such as gold reserve genesis diversity, uncorrelated spatial distribution of gold and severe variability in gold content. It is clear that using more than one exploration method will be beneficial in terms of gaining a better knowledge of these influencing parameters. Several methods have been used for the gold exploration in the past including Geochemical and isotopic methods, geophysical methods, tectonic base methods, lineament studies, remote sensing, application of geographical information system (GIS) and bio-geo chemical methods.
Geochemical and isotopic methods are more commonly used for gold exploration and numerous investigations and literatures have been published in this area. For example, Whitehead and Davies used the ratio of CO2/CaO (which
represents the ratio of calcite to dolomite) and arsenic frequency in order to discriminate the gold anomalies (Whitehead and Davies, 1988). Xuejing and Xueqiu with their extensive experiences in gold exploration in china proposed that a certain level of the gold grade threshold should be considered in order to consider a region suitable for gold exploration. This threshold is about 4 ppb in floodway sedimentations (Xuejing and Xueqiu, 1991). Some other studies on gold geochemical exploration include: - Quartz fluid inclusions enrichment
related to CO2 below 350ºC temperature (Burlinson, 1991);
- The ratio of CO2 frequency in fluid inclusions for mesothermal gold exploration (Diamond et al., 1990); - The relation of different elements
inclusions in the lime environment with Caroline type gold (Arehart and Donelick, 2006);
geochemical marker for the gold regional explorations (Bellehumeur and Jebrak, 1993);
- Optimization of sampling environment (Tingley and Castor, 1999);
- Samples dimension (Abdallah Gad Darwish and Poellmann, 2010);
- SSamples preparation procedure (Delaney and Fletcher, 1999).
Furthermore, there are several investigations that used different methods in order to process the exploration data and gold anomalies identification, for instance using fractal method for anomalies identification (Deng et al., 2010).
Geophysical methods are also used for gold exploration. For example magnetic assay, radiometry and electrical methods were used to identify the alteration of epithermal gold reserves (Irvine and Smith, 1990). They tested their hypothetical suggestion on six identified reserves in Australia, New Zealand, Island and America and gained promising results. Other methods like gravimetric and magnetic assay were used for the gold anomalies exploration as well but these methods were used in the reserve where the host rock was iron ores and the results showed that the magnetic and dense anomalies were compatible to gold enrichment (Dentith et al., 1993). In fact, they used samples from control regions to compare and identify enriched area. However, some researchers used well logging in order to explore the gold related alterations (Pflug et al., 1997). From the above section it can be concluded that in the researches where geophysical methods were used, the main aim was to identify the related alteration with gold or with gold host rock.
Gold explorations in special tectonic environments and using lineaments as a gold marker have also been considered in past studies. Examples of this include:
- Direct relation of fractures frequency with gold enrichment (Trippa and Vearncombe, 2004);
- Gold reservation in open fractures and identification of open fracture zones for sampling (McKeagney et al., 2004); - Gold exploration in shear zones
(Ghavami-Riabi et al., 2010);
- Gold exploration in volcanic arcs (Herrington et al., 2010);
Since the gold enrichment is generally happening in the regions with special structure, remote sensing and GIS base methods are currently used in gold exploration activities. For example El Shazly and coworkers used information obtained lineaments, rock units, drainage system and geomorphology in order to identify gold exploration promising regions in Egypt (El Shazly et al., 1988). Other pioneers described how to use GIS for gold exploration (Bonham-Carter, 1997). A detailed investigation was performed on GIS application for epithermal gold exploration (Rattenbury and Partington, 2003). Recently, Gaber and coworker used ASTER data in order to explore the zones with a good potential for gold mineralization (Gaber et al., 2010).
Huleatt and Jaques (2005) presented a suitable classification for gold exploration in Australia from 1976 till 2003.
tree is more useful than other sample. At the same time, Dunn in Saskatchewan, Canada found that the trees named Alnus crispa and Alnus rugosa have gold absorption tendency much more than the other tree species (Dunn, 1986). He also took some samples from other trees like Fir and Alder and from their ashes realized that the trees in principle have gold absorption and enrichment ability. This character can be used as a marker for gold exploration. Similar investigation was done in America and similar results were obtained, which means the trees have gold absorption and enrichment ability lend them from soil (Busche, 1989). Perhaps, one of the promising studies was performed in the tropical rainy region in New Guinea (McInnes et al., 1996) where they introduced a tree which can be used as a suitable marker for gold mineralization.
Large attention has been paid to the microbiological studies for gold prospects exploration during past years. This method seems to be important because it is a cheap method and that it allows tracing of gold at depth. The first investigation on this area was performed in Australia (Reith et al., 2005). Reith et al., have studied the bacterial concentration of Bacillus cereus as a gold marker in Tomakin Park gold mine which is located in the south east of New South Wales State in Australia. They found that, the amount of gold, arsenic and Bacillus cereus frequency were enriched in the upper part of gold sources. They also recorded less enrichment on antimony, bismuth and lead in the same regions. Interestingly, they discovered a direct correlation between the increase of gold grade and Bacillus cereus frequency. In a similar investigation, the relation between nitrate and nitrite frequency and corresponding bacteria living on under surface water were studied with located mineralization at regional excavation well in Japan (Suzuki et al., 2009). In their study they presented a depth based zonation system for the reserve according
to nitrate, nitrite and related bacterial data. This zonal system apparently had the ability to be extended. Several studies have been performed by Phanikumar and McGuire, 2010, Borovicka et al., 2010, Reid and Hill, 2010, Lisitsin et al., 2010 and Nimick et al., 2010, to investigate gold exploration, however, these works belong to different countries, using different biological compounds and in different biological sampling condition with different kind of gold mineralization. This increased trend of research in this area during recent years shows the efficiency of microbiological studies in gold exploration. The biological research on gold tracing was performed in Iran by Mehrnia in 2006. He collected geochemical and geo-microbiological samples from mineralized clay units in promising regions of gold Tikmedash index. He also proposed an appropriate medium for evaluation of different bacterial species particularly the resistant type to environmental changes and at the same time he assayed the quantity of gold grade. His studies showed that the incidence of bacterial population record was often in geochemical gold halo and some of the other metallic compounds. The results showed that the frequency of Bacillus cereus was considerable and the geometrical locus of bacterial colonies was coincident on the clay horizons and it was located around the mineralized vein with more than 300 milligram per ton gold grade.
2- Fields of study
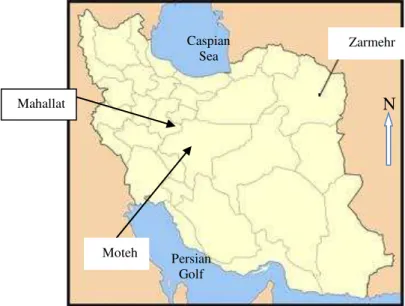
This study was performed on collected samples from the two identified gold mines and one of the identified gold reserves in Iran. The fields used in this study were Moteh gold mine in Isfahan province and Zarmehr gold mine in Khorasan Razavi province and the gold reserve of Mahallat in Markazi province. The geographical location of these regions is presented in Figure 1.
Moteh gold mine is geographically located at 50° 47´ longitude and 33° 37´ latitude. It is about 270 km away southwest of Tehran and 50 km far from the cities of Golpayegan, Delijan and Meyme. This mine is located on the rather low mountain chain in the south of Delijan, at northwest of Meyme and northeast of Golpayegan. The distance of Moteh gold mine society from the village of Moteh (located beside Golpayegan road) is about 8-10 km. The main indexes in the auriferous region of Moteh are the following gold mines: Chah-Khatoon, Senjedeh, Darre-Ashki, Tange-Zar, Cheshmeh-Gohar, Ghorom-Ghorom, Chah-Bagh, Chah-Allame and Se-Kolop. The aforementioned gold mines were often formed in the tension of various cleavages regions. They were also formed from the concentration of metallic auriferous minerals such as auriferous pyrite and calico-pyrite. The mineralization characteristics of these golds are depended on siliceous and cerosite, and host rocks including shear quartz veins and pyrite.
Zarmehr gold mine is located at 58° 56´ longitude and 35° 13´ latitude in southwest of 1:100000 Feyzabad sheet. It is 40 km far from the city of Kashmar and located in the road between Kashmar and Torbat Hydarieyeh (The website of Sepahan Zamin Rad company). The study was included the recent alluvial in Zarmehr and extended to south of Darouneh fault. The upper outcrops were included Eocene volcanic and intrusive massive granodiorite in the north of Kashmar in which several indexes of gold
and copper have been explored (Zar website). In fact, Zar Mountain is part of intrusive – volcanic belt of north of Darouneh fault. The region rock units include various tuffs, ignimbrite, diabase dikes, andesitic to dacite volcanic and intrusive granitoeid rocks. The minerals are located in quartz-hematite veins corresponding to structures of the region. Mineralization in the Zar mountain region is not limited to any special alteration zone but can be observed in most alteration zones. It is mostly restricted on the joints, fractures and faults. Substitution of mineralized solutions is associated with local alteration and color changes in the host rocks (Zar website).
Mahallat gold reserve is located at 50° 25´ longitude and 33° 58´ latitude close to the city of Mahallat. In this reserve gold has been enriched in quartz veins. Little geological information is available about this reserve. In some reports the genesis of gold in Mahallat gold reserve is known to be related to high temperature paragneiss minerals like Chalcopyrite.
3- Sampling
Sampling was carried out in three phases in the studied regions. At first stage one sample was collected from the topsoil, fine grain and virgin soil of each studied area. Appropriate cultural media was prepared and bacterial isolation from soil and subculture preparation was performed afterwards.
Based on the results obtained from the first sampling stage, the targeted region was selected for supplementary studies. Mahallat gold reserve was selected for performing additional studies because of more bacterial frequency in this region. Also, it was decided to collect more sample from Mahllat gold reserve in order to do a practical and exploration studies in this region.
reserve. The aim of this sampling stage was to identify the relation between Bacillus cereus frequency and frequency of gold grade and also doing investigation about using the ability of this bacterial frequency as a marker for exploration of gold latent sources.
In the third round of sampling, three samples were collected from the region with low, medium and high amount of gold grade in Mahallat gold reserve, respectively. The aim of this sampling
stage was to study the semi-quantified relation of gold grade with Bacillus cereus frequency.
4- Cultural media and recipe
Collected soil samples were cultivated after preparing serial dilution. Bacterial identification was carried out and Bacillus cereus colonies were counted. Bacterial cells of Bacillus cereus are rod-shape as demonstrated in figure 2.
Figure1. Geographical location of three studied regions.
(a) (b)
Figure 2. Bacillus cereus bacterial cells under light microscopy with 100x (a) and 40x (b) magnification.
5 µm 5 µm
Zarmehr
Mahallat
Moteh Persian
Golf Caspian
Sea
6
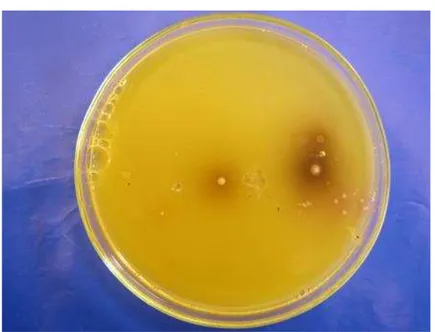
Figure 3. Bacillus cereus colonies grown on the selective medium.
Selective medium was used in order to isolate, identify and counting of Bacillus cereus bacterial colonies from soil samples. The number of used selective media was 22310 and the medium components are listed in Table 1 (Brown et al., 1958).
After above preparation final PH of medium should be adjusted to 7.1 ± 0.2 at 37°C. Prepared medium should be kept below 8°C temperature and has to be protected from the direct light. For medium preparation 43 gram from the aforementioned component cited in Table 1, dissolved in 900 milliliters distilled water and autoclaved at 121°C and 1
atmosphere pressure for 15 minutes. Medium was cooled down till 45-50°C and 100 milliliters yolk were added to the solution. Finally, 10 milligrams polymyxin B was also added to medium as antibiotic.
(a)
(b)
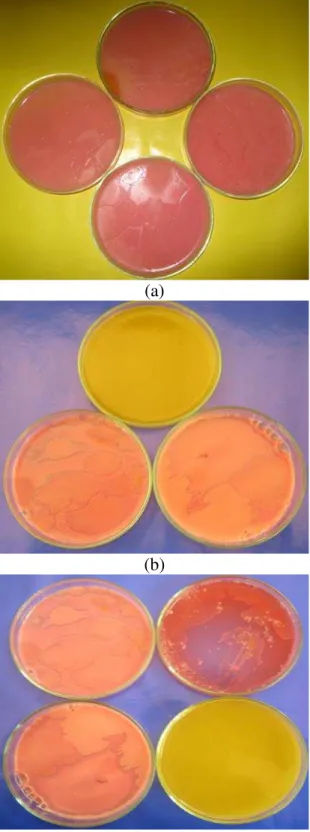
Figure 4. Color changing in red phenol to yellow because of Bacillus cereus inability in mannitol fermentation.
The produced enzyme by Bacillus cereus called Lecithinase which is able to hydrolyze existed lecithin in the yolk. This produces a white sedimentation from the hydrolyzed lecithin around the bacterial colonies. Bacillus cereus colonies possess unflatten and dry surface and produce a pink halo around the white sedimentation
(figure 4) which make them
distinguishable from the types of bacteria (Rayan and Ray, 2004).
5-Bacterial isolation from soil and results
Serial dilution technique was used for bacterial isolation and estimation of their population. For all 12 soil samples the following dilutions in distilled water were prepared: 1∕5, 1/10, 1/25 and 1/50, respectively.
For example in order to prepare 1/5 diluted soil sample, we added up to 5 ml of total volume sterile distilled water to 1 gram selected soil sample. Also, for
were quantified for all dilution of 12 samples.
The colony forming unit calculation result obtained from Bacillus cereus frequency for the three primary samples (one sample from each studied region), six
samples from second round of sampling (from Mahallat gold reserve) and three collected samples from third round of sampling (belongs to Mahallat gold reserve) are presented in Tables 2, 3 and 4, respectively.
(a)
(b)
(c)
Table 2. Colony Sample III II I III II I III II I Colony number replication in 0.1
ml volume 0 0 0 11 8 7 12 11 12 5 1 Prepared dilutions 0 0 0 1 0 0 11 11 11 10 1 0 0 0 0 0 0 6 6 6 25 1 0 0 0 0 0 0 3 3 3 50 1 Low grade triple cave Medium grade triple cave Triple cave Low grade single cave Medium grade single cave High grade single cave sample III II I III II I III II I III II I III II I III II I Colony number replication in 0.1
ml volume 8 9 11 0 0 0 11 12 12 3 3 4 21 21 22 24 24 24 5 1 Prepared dilutions 2 7 7 0 0 0 9 12 9 4 1 2 19 18 19 21 20 22 10 1 4 7 4 0 0 0 4 6 4 2 2 2 18 10 10 3 3 3 25 1 4 6 3 0 0 0 3 5 3 0 0 0 10 10 10 1 1 3 50 1
Average gold grade about 400ppb Average gold grade
about 100ppb Average gold grade about
10ppb Sample III II I III II I III II I Colony number replication in 0.1
ml volume 46 54 50 33 35 37 20 23 17 5 1 Prepared dilutions 33 29 31 20 20 20 15 17 13 10 1 21 23 21 15 16 14 9 6 6 25 1 2 0 2 0 1 0 0 0 0 50 1 6- Discussion
As it can be observed from Table 2, the collected soil samples from Moteh gold mine had no enrichment to Bacillus
plant coverage. Unfortunately, Moteh gold mine is not a rich region from the plant coverage point of view. Therefore, the incidence of Bacillus cereus is almost impossible in this condition and it may be concluded that Bacillus cereus is not a good marker for gold prospect exploration in Moteh gold mine. However, this conclusion is not extendable because there was only one sample available from Moteh gold mine.
Based on the results shown in Figure 5b and Table 2, the collected samples from Zarmehr gold mine formed relatively high number of colonies in high concentration samples. The reason for this can be related to the high bacterial frequency in soil sample. But, as it can be seen from Figure 5b and Table 2 again, the collected samples from Zarmehr gold mine did not formed any special colonies in the low concentration samples. This may be due to an experimental error or lack of appropriate condition during cultivation and incubation. It may be concluded that Bacillus cereus can be used as a biological marker for exploration of gold prospect in Zarmehr gold mine. However, it is important that cultivation has to be done in the low concentration and high accuracy. Of course, this conclusion is not extendable too because of limited number of samples which were collected from Zarmehr gold mine.
Fortunately, 10 samples were available for investigation from Mahallat gold reserve. As it was presented in Figure 5c and Tables 2, 3 and 4, Bacillus cereus formed colonies in the all samples but the collected sample from the medium grade triple cave region.
According to the results presented in Tables 2, 3 and 4, bacterial frequency was reduced in low concentrations. Since there was enough studied samples available for Mahallat gold reserve, it can be said with a greater degree of confidence that Bacillus cereus was a good biological marker in this gold reserve.
Colony forming unit frequency variations for Bacillus cereus are presented in Table 4 for different dilution based on semi-quantified gold grade. As it can be observed in this Table, colony forming unit frequency is increasing with an increase in average gold grade in each region. These variations are modeled in Figure 6. For example, in this figure and for the dilution 1/5, the relation between Bacillus cereus colony forming unit frequency variation and gold grade to ppb is reported. Since the presented relationship is linear, it will appropriately be extendable too. Therefore, it seems that using this method and having enough samples which statistically are significant, it will be possible to present an idea about semi quantified gold grade after bacterial isolation and counting obtained colonies.
Figure 6. The relationship between average gold grade variation to ppb and Bacillus cereus colony forming unit frequency in Mahallat gold reserve.
0 10 20 30 40 50 60
0 100 200 300 400 500
Average gold grade (ppb)
1of50
Colony forming unit frequency= gold grade × 0.07+23
7- Conclusion remarks and future work In the present study, the possibility of using Bacillus cereus frequency in soil as a biological marker for tracing of latent gold prospecting in Iran was studied. Several soil samples were collected from Moteh and Zarmehr gold mines and also Mahallat gold reserve. The soil samples were serial diluted in distilled sterile water and cultivated in the proper medium. The cultivation results showed no Bacillus cereus in single collected sample from Moteh gold mine. The bacterium was found in the single collected sample from Zarmehr gold mine only in the high concentration repetitions. In Mahallat gold reserve bacterial frequency in the fine grain soil not only was noticeable but also the frequency of Bacillus cereus was observed to increase with increasing the gold grade. Finally, an equation was
developed in order to have a semi- quantified estimation of the gold grade based on Bacillus cereus frequency. However, in order to reach to a more valid equation more samples need to be collected from Mahallat gold exploration area. The limited number of studied samples was one of the drawbacks in the present study. Similar methodology with larger number of samples is recommended to be conducted in the future in other regions.
8-Acknowledgements
The author would like to acknowledge Mr. Abbas Ali Heydari and Mr. Seyed Ahmad Meshkani for their efforts during sampling and also interpreting the results. Financial support by Shahrood university of Technology is gratefully acknowledged.
9-References
1- Abdallah Gad Darwish M. and Poellmann H., 2010, Geochemical exploration for gold in the Nile Valley Block (A) area, WadiAllaqi, South Egypt, Chemie der Erde, Vol.70, pp. 353–362.
2- Arehart G.B. and Donelick R.A., 2006, Thermal and isotopic profiling of the Pipeline hydrothermal system: Application to exploration for Carlin-type gold deposits, Journal of Geochemical Exploration, Vol. 91, pp. 27–40.
3- Bellehumeur C. and Jebrak M., 1993, Regional heavy mineral survey in the exploration for gold using regression: Grenville Province, Southwestern Quebec, Journal of GeochemlcalExploratlon, Vol. 47, pp. 45-61.
4- Bonham-Carter G.F., 1997, GIS Methods for Integrating Exploration Data Sets, Fourth Decennial International Conference on Mineral Exploration, pp. 59–64.
5- Borovicˇka J., Dunn C.E., Gryndler M., Mihaljevic M., Jelinek E., Rohovec J., Rohoskova
M. and Randa Z., 2010, Bioaccumulation of gold in macrofungi and ectomycorrhizae from the vicinity of the Mokrsko gold deposit, Czech Republic, Soil Biology & Biochemistry, Vol. 42, pp. 83–91.
6- Brown E.R., Moody M.D., Treece E.L. and Smith C.W., 1958, Differenzial diagnosis of Bacillus cereus, Bacillus anthracis and Bacillus cereus var. mycoides, Journal of Bacteriology, Vol. 75, pp. 499-509.
7- Burlinson K., 1991, Decrepitation in gold exploration. A case history from the Cotan prospect, N.T., Journal of Geochemical Exploration, Vol. 42, pp. 143-156.
8- BUSCHE F.D., 1989, Using plants as an exploration tool for gold, Journal of Geochemical Exploration, Vol. 32, pp. 199-209.
9- Delaney T.A. and Fletcher W.K., 1999, Efficiency of cyanidation in gold exploration using soils, Journal of Geochemical Exploration, Vol. 66, pp. 229–239.
11- Dentith M.C., Trench A. and Jones M., 1993, Geophysical exploration for Archaean gold: a case study from the Southern Cross Greenstone Belt, Western Australia, Journal of Applied Geophysics, Vol. 30, pp. 175-186.
12- Diamond L.W. and Marshall D.D., 1990, Evaluation of the fluid-inclusion crushing-stage as an aid in exploration for mesothermal gold-quartz deposits, Journal of Geochemical Exploration, Vol. 38, pp. 285-297.
13- Dunn C.E., 1986, Biogeochemistry as an aid to exploration for gold, Platinum and Palladium in the Northern Forests of Saskatchewan, Canada, Journal of Geochemical Exploration, Vol. 25, pp. 21-40.
14- El Shazly E.M., Abdel Hady M.A. and El Nasharty F.A., 1988, Gold Exploration by Remote Sensing Techniques in the Wadi E1 Allaqi Area, Eqypt, Photogrammetria (PRS), Vol. 42, pp. 303-310.
15- Gabr S., Ghulam A. and Kusky T., 2010, Detecting areas of high-potential gold mineralization using ASTER data, Ore Geology Reviews, Vol. 38, pp. 59–69.
16- Ghavami-Riabi R., Seyedrahimi-Niaraq M.M., Khalokakaie R. and Hazareh M.R., 2010, U-spatial statistic data modeled on a probability diagram for investigation of mineralization phases and exploration of shear zone gold deposits, Journal of Geochemical Exploration, Vol. 104, pp. 27–33.
17- Herrington R.J., Scotney P.M., Roberts S., Boyce A.J. and Harrison D., 2010, Temporal association of arc–continent collision, progressive magma contamination in arc volcanism and formation of gold-rich massive sulphide deposits on Wetar Island (Banda arc), Gondwana Research, Article in Press.
18- Holbrook R. and Anderson J.M., 1980, An improved selective and diagnostic medium for theisolation and enumerationof Bacillus cereus in food, Canadian Journal of Microbiology, Vol. 26 (7), pp. 753-759.
19- Huleatt M.B. and Jaques A.L., 2005, Australian gold exploration 1976–2003, Resources Policy, Vol. 30, pp. 29–37.
20- IRVINE R.J. and SMITH M.J., 1990, Geophysical exploration for epithermal gold deposits, Journal of Geochemical Exploration, Vol. 36, pp. 375-412.
21- Lisitsin V.A., Moore D.H., Olshina A. and Willman C.E., 2010, Undiscoveredorogenic gold endowment in Northern Victoria, Australia, Ore Geology Reviews, Vol. 38, pp. 251– 269.
22- McInnes B.I.A., Dunn C.E., Cameron E.M. and Kameko L., 1996, Biogeochemical exploration for gold in tropical rain forest regions of Papua New Guinea, Journal of Geochemical Exploration, Vol. 57, pp. 227-243.
23- McKeagney C.J., Boulter C.A. Jolly1 R.J.H. and Foster R.P., 2004, 3-D Mohr circle analysis of vein opening, Indarama lode-gold deposit, Zimbabwe: implications for exploration, Journal of Structural Geology, Vol. 26, pp. 1275–1291.
24- Mehrnia S.R., 2007, The role of microbiological agents in identification of promising mineral regions (case study: Tikme-dash gold index in the Eastern Azerbaijan Province. 28th earth science conference, Iranian geological and mineral exploration organization, Tehran, Iran.
25- Nimick D.A. Gammons C.H. and Parker S.R., 2011, Diel biogeochemical processes and their effect on the aqueous chemistry of streams: A review, Chemical Geology, Vol. 252, pp. 202-213.
27- Phanikumar M.S. and McGuire J.T., 2010, A multi-species reactive transport model to estimate biogeochemical rates based on single-well push–pull test data, Computers & Geosciences, Vol. 36, pp. 997–1004.
28- Rattenbury M.S. and Partington G.A., 2003, Prospectivity models and GIS data for the exploration of epithermal gold mineralisation in New Zealand, Epithermal Au Prospectivity Report, Institute of Geological & Nuclear Sciences Ltd, 68 pages.
29- Reid N. and Hill S.M., 2010, Biogeochemical sampling for mineral exploration in arid terrains: Tanami Gold Province, Australia, Journal of Geochemical Exploration, Vol. 104, pp. 105–117.
30- Reith F., McPhail D.C. and Christy A.G., 2005, Bacillus cereus, gold and associated elements in soil and other regolith samples from Tomakin Park Gold Mine in southeastern New South Wales, Australia, Journal of Geochemical Exploration, Vol. 85, pp. 81–98. 31- Ryan K.J; Ray C.G (editors), 2004, Sherris Medical Microbiology: An Introduction
toInfectious Diseases (4th ed.), McGraw Hill. ISBN 0-8385-8529-9.992 pages.
32- Suzuki Y., Suko T., Yoshioka H., Takahashi M., Nanba K., Tsunogai U., Takeno N. and Ito K., 2009, Biogeochemical profiles in deep sedimentary rocks in an inland fore-arc basin, Central Japan, Chemical Geology, Vol.259, pp. 107–119.
33- Tingley J.V. andCastor S.B., 1999, Stream sediment exploration for gold and silver in Nevada — application of an old prospecting method using modern analytical techniques, Journal of Geochemical Exploration, Vol. 66, pp. 1–16.
34- Trippa G.I. and Vearncombe J.R., 2004, Fault/fracture density and mineralization: a contouring method for targeting in gold exploration, Journal of Structural Geology, Vol. 26, pp. 1087–1108.
35- Valente I., Minski M.J. and Peterson P.J., 1986, Biogeochemical Exploration for Gold at a Site in the Cordillera Cantabrica, Spain, Journal of Geochemical Exploration, Vol. 26, pp. 249-258.
36- Whitehead R.E. and Davies J.F., 1988, Discriminant analysis involving C02/CaO and arsenic in gold exploration, Journal of Geochemical Exploration, Vol. 30, pp. 243-253. 37- Xuejing X. and Xueqiu W., 1991, Geochemical exploration for gold: a new approach to