Annals of the University of Petroşani, Economics, 12(3), 2012, 107-114 107
QUALITY SERVICES EVALUATION MODEL BASED ON
DEDICATED SOFTWARE TOOL
ANDREEA CRISTINA IONIC
Ă
, MONICA LEBA,
EDUARD EDELHAUSER, LUCIAN LUPU-DIMA
ABSTRACT: In this paper we introduced a new model, called Service Quality (SQ),
which combines QFD and SERVQUAL methods. This model takes from the SERVQUAL method the five dimensions of requirements and three of characteristics and from the QFD method the application methodology. The originality of the SQ model consists in computing a global index that reflects the customers’ requirements accomplishment level by the quality characteristics. In order to prove the viability of the SQ model, there was developed a software tool that was applied for the evaluation of a health care services provider.
KEY WORDS: Quality; QFD; SERVQUAL; Model; Software Tool; Quality
Management Tool.
JEL CLASSIFICATION: L15
1. INTRODUCTION
The transformations in the way of thinking and understanding the quality concept led to a wider area of its applicability.
In the past the quality was interpreted only as a statistic parameter that was related mainly to the products. Now, due to the client perspective introduction, the quality concept can also be applied to services field.
The characteristics and particularities of the services make it hard to give a generally acceptable definition. The aspects of quality (figure 1) make it difficult to
Assoc. Prof., Ph.D., University of Petroş
ani, Romania, andreeaionica2000@yahoo.com
Assoc. Prof., Ph.D., University of Petroşani, Romania, monicaleba@yahoo.com
Assoc. Prof., Ph.D., University of Petroşani, Romania, edi1ro2001@yahoo.com
108 Ionică, A.; Leba, M.; Edelhauser, E.; Lupu Dima, L.
define and quantify the services’ quality that is generally considered a measure of the clients’ requirements accomplishment.
The most known instrument in attempting to quantify the services’ quality dimensions is "The gap model" of service or SERVQUAL model developed by Parshuraman in 1985.
This conceptual framework was developed initially to measure customer perception of service quality for the financial service sectors but later extended to sectors such as hospitality, telecommunications and healthcare.
The main goal of this model is to determine the average gap score (between customer's perceptions and expectations) for each service attribute.
We have chosen from the quality management tools the QFD method. The approach of this method is to early eliminate starting from the design phase the gaps between customer expectations and perceptions.
Figure 1. The aspects of quality (Dragulanescu, 2003)
2. LITERATURE REVIEW
QFD transforms the customer needs into engineering characteristics for a product or service, prioritizing each product or service characteristic while simultaneously setting development targets for it.
The QFD method can be used for both tangible products and non-tangible services (Ionica et al., 2010).
QFD is a quality management tool focused on customer. It was primarily meant for products, but it can be easily applied for services too.
Quality Services Evaluation Model Based on Dedicated Software Tool 109
1996 and, in particular, healthcare by Chaplin and Terninko in 2000; Einspruch in 1996; Hallberg in 1999; Lim and Tang in 2000; Matsuda in 2000 (Chan et al., 2002).
There is a great amount of QFD resources available. Part of the QFD softwares were developed to help the QFD use in various applications, such as software evaluation (by Fawsy Bendeck of Universitat Kaiserslautern, Germany: http://www.agr.informatik.uni-kl.de/_bendeck/qfd/index.html), QFD Designer (by Qualisoft/ Fulfillment Services, USA: http://www.qualisoft.com), QFD Scope (by Integrated Quality Dynamics, US: http://www.iqd.com), QFD/CAPTURE (by International TechneGroup, US: http://qfdcapture.com), QFD2000 (by Total Quality Software, UK: http://www.qfd2000.co.uk), Qualica QFD (by Qualica Software, Germany: http://www.qualica.de), and VOCALYST (by Applied Marketing Science, US: http://www.ams-inc.com) (Chan, et.al., 2002). Herzwurm have performed a thorough analysis and evaluation of the QFD software tools.
3. RESEARCH METHODOLOGY
The advantages of combining the two methods, SERVQUAL and QFD, were identified by previous works in this field, like the paper “A QFD and SERVQUAL Approach to Hotel Service Design” (Ikiz et al., 2008).
The model from this paper integrates the best elements of SERVQUAL and QFD methodology.
Also, in literature, it is stated that only Miyoung and Haemoon have used SERVQUAL in house of quality design to measure customer satisfaction in return for service quality.
We introduce an alternative solution for services’ quality evaluation, a new model called Service Quality (SQ).
This is to compute an overall index that measures the level of customer requirements accomplishment.
For this reason there were followed the steps involved in the QFD methodology. In order to facilitate the QFD methodology implementation was designed and developed a dedicated software application that also computes the index.
As application for this methodology we chose the healthcare field. The customer requirements were captured using the techniques of questionnaire applied in two phases.
The first phase regarded general aspects about the respondents and their perception on the existing services.
The second phase had the goal of determining the specific and detailed customer requirements.
4. RESULTS
110 Ionică, A.; Leba, M.; Edelhauser, E.; Lupu Dima, L.
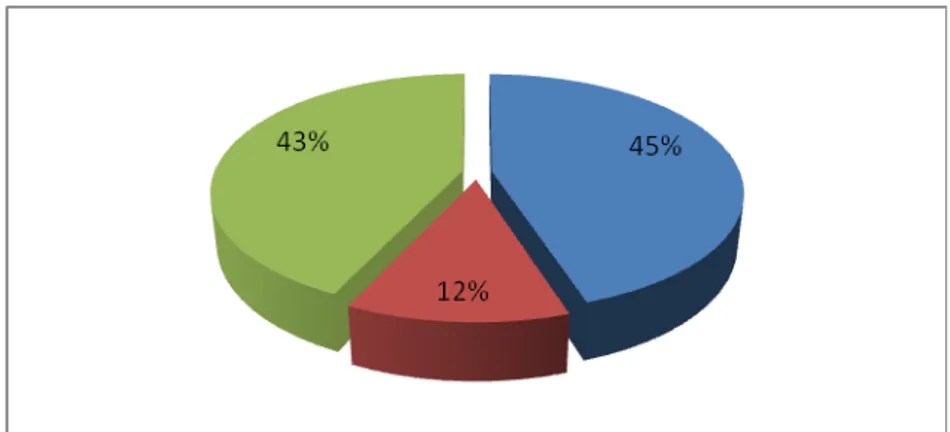
For the second question 5% of the respondents said that they use the services of the pharmacy for several days, 20% for one month or less, 45% for several months and the rest of 30% for several years (figure 3).
Figure 2. Frequency of services use
Figure 3. Duration of services use
Quality Services Evaluation Model Based on Dedicated Software Tool 111
Regarding the clients satisfaction, 75% of the respondents say they are satisfied by the services offered by the pharmacy and 25% are less satisfied. No respondent is completely satisfied or unsatisfied (figure 4). Compared to other pharmacies, the offered services were evaluated by the 30% of the responded as much better, 30% as better and the rest of 40% as the same (figure 5).
Figure 5. Compared services
35% of the responded declared that they will surely further use the services of the pharmacy, 45% probably and 20% possibly will (figure 6).
Figure 6. Further use of services
112 Ionică, A.; Leba, M.; Edelhauser, E.; Lupu Dima, L.
From the respondents, 70% appreciated that they encountered no problem related to the services and products offered by the pharmacy and 30% had all the problems encountered solved in time by the pharmacy’s personnel (figure 7).
The detailed customers’ requirements resulted from the second phase of questionnaires.
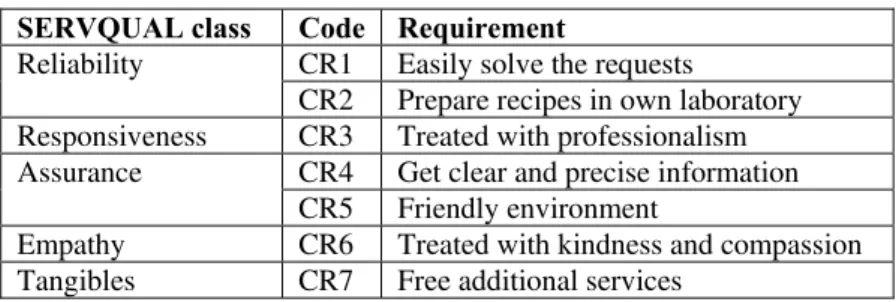
Combining the SERVQUAL and QFD methods, the customers’ requirements were grouped in five classes as follows:
Table 1. Customers’ requirements grouped in classes
SERVQUAL class Code Requirement
CR1 Easily solve the requests Reliability
CR2 Prepare recipes in own laboratory
Responsiveness CR3 Treated with professionalism
CR4 Get clear and precise information Assurance
CR5 Friendly environment
Empathy CR6 Treated with kindness and compassion
Tangibles CR7 Free additional services
The quality characteristics were also grouped in classes as follows:
Table 2. Quality characteristics grouped in classes
SERVQUAL class Code Characteristic
QC1 Waiting time in the queue QC2 Free blood sugar measurement
QC3 Free HTA measurement
QC4 Free cholesterol measurement Process
QC5 Free body weight measurement QC6 Explain understandable to the client QC7 Personnel with communication abilities QC8 Kind reception
People
QC9 Well trained personnel Physical environment QC10 Pleasant environment
In order to apply the model resulted from the combination of QFD and SERVQUAL we designed and developed a software application that computes a global index that reflects the customers’ requirements accomplishment level (figure 8).
In figure 9 is presented the global index resulted after improvements on the QC2 characteristic, by including the supplementary services of free blood sugar measurements for more clients.
In order to increase the customers’ requirements accomplishment level, we focused on introducing new or improved free supplementary services.
Quality Services Evaluation Model Based on Dedicated Software Tool 113
As can be seen the global index increased from 40.129% to 51.041%.
Figure 8. Global index
114 Ionică, A.; Leba, M.; Edelhauser, E.; Lupu Dima, L.
4. CONCLUSIONS
The paper developed the SQ model based on SERVQUAL and QFD methods for the evaluation of services quality. There was designed an own software application that computed a global satisfaction index based on the developed model.
The global index is a measure of the customers’ requirements accomplishment level by the quality characteristics.
There can be established a satisfaction grill based on the correlation between the general information resulted from the first phase of questionnaires and the computed index values. The proposed grill is presented in table 3.
Table 3. Satisfaction grill
Satisfaction level Index value
Completely unsatisfied 0 – 20 %
Unsatisfied 20 – 40 %
Satisfied 40 – 60 %
Very satisfied 60 – 80 %
Completely satisfied 80 – 100 %
REFERENCES:
[1]. Chan L.K.; Wu, M.L. (2002) Quality Function Deployment: A Literature Review,
European Journal of Operational Research, 143, pp. 463-497
[2]. Dragulanescu, N. (2003) Managementul calitatii serviciilor, Editura AGIR, Bucuresti
[3]. Herzwurm, G.; Reiss, S.; Schockert, S. (2000) The Support Of Quality Function
Development By The Customer Oriented Evaluation Of Software Tools, [Online],
Available at: http://www.qfd-id.de/en/articles/evaluation_tools/qfd_software_english.pdf [Accessed 10 September 2012]
[4]. Ikiz, A.K.; Masoudi, A. (2008) A QFD and SERVQUAL Approach to Hotel Service
Design, Isletme Fakultesi Dergisi, 9 (1), pp. 17-31, [Online], Available at:
http://web.deu.edu.tr/isletme/ifddergi/web_files/911731.pdf, [Accessed 24 October 2012]
[5]. Ionica, A.; Baleanu, V.; Edelhauser, E.; Irimie, S. (2010) TQM and Business Excellence,
Annals of the University of Petrosani, Economics, 10 (4), pp. 125-134