INTRODUCTION
Contrast sensitivity (CS) is the ability to recognize small diferen-ces in luminance or diferentiate two objects from each other and
the background(1,2). CS is an important part of functional vision that
is related to many activities of daily living and measuring it is one of the best ways to assess vision quality(3-5). Despite having normal visual
acuity measured by a Snellen chart, the satisfaction with the results of refractive surgery may vary relative to CS, and some eye diseases cause isolated loss of CS(4,6-8). Snellen acuity tests have a limited
abi-lity to detect ine changes in contrast because high contrast letters
(black on white) are used(9). Also, recent advances in knowledge
about refractive surgery, optical tissues, and glaucoma and macular diseases revealed that the Snellen acuity test is inadequate for early
detection of eye diseases and measurement of functional vision(6,10-12).
CS decreases in all stages of glaucoma and age-related macular degeneration (AMD) have been documented using diferent testing
methods(7,12-15). Glaucoma, cataract, and AMD patients suffer from
pro blems in vision-related activities of daily living and the inability to recognize targets in real world, which can be better identiied by CS tests than by visual acuity tests(14,16-18). The increasing importance of
visual quality and the need for accurate measurement of visual acuity has led to more interest in CS tests(12,19-21).
There are several clinical tests for measuring CS with letters or gratings(5,22-26). A limitation of CS tests is low reliability associated with
varying environmental conditions and the subjective nature of the tests. In particular, CS tests that use charts may be afected by
ina-Repeatability of contrast sensitivity testing in patients with age-related macular
degeneration, glaucoma, and cataract
Reprodutibilidade dos escores de sensibilidade ao contraste em pacientes com
degeneração macular relacionadas à idade, glaucoma e catarata
Selcuk kara1, Baran Gencer1, ISmaIl erSan1, Sedat arIkan1, Omer kOcaBIyIk1, HaSan alI tufan1, arzutaSkIran cOmez1
Submitted for publication: May 21, 2015 Accepted for publication: May 20, 2016
1 Department of Ophthalmology, Faculty of Medicine, Canakkale Onsekiz Mart University, Canakkale, Turkey.
Funding: No specific financial support was available for this study.
Disclosure of potential conflicts of interest: None of the authors have any potential conflict of interest to disclose.
Corresponding author: Selcuk Kara. Canakkale Onsekiz Mart Universitesi Tip Fakultesi, Goz Hastalıkları AD - Canakkale - 17000 - Turkey - E- mail: [email protected]
Approved by the following research ethics committee: Canakkale Onsekiz Mart University (#050. 99-151).
ABSTRACT
Purpose: To analyze the intrasession and intersession repeatability of contrast sensitivity (CS) measurements in patients with glaucoma, cataract, or age-related macular degeneration (AMD) and healthy controls.
Methods: CS measurements were performed using the OPTEC-Functional Vision Analyzer (FVA), which uses a standardized and closed (view-in) system. Measu-rements for patients with glaucoma, cataract, or AMD and healthy controls were repeated within 30 minutes (intrasession) and during two sessions (intersession), separated by one week to one month. Test-retest reliability and correlation were measured using the intraclass correlation coefficient (ICC) and coefficient of repeatability (COR).
Results: Ninety subjects (90 eyes) with visual acuity of 0.17 logMAR or higher in the cataract group or 0.00 logMAR in the other groups were included. During the first session, the ICC values were 0.87, 0.90, 0.76, and 0.69, and COR values were 0.24, 0.20, 0.38, and 0.25 for the control, glaucoma, cataract, and AMD groups, respectively. The reliability scores significantly improved during the second session, except in the glaucoma group. There was an acceptable floor effect and no ceiling effect at higher frequencies in the glaucoma and AMD groups.
Conclusion: In subjects with good visual acuity, the FVA system is useful for eva-luating CS and demonstrates good repeatability, as shown by ICC and COR. Because there is no ceiling effect, this system is beneficial for evaluation of early changes in CS, particularly in patients with glaucoma or AMD.
Keywords: Macular degeneration; Contrast sensitivity; Glaucoma; Age efect; Re-pro ducibility of results
RESUMO
Objetivo: Analisar a reprodutibilidade intrassessão e intersessão das medidas de sen sibilidade ao contraste (CS) em pacientes com degeneração macular relacionada à idade (AMD), glaucoma e catarata.
Método: As medidas de CS foram feitas pelo OPTEC-Funcional Visão Analyzer (FVA), que utiliza um sistema padronizado e fechado de avaliação da acuidade visual. Medidas em pacientes com AMD, glaucoma, catarata e nos controles saudáveis foram repetidas no prazo de 30 minutos (intrassessão) em duas visitas (intersessão), separadas por uma semana a um mês. A confiabilidade e correlação teste-reteste foram calculados por meio do coeficiente de correlação intraclasse (ICC) e coeficiente de reprodutibilidade (COR).
Resultados: Noventa olhos de 90 indivíduos foram recrutados com acuidade visual de 0,17 logMAR ou melhor em catarata e 0,00 logMAR nos outros grupos. A confiabili-dade da CS na primeira visita dos grupos normal, glaucoma, catarata e AMD foram, respectivamente, ICC 0,87; 0,90; 0,76; 0,69, e COR 0,24; 0,20; 0,38; 0,25. Os índices de confiabilidade foram significativamente melhorados nas segundas visitas, exceto no grupo glaucoma. Houve um efeito chão aceitável e nenhum efeito teto em frequências mais altas nos grupos glaucoma e AMD.
Conclusões: Em indivíduos com boa acuidade visual, o sistema FVA de avaliação da CS é útil e apresenta boa confiabilidade, como mostrado pelas análises de ICC e COR. Por não apresentar efeito teto, este sistema parece ser benéfico para a avaliação das alterações precoces de CS, especialmente no glaucoma e AMD.
dequate or uneven lighting, fading, the subject’s learning curve, and relections(2,3). The Functional Acuity Contrast Test (FACT) assesses ive
spatial frequencies (1.5, 3, 6, 12, and 18 cycles per degree (cpd)) and 9 levels of contrast for each frequency. FACT uses a small increment
(0.15 log unit) and a forced-choice method with three options(2).
Although the FACT test has greater reliability compared with other CS testing methods, administration of the CS test in a closed system, with charts on the screen inside the device, with a Functional Visual Acuity (FVA) device has additional advantages. These advantages include the ability to display contrast charts in a random order and the administration of the test with standardized lighting, which is
diicult to maintain under other conditions(3,27). A CS test is expected
to have a good reliability to diferentiate a small loss or detect real progression, which can be better achieved by a closed test system, which has inherently stable testing conditions.
To the best of our knowledge, there has been little research pu-blished about the comparative reliability of these devices for healthy controls and patients with eye disease. This study investigates the repeatability of the closed system FVA CS test in control subjects and in patients with glaucoma, cataracts and good Snellen visual acuity, or age-related macular degeneration (AMD).
METHODS
This prospective, observational study included patients with glaucoma, cataracts, or AMD and healthy control subjects. All subjects were recruited from the Eye Clinic at Canakkale Onsekiz Mart Uni-versity. Written informed consent was obtained from all participants following a comprehensive explanation of the study. The research was approved by the local clinical research ethics committee and complied with the tenets of the Helsinki Declaration.
The study included subjects between 40 and 70 years old to faci-litate enrollment of subjects with best corrected visual acuity (BCVA) of 0.00 logMAR for the groups without cataracts. One eye of each patient was included in the study. Subjects were not eligible to be included if they had ocular diseases other than glaucoma, cataracts, or AMD, refractive error <-3 or >3 diopters (D) sphere or >2.00 D cylin-der, or a history of previous eye surgery or laser treatment. Patients with psychiatric or neurologic disorders, poor compliance during the CS test, or who used systemic or ocular medications could afect CS were excluded. All patients underwent an ophthalmic examina-tion, including auto refractometry, BCVA evaluaexamina-tion, anterior segment bio microscopy, funduscopy, and IOP, measured with a Goldmann applanation tonometer (GAT).
The glaucoma group included subjects who were diagnosed with primary open-angle glaucoma (POAG) or normotensive glauco-ma (NTG). The inclusion criteria for patients with POAG were the cha-racteristic visual ield loss, glaucomatous optic neuropathy (having rim thinning or notching, retinal nerve iber layer defects, or disc hemorrhage and disc asymmetry between the eyes ≥0.2), and intrao-cular pressure (IOP) >21 mmHg. The inclusion criteria for patients with NTG were visual ield loss, glaucomatous optic neuropathy, and IOP ≤21 mmHg. Glaucomatous visual ield defects, which were repeatable in at least two standard automated perimetry evaluations, included at least one of the following: nasal step, arcuate scotoma, paracentral scotoma, or temporal wedge. All glaucoma patients had a grade 3 or 4 open angle according to the Shafer Classiication
System(29) and a mean deviation no worse than -6 dB.
In the cataract group, only eyes with a BCVA of 0.17 logMAR or better and a nuclear sclerosis of less than grade 2 were included. Nuclear sclerosis was graded by the slit-lamp method according to the Lens Opacities Classiication System III(28). The inclusion criteria for
the AMD group were retinal pigment epithelial abnormalities in the form of hypopigmentation or hyperpigmentation, without evidence of active choroidal neovascularization, and no prior treatment with any anti-vascular endothelial growth factor injections. The control
subjects had normal indings on a comprehensive eye examination (including anterior segment biomicroscopy and fundoscopy of the macula and optic nerve) and IOP <21 mmHg.
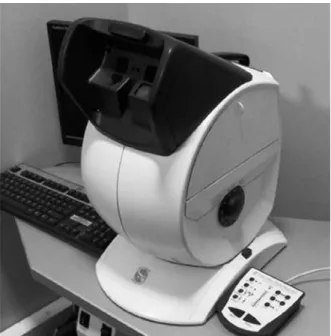
A closed-system CS testing device, the OPTEC-FVA (Stereo Optical Co, Inc., Chicago, IL, USA), was used to examine CS values under daytime
without glare. Figure 1 shows the FVA CS testing device. The FVA has
rotating slide packages for other visual functions, including visual acuity, disability glare, and stereo and color vision. The CS testing device contains the FACT chart, which uses three orientations for the gratings: oriented vertically or tilted 15º to the right or left. Subjects identiied the orientation of each grating and were required to guess when they could not determine the orientation of gratings.
The CS testing device controls light levels with sensors to achieve
consistent conditions for each test.This device supplies a target
lu-minance level of 85 cd/m2 for daytime conditions in compliance with
the American National Standards Institute (ANSI). It evaluates spatial frequencies using sine-wave grating charts of 1.5, 3, 6, 12, and 18 cpd. Figure 2 presents the sine-wave gratings charts for the frequencies
that the CS testing device used.Contrast was deined according to
the Michelson formula (C = [Lmaximum − Lminimum]/[Lmaximum + Lminimum],
C: Contrast, L: Luminance)(2).CS was measured during two sessions
separated by at least one week and up to one month (intersession).
Figure 1. The functional vision analyzer contrast sensitivity test device.
At each session, two measurements taken 30 minutes apart (intra-session). All tests were performed with the optimum refractive cor-rection and a natural pupil. All the subjects performed the CS test for the irst time during our study, and each test lasted approximately 10 minutes. The CS measurements were obtained by a single operator who was blinded to the patient’s group.
All the CS values were converted to logarithmic values. The test-retest reliability of the CS test was examined using the intraclass correlation coeicient (ICC) and the coeicient of repeatability (COR) and the corresponding 95% conidence interval (CI). The ICC was cal-culated with absolute agreement. The COR is calcal-culated as 1.96 times the standard deviation of the diference between the test and retest scores. An ICC value of 1.0 and a COR value of 0.0 represent perfect test-retest reliability(2). Reliability analyses were performed within
in-dividual sessions and between sessions for all groups. Possible loor and ceiling efects were evaluated by calculating the percentage of subjects with lowest and highest test scores, respectively, for each of the four tests at each spatial frequency and within each group.
Spearman rank-order correlations were used to investigate the possible correlation between age and changes in CS score. The Wil-co xon and Mann-Whitney U-tests were used to Wil-compare CS sWil-cores between groups. The Bonferroni correction, which applies a statistical signiicance level of 1/n times the “p” value (n= the number of com-parisons), was used to test for multiple comparisons to ensure that an appropriate level of signiicance was applied to the individual tests(30).
Statistical analysis was performed using SPSS software (Windows version 19.0; SPSS, Inc., Chicago, IL, USA), and statistical signiicance was deined as p<0.05.
RESULTS
The analysis was included 90 eyes of 90 Caucasian subjects, in-cluding healthy control (n=30; mean ± standard deviation age 47.1 ± 6.7 years; 15 males), glaucoma (n=13; age 59.6 ± 4.1 years; 8 males), cataract (n=29; age 56.3 ± 5.2 years; 14 males), and AMD (n=18; age 59.9 ± 4.6 years; 9 males) groups.
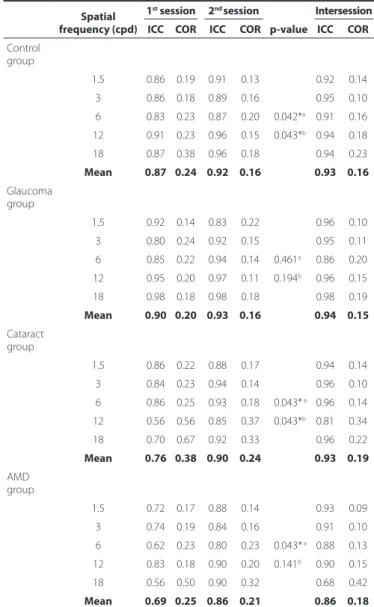
The test-retest reliability of the CS test, including ICC and COR, is shown in table 1. The reliability of the CS test in the control, glaucoma, cataract, and AMD groups were good at the irst session (ICC: 0.87 [95% CI 0.84 -0.9], 0.90 [CI 0.84 -0.96], 0.76 [CI 0.65 -0.87], and 0.69 [CI 0.59 -0.79], respectively; and COR 0.24, 0.20, 0.38, and 0.25, respecti-vely). However, at the second session, statistically signiicant increases were found in the reliability of the CS test, except in the glaucoma group (ICC: 0.92 [CI 0.88 -0.96], p=0.042; 0.93 [CI 0.88 -0.98], p=0.461; 0.90 [CI 0.86 -0.94], p=0.043; and 0.86 [CI 0.82 -0.9], p=0.043; and COR of 0.16, 0.16, 0.24, and 0.21 in the control, glaucoma, cataract, and AMD groups, respectively).
Figure 3 illustrates the mean CS score for all groups as a function of spatial frequency. The CS scores for the AMD group were signii-cantly lower than for those in the control group at all frequencies (signiicance of Bonferroni correction 0.012, p<0.001). In the glauco-ma group, except at a frequency of 1.5 cpd, the CS scores were signi-icantly lower compared with control group (signiicance of Bon ferroni correction 0.012, p<0.012). There was also a statistically signiicant correlation between age and changes in CS scores of subjects at all spatial frequencies (1st session p<0.001, r=-0.399, -0.484, -0.484,
-0.386, and -0.395 at 1.5, 3, 6, 12, and 18 cpd, respectively; 2nd session
p<0.001, r=-0.424, -0.450, -0.495, -0.432, and -0.444 at 1.5, 3, 6, 12, and 18 cpd, respectively).
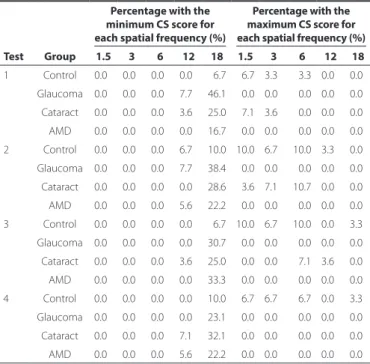
Table 2 summarizes the results of the analysis of possible loor and ceiling efects at each spatial frequency and for each group. There was a prominent loor efect at the highest frequency (18 cpd) in all groups. In healthy eyes, a loor efect, except in the second test, only occurred at 18 cpd. However, in the glaucoma group, the loor efect was greatest for the irst two tests and decreased for the last CS tests. There was no ceiling efect in the glaucoma or AMD groups
Table 1. Test-retest reliability of the contrast sensitivity test in the groups of control, glaucoma, cataract, and age-related macular dege-neration groups
Spatial frequency (cpd)
1st session 2nd session
p-value
Intersession ICC COR ICC COR ICC COR
Control group
1.5 0.86 0.19 0.91 0.13 0.92 0.14
3 0.86 0.18 0.89 0.16 0.95 0.10
6 0.83 0.23 0.87 0.20 0.042*a 0.91 0.16
12 0.91 0.23 0.96 0.15 0.043*b 0.94 0.18
18 0.87 0.38 0.96 0.18 0.94 0.23
Mean 0.87 0.24 0.92 0.16 0.93 0.16 Glaucoma
group
1.5 0.92 0.14 0.83 0.22 0.96 0.10
3 0.80 0.24 0.92 0.15 0.95 0.11
6 0.85 0.22 0.94 0.14 0.461a 0.86 0.20
12 0.95 0.20 0.97 0.11 0.194b 0.96 0.15
18 0.98 0.18 0.98 0.18 0.98 0.19
Mean 0.90 0.20 0.93 0.16 0.94 0.15
Cataract group
1.5 0.86 0.22 0.88 0.17 0.94 0.14
3 0.84 0.23 0.94 0.14 0.96 0.10
6 0.86 0.25 0.93 0.18 0.043* a 0.96 0.14
12 0.56 0.56 0.85 0.37 0.043*b 0.81 0.34
18 0.70 0.67 0.92 0.33 0.96 0.22
Mean 0.76 0.38 0.90 0.24 0.93 0.19
AMD group
1.5 0.72 0.17 0.88 0.14 0.93 0.09
3 0.74 0.19 0.84 0.16 0.91 0.10
6 0.62 0.23 0.80 0.23 0.043* a 0.88 0.13
12 0.83 0.18 0.90 0.20 0.141b 0.90 0.15
18 0.56 0.50 0.90 0.32 0.68 0.42
Mean 0.69 0.25 0.86 0.21 0.86 0.18
AMD= age-related macular degeneration; ICC= Intraclass correlation coeicient; COR= coei-cient of repeatability; cpd= cycle per degree.
*= statistically signiicant p<0.05.
a= p-value of Wilcoxon signed-rank test for ICC of 1st and 2nd sessions.
b= p-value of Wilcoxon signed-rank test for COR of 1st and 2nd sessions.
at any of the tested frequencies. In healthy and cataract eyes, a low ceiling efect (3.3%-10%), with a slight decrease during the last two tests, was detected.
DISCUSSION
This study showed that the FVA CS test has good reliability, as shown by ICC and COR analysis. The CS test is useful for patients with good visual acuity who have healthy eyes without glaucoma, cataracts, or AMD. Although there are other commercially available CS tests using letters, symbols, or sine-wave gratings, these tests are not clearly stan-dardized for performing a common CS evaluation such as visual ield analyses(2,23). Sine-wave gratings permit sensitive testing of individual
visual channels and are part of spatial frequency for evaluating CS
function in vision science(12). The FACT chart also uses sine-wave
gra-tings, which have been chosen at given luminance and glare levels
for the ANSI by the United States Food and Drug Administration(5).
Although the FACT chart is a modiied version of the Vistech, it uses smaller increments (0.15 log units) and subjects must choose from three options. Previous CS studies with sine-wave gratings reported insuicient scores for reliability analyses (ICC 0.28-0.64 and COR
0.26-0.58)(2). Despite having poor reliability with FACT wall charts, closed
systems using the standard FACT luminance and glare values were reported to exactly match the ANSI standards, thereby providing better reliability(3, 27).Hohberger et al.(27) reported average reliability
coeicients of 0.80-0.96 for each cpd with an OPTEC 6500 CS test.
Using the same device, Hong et al.(3) reported ICC 0.85 and COR 0.20,
which are comparable to our results with the FVA closed system CS test (intersession ICC 0.86-0.94 and COR 0.16-0.19).
Previous studies with FACT charts in closed systems omitted any com parison with earlier and latter CS test scores that might have ex -plained possible improvements in test reliability. We think that such comparisons are important to establish a reliable clinical application of the CS test. In this study, the mean ICCs of the closed system CS test
were better at the second session (0.86-0.94) than the irst session (0.69-0.90) in all groups. Furthermore, the CORs improved at the second session (irst session 0.20-0.38; second session 0.16-0.24). There may be a learning efect, which possibly arises from cognitive a bilities or getting familiar with the test procedure during the repea-ted tests. It has been reporrepea-ted that using letter charts for CS tests result in learning efects according to variable abilities to recognize letters. The FACT charts that use sine-wave gratings eliminate these
problems(2,31). However, subjects high probability of correct guessing
with the FACT charts, so repetitive tests are needed to reduce this efect(27,31). Subjects’ responses may become more reliable after learning
the FVA CS test procedure so it is important to conduct multiple CS tests to obtain more reliable clinical results.
It has been well documented that the spatial and temporal types of CS decrease in people with glaucoma(11,32,33). Grating CS tests
are promising for the detection of early glaucoma and its progres-sion(32,34). Klein et al.(17) suggested that spatial CS were a sensitive
indicator of early glaucomatous loss in the presence of cataracts. Although visual acuity was good, the CS of the eyes with glaucoma was signiicantly less than among healthy subjects except at 1.5 cpd (p<0.012). This result was compatible with that previously reported
by Onal et al.(7) using the FACT wall chart. The authors suggested that
the FACT chart was useful for early diagnosis of patients with glau-coma, accompanied by a short-wavelength automated perimetry. This may be associated with early degeneration in the magnocellular
ganglion cells, which are important for CS, in glaucoma(35).
The CS of eyes with AMD was worse than among healthy subjects at all frequencies (p<0.001), similar to previous studies(6,36). As there
are limited options for treatment of AMD, early detection of the disease and prevention of progression are very important. Visual discomfort in performing daily activities often occurs in patients with AMD even though they have a BCVA of 0.00 logMAR on Snellen charts. This vi-sion quality loss is seen in early AMD before any detectable retinal
changes occur(18,37). CS reduction in AMD patients becomes more
evi-dent and uncomfortable under conditions of low illumination, which
provides a low contrast environment(16).
It was reported previously that the closed system FACT chart had a lower ceiling efect than the wall chart test, which might increase its ability to detect small changes. In our study, no ceiling efect was observed in eyes with glaucoma or AMD using the FVA closed system CS test, and the ceiling efect was acceptable in healthy and cataract
eyes(3). Even after a gap of at least one week between the irst and
second CS tests, the ceiling efect in normal and cataract eyes tended to decrease. These results suggest that the FACT chart in a closed system has the potential to detect small decreases in high CS scores in healthy, cataract, and AMD eyes and otherwise healthy eyes with early stages of glaucoma. A more pronounced loor-efect emerged in glaucoma and AMD eyes at higher frequencies, which may represent the efects of early retinal or ganglion cell defects on the loss of CS.
It is critical to know if the patients are afected by glaucoma, ca taracts, or AMD in their daily lives when considering treatment options. CS has become more important for quality of life assessments,
which have been receiving increase attention in recent years(37-39).
CS is involved with diferentiating low-contrast objects, such as
hu-man faces, and recognizing movement(37,40). Because of the close
relationship between CS and the ability to perform activities of daily living, despite normal BCVA, CS testing is a useful clinical method to assess how ocular disease afects what patients can do. The present study found that FVA closed system CS evaluation provided reliable results with an easy method and standardized luminance.
It should be noted that there are several limitations of this study. The numbers of patients with eye disease and healthy controls were small. Reliability was evaluated by only two sessions with CS test each, so more sessions are required to strengthen the results. In addition, the interval between sessions varied from one week to one month.
Table 2. The loor and ceiling efect for each spatial frequency and group (measured by the percentage of maximum and minimum CS scores in the control (n=30), glaucoma (n=13), cataract (n=29), and AMD (n=18) groups)
Percentage with the minimum CS score for each spatial frequency (%)
Percentage with the maximum CS score for each spatial frequency (%)
Test Group 1.5 3 6 12 18 1.5 3 6 12 18 1 Control 0.0 0.0 0.0 0.0 06.7 06.7 3.3 03.3 0.0 0.0
Glaucoma 0.0 0.0 0.0 7.7 46.1 00.0 0.0 00.0 0.0 0.0
Cataract 0.0 0.0 0.0 3.6 25.0 07.1 3.6 00.0 0.0 0.0 AMD 0.0 0.0 0.0 0.0 16.7 00.0 0.0 00.0 0.0 0.0
2 Control 0.0 0.0 0.0 6.7 10.0 10.0 6.7 10.0 3.3 0.0
Glaucoma 0.0 0.0 0.0 7.7 38.4 00.0 0.0 00.0 0.0 0.0 Cataract 0.0 0.0 0.0 0.0 28.6 03.6 7.1 10.7 0.0 0.0
AMD 0.0 0.0 0.0 5.6 22.2 00.0 0.0 00.0 0.0 0.0
3 Control 0.0 0.0 0.0 0.0 06.7 10.0 6.7 10.0 0.0 3.3 Glaucoma 0.0 0.0 0.0 0.0 30.7 00.0 0.0 00.0 0.0 0.0
Cataract 0.0 0.0 0.0 3.6 25.0 00.0 0.0 07.1 3.6 0.0
AMD 0.0 0.0 0.0 0.0 33.3 00.0 0.0 00.0 0.0 0.0 4 Control 0.0 0.0 0.0 0.0 10.0 06.7 6.7 06.7 0.0 3.3
Glaucoma 0.0 0.0 0.0 0.0 23.1 00.0 0.0 00.0 0.0 0.0 Cataract 0.0 0.0 0.0 7.1 32.1 00.0 0.0 00.0 0.0 0.0
AMD 0.0 0.0 0.0 5.6 22.2 00.0 0.0 00.0 0.0 0.0
CS measures visual quality and can provide detailed information by spatial frequency assessment. Thus, it can be used to detect early subclinical findings or changes during treatment for visual-sys-tem-re lated eye diseases. However, to diferentiate healthy from abnormal characteristics and to detect real disease progression, the CS test must have strong clinical reliability. In this study, we found good reliability of the FVA closed system CS test in all groups and reliability improved during the second session. Therefore, to get more reliable results, repeated measurements are needed. Although, there was an acceptable loor-efect with the closed system test in patients with glaucoma and AMD, we found no ceiling efect; consequently, the view-in test has potential to detect ine changes at high frequencies.
In summary, to the best of our knowledge, this is the irst study reporting the repeatability of FACT test scores using a closed system in patients with AMD and glaucoma. Hopefully, the reliability of this FACT will encourage clinicians to incorporate contrast sensitivity into their thorough evaluation of the early changes that accompany glaucoma, cataract, and AMD.
REFERENCES
1. Miller D, Schor P, Magnante P. Optics of the normal eye. In: Yanof M, Duker JS, editor. Ophthalmology. China: Elsevier; 2014. p. 38-45.
2. Richman J, Spaeth GL, Wirostko B. Contrast sensitivity basics and a critique of curren-tly available tests. J Cataract Refract Surg. 2013;39(7):1100-6.
3. Hong YT, Kim SW, Kim EK, Kim T. Contrast sensitivity measurement with 2 contrast sensitivity tests in normal eyes and eyes with cataract. J Cataract Refract Surg. 2010; 36(4):547-52.
4. Nielsen E, Hjortdal J. Visual acuity and contrast sensitivity after posterior lamellar kera-toplasty. Acta Ophthalmol. 2012;90(8):756-60.
5. Ginsburg AP. Contrast sensitivity: determining the visual quality and function of ca-taract, intraocular lenses and refractive surgery. Curr Opin Ophthalmol. 2006;17(1):19-26. 6. Aslam T, Mahmood S, Balaskas K, Patton N, Tanawade R, Tan S, et al. Repeatability of
visual function measures in age-related macular degeneration. Graefes Arch Clin Exp Ophthalmol. 2014;252(2):201-6.
7. Onal S, Yenice O, Cakir S, Temel A. FACT contrast sensitivity as a diagnostic tool in glaucoma: FACT contrast sensitivity in glaucoma. Int Ophthalmol. 2008;28(6):407-12. 8. Zhang J, Zhou YH, Li R, Tian L. Visual performance after conventional LASIK and wavefront-guided LASIK with iris-registration: results at 1 year. Int J Ophthalmol. 2013; 6(4):498-504.
9. Ginsburg AP. Contrast sensitivity and functional vision. Int Ophthalmol Clin. 2003; 43(2):5-15.
10. Lahav K, Levkovitch-Verbin H, Belkin M, Glovinsky Y, Polat U. Reduced mesopic and photopic foveal contrast sensitivity in glaucoma. Arch Ophthalmol. 2011;129(1):16-22. 11. Yenice O, Onal S, Incili B, Temel A, Afşar N, Tanrıdag. Assessment of spatial-contrast function and short-wavelength sensitivity deicits in patients with migraine. Eye (Lond). 2007;21(2):218-23.
12. Richman J, Lorenzana LL, Lankaranian D, Dugar J, Mayer J, Wizov SS, et al. Importance of visual acuity and contrast sensitivity in patients with glaucoma. Arch Ophthalmol. 2010;128(12):1576-82.
13. Hawkins AS, Szlyk JP, Ardickas Z, Alexander KR, Wilensky JT. Comparison of contrast sensitivity, visual acuity, and Humphrey visual ield testing in patients with glaucoma. J Glaucoma. 2003;12(2):134-8.
14. Faria BM, Duman F, Zheng CX, Waisbourd M, Gupta L, Ali M, et al. Evaluating contrast sensitivity in Age-related macular degeneration using a novel computer-based test, the Spaeth/Richman contrast sensitivity test. Retina. 2015;35(7):1465-73. 15. Stangos N, Voutas S, Topouzis F, Karampatakis V. Contrast sensitivity evaluation in eyes
predisposed to age-related macular degeneration and presenting normal visual acuity. Ophthalmologica. 1995;209(4):194-8.
16. Puell MC, Barrio AR, Palomo-Alvarez C, Gómez-Sanz FJ, Clement-Corral A, Pérez-Carrasco MJ. Impaired mesopic visual acuity in eyes with early age-related macular degenera-tion. Invest Ophthalmol Vis Sci. 2012;53(11):7310-4.
17. Klein J, Pierscionek BK, Lauritzen J, Derntl K, Grzybowski A, Zlatkova MB. The efect of cataract on early stage glaucoma detection using spatial and temporal contrast sensitivity tests. PLoS One. 2015;10(6):e0128681.
18. Bansback N, Czoski-Murray C, Carlton J, Lewis G, Hughes L, Espallargues M, et al. De terminants of health related quality of life and health state utility in patients with age related macular degeneration: the association of contrast sensitivity and visual acuity. Qual Life Res. 2007;16(3):533-43.
19. Söğütlü Sari E, Kubaloğlu A, Unal M, Liorens DP, Koytak A,Oluoglu AN, et al. Penetra-ting keratoplasty versus deep anterior lamellar keratoplasty: comparison of optical and visual quality outcomes. Br J Ophthalmol. 2012;96(8):1063-7.
20. Karakus SH, Basarir B, Pinarci EY, Kirandi EU, Demirok A. Long-term results of half-dose photodynamic therapy for chronic central serous chorioretinopathy with contrast sensitivity changes. Eye (Lond). 2013;27(5):612-20.
21. Gertnere J, Solomatin I, Sekundo W. Refractive lenticule extraction (ReLEx lex) and wavefront-optimized Femto-LASIK: comparison of contrast sensitivity and high-order aberrations at 1 year. Graefes Arch Clin Exp Ophthalmol. 2013;251(5):1437-42. 22. Thayaparan K, Crossland MD, Michael D, Rubin GS. Clinical assessment of two new
contrast sensitivity charts. Br J Ophthalmol. 2007;91(6):749-52.
23. Keane PA, Patel PJ, Ouyang Y, Chen FK, Ikeji F, Walsh AC, et al. Efects of retinal morpho-logy on contrast sensitivity and reading ability in neovascular age-related macular degeneration. Invest Ophthalmol Vis Sci. 2010;51(11):5431-7.
24. Haughom B, Strand T-E. Sine wave mesopic contrast sensitivity - deining the normal range in a young population. Acta Ophthalmol. 2013;91(2):176-82.
25. Li JH, Feng YF, Zhao YE, Zhao YY, Lin L. Contrast visual acuity after multifocal intrao-cular lens implantation: aspheric versus spherical design. Int J Ophthalmol. 2014; 7(1):100-3.
26. Haymes SA, Roberts KF, Cruess AF, Cruess AF, Nicolela MT, LeBlanc RP, et al. The letter contrast sensitivity test: clinical evaluation of a new design. Invest Ophthalmol Vis Sci. 2006;47(6):2739-45.
27. Hohberger B, Laemmer R, Adler W, Juenemann AG, Horn FK. Measuring contrast sensitivity in normal subjects with OPTEC 6500: inluence of age and glare. Graefes Arch Clin Exp Ophthalmol. 2007;245(12):1805-14.
28. Chylack LT Jr, Wolfe JK, Singer DM, Leske MC, Bullimore MA, Bailey IL, et al. The Lens Opacities Classiication System III. The Longitudinal Study of Cataract Study Group. Arch Ophthalmol. 1993;111(6):831-6.
29. Shafer RN. Primary glaucomas. Gonioscopy, ophthalmoscopy and perimetry. Trans Am Acad Ophthalmol Otolaryngol. 1960;64:112-27.
30. Armstrong RA, Davies LN, Dunne MC, Gilmartin B. Statistical guidelines for clinical studies of human vision. Ophthalmic Physiol Opt. 2011;31(2):123-36.
31. Bühren J, Terzi E, Bach M, Wesemann W, Kohnen T. Measuring contrast sensitivity under diferent lighting conditions: comparison of three tests. Optom Vis Sci. 2006;83(5): 290-8.
32. Lundh BL. Central and peripheral contrast sensitivity for static and dynamic sinusoidal gratings in glaucoma. Acta Ophthalmol. 1985;63(5):487-92.
33. McKendrick AM, Sampson GP, Walland MJ, Badcock DR. Contrast sensitivity changes due to glaucoma and normal aging: low-spatial-frequency losses in both magno-cellular and parvomagno-cellular pathways. Invest Ophthalmol Vis Sci. 2007;48(5):2115-22. 34. Ansari EA, Morgan JE, Snowden RJ. Psychophysical characterisation of early functional
loss in glaucoma and ocular hypertension. Br J Ophthalmol. 2002;86(10):1131-5. 35. Sun H, Swanson WH, Arvidson B, Dul MW. Assessment of contrast gain signature in
inferred magnocellular and parvocellular pathways in patients with glaucoma. Vision Res. 2008;48(26):2633-41.
36. Patel PJ, Chen FK, Rubin GS, Tufail A. Intersession repeatability of contrast sensitivity scores in age-related macular degeneration. Invest Ophthalmol Vis Sci. 2009;50(6): 2621-5.
37. Scilley K, Jackson GR, Cideciyan AV, Maguire MG, Jacobson SG, Owsley C. Early age-related maculopathy and self-reported visual diiculty in daily life. Ophthalmo-logy. 2002;109(7):1235-42.
38. Browne C, Brazier J, Carlton J, Alavi Y, Jofre-Bonet M. Estimating quality-adjusted life years from patient-reported visual functioning. Eye (Lond). 2012;26(10):1295-301. 39. Wei H, Sawchyn AK, Myers JS, Katz LJ, Moster MR, Wizov SS, Steele M, Lo D, Spaeth GL.
A clinical method to assess the efect of visual loss on the ability to perform activities of daily living. Br J Ophthalmol. 2012;96(5):735-41.