Physical activity in climacteric
women: comparison between
self-reporting and pedometer
I Unidade de Endocrinologia Ginecológica. Serviço de Endocrinologia. Hospital de Clinicas de Porto Alegre. Porto Alegre, RS, Brasil
II Faculdade de Medicina. Universidade de Passo Fundo. Passo Fundo, RS, Brasil III Hospital São Vicente de Paulo. Passo Fundo,
RS, Brasil
Correspondence:
Karen Oppermann Rua Teixeira Soares 885/704 99010-081 Passo Fundo, RS, Brasil E-mail: [email protected] Received: 2/6/2013
Approved: 12/16/2013
Article available from: www.scielo.br/rsp
ABSTRACT
OBJECTIVE: To compare two methods of assessing physical activity in pre-, peri- and postmenopausal women.
METHODS: Cross-sectional study nested in a cohort of pre-, peri- and postmenopausal women in a city in Southern Brazil. The participants completed a questionnaire that included sociodemographic and clinical data. Physical activity was assessed using a digital pedometer and the International Physical Activity Questionnaire, short version. The participants were classiied into strata of physical activity according to the instrument used. For statistical analysis, the Spearman correlation test, Kappa index, concordance coeficient and Bland-Altman plots were used.
RESULTS: The concordance (k = 0110; p = 0.007) and the correlation (rho = 0.136, p = 0.02) between the International Physical Activity Questionnaire, short version, and pedometer were weak. In Bland-Altman plots, it was observed that differences deviate from zero value whether the physical activity is minimal or more intense. Comparing the two methods, the frequency of inactive women is higher when assessed by pedometer than by the International Physical Activity Questionnaire - short version, and the opposite occurs in active women.
CONCLUSIONS: Agreement between the methods was weak. Although easy to use, Physical Activity Questionnaire - short version overestimates physical activity compared with assessment by pedometer.
DESCRIPTORS: Climacteric. Menopause. Motor Activity. Walking. Questionnaires, utilization. Cross-Sectional Studies.
Verônica ColpaniI
Poli Mara SpritzerI
Ana Paula LodiII
Guilherme Gustavo DorigoII
Isabela Albuquerque Severo de
MirandaII
Laiza Beck HahnII
Luana Pedroso PalludoII
Rafaela Lazzari PietroskiII
Being sedentary has been recognized as a signiicant risk factor in developing cardiovascular disease (CVD), type 2 diabetes, metabolic syndrome and some types of cancer.13 The lack of physical activity (PA) is an impor-tant cause of avoidable death from non-communicable chronic disease.
Different instruments are available to evaluate PA and energy expenditure. Of the methods and techniques available, questionnaires are often used. Two such have been translated and validated in Portuguese. The International Physical activity Questionnaire – long form (IPAQ-LF) and short form (IPAQ-SF), are those with the best conditions to be used, with good reprodu-cibility, although validity has been shown to be low.13
Another way of assessing PA is using a pedometer, a mechanical counter that records movement in res-ponse to the body’s vertical acceleration. It is attached to the individual’s waist, counting the number of steps taken. It enables occupational, leisure, domestic and transport activities to be measured cumulatively, and is a sensitive and objective method for quantifying an individual’s PA.4
There are few studies of middle-aged women com-paring habitual PA as measured using the IPAQ-SF or a pedometer.5 The aim of this study is to compare methods of assessing physical activity in pre-, peri- and post-menopausal women.
METHODS
This was a population-based cross-sectional study, nes-ting a cohort of pre-, peri- and post-menopausal women in the city of Passo Fundo, RS, Southern Brazil, from 2010 to 2011.
This cohort began in 1995, when 298 women were randomly selected to evaluate the prevalence of meno-pause symptoms, hormone levels and ultrasound pel-vic measurements.16 In 2001, a second follow up was conducted, locating participants in the previous sample. Bearing in mind sample losses and population increase, new participants were included, randomly selected in the same way,1,8 giving a total sample of 358 pre-, peri- and post-menopausal women aged between 36 and 62.
In 2010, to discover the participants’ current state of health and cardiovascular risk, a third follow up was conducted. Participants were located using addresses, telephone numbers, hospital records, addresses of rela-tives and local radio and television, resulting in 301 women being contacted. Of these, complete data on PA level was obtained for 292, with nine being exclu-ded due to cognitive dificulties (4), illiteracy (1) and errors recording the number of steps (4).4
INTRODUCTION
Sociodemographic data, such as age, schooling (years at school), menopausal symptoms and hormone therapy (HT) were collected using a previously tested question-naire.1,8 The work variable was evaluated using the ques-tion: “Are you currently in work?”. Menopausal status was deined based on menstrual cycle characteristics and length of time of amenorrhea: pre-menopausal was dei-ned as having a normal menstrual cycle at the time of the study; peri-menopausal was deined as experiencing changes in menstrual cycle frequency or low in the 12 months before the study, and post-menopausal was deined as 12 months or more of natural or bilateral oophorec-tomy amenorrhea. A category called “hysterecoophorec-tomy” was created for women who had undergone hysterectomies without bilateral oophorectomy, and whose menopausal status could not be classiied. Alcohol consumption was determined based on participant self-reporting of alcohol intake (do not drink, used to drink, drink).4,8 Participants also self-reported smoking habits categorized as: smoker, ex-smoker and non-smoker. Anthropometric data were collected in duplicate and included weight, height, waist circumference and waist to hip ratio.4
PA was evaluated using the IPAQ-SF questionnaire and counting number of steps taken according to the pedome-ter. In the IPAQ-SF, PA was classiied in two ways: accor -ding to the number of minutes of PA in the week (inactive < 150 min PA/week and active ≥ 150 min PA/week)1 and also by metabolic equivalent minutes per week (inactive < 600 MET/min/week, moderate from 600 to 1,499 MET/ min/week and active ≥ 1,500 MET/min/week).17
The digital pedometer (model BP 148 TECHLINE) was used for seven consecutive days. Participants were ins-tructed how to use the sensor properly and not to alter their typical activities during the study. They were ins-tructed to note the number of steps in a diary at the end of each day. The mean number of steps was calculated by the ratio between the sum of the daily totals and the number of days the pedometer was used.
Using these measurements, the women were classiied as inactive (< 6,000 steps daily) and active (≥ 6,000 steps daily)4 and the women were further classiied as active (≥ 10,000 steps daily), moderately active (between 5,000 and 9,999 steps daily) and inactive or sedentary (< 4,999 steps daily).19 These two classiications were used in different analyses. The data were compared in 150 min/week (widely used and recommended by the World Health Organization) versus≥ 6,000 steps/ day (categorization already used with the same popu-lation in the previous study)4 for dichotomous analy-sis. Correlation between energy expended in MET/ min/week (unit of measurement described in the IPAQ Directives for Processing and Analyzing Data) versus
Table 1. Demographic and anthropometric characteristics of study participants in Passo Fundo, RS, Southern Brazil, 2010. (N = 292)
Variable n % Mean SD
Age (years) – – 57.11 5.36
Schooling (years)
0 to 4 58 19.9 – –
5 to 8 91 31.2 – –
9 to 11 85 29.1 – –
≥ 12 58 19.9 – –
In work (yes) 129 44.2 – –
Hormone therapy (yes) 48 18.0 – – Menopausal status
Pre-menopause 21 7.2 – –
Peri-menopause 25 8.6 – –
Post-menopause 229 78.4 – –
Hysterectomy 17 5.8 – –
Marital status
Married 150 51.4 – –
Single 51 17.5 – –
Separated/Divorced 91 31.1 – – Alcohol consumption
Drinks alcohol 96 32.9 – –
Used to drink 19 6.5 – –
Does not drink 177 60.6 – –
Smoking
Smoker 56 19.2 – –
Ex-smoker 67 22.9 – –
Non smoker 169 57.9 – –
Overweight/obese (yes) 198 68.3 – –
BMI (kg/m2) – – 28.3 7.0
Waist (cm) – – 91.3 13.7
BMI: body mass index The data analysis was performed using descriptive
sta-tistics to calculate the means, standard deviation and relative (%) and absolute (n) frequencies. The percen-tage of women classiied as active, moderately active and inactive using the two methods was compared using McNemar’s Chi-square test to verify equality between the percentages of responses to level of physical acti-vity. A dichotomous variable referring to concordance between the two instruments was created and the association between age, menopausal status and years of schooling was assessed using the Chi-square test. Spearman’s rho was also used to analyze association between the mean number of steps, minutes of PA/week and MET/min/week. The Kappa (k) value, coeficient of concordance (CC, %) and analysis of continuous measures using the methodology proposed by Bland-Altman2 were used to analyze concordance between the IPAQ-SF and the pedometer. This plotting enabled con-cordance between the two variables (X, Y) to be evalu-ated and to evaluate bias (by how much the differences are distant from zero), error (dispersion of the points of difference around the means), outliers and trends.12
To use the Bland-Altman test, Z scores were calculated in both instruments so as to annul units, as the pedometer uses steps/day and the IPAQ-SF MET/min/week. The equation for calculating the Z score was: Z = (X–μ)/S.D, in which Z = Z score; X = unadjusted individual score;
μ = mean of the variables; S.D. = standard deviation of the variable. At this point, 18 individuals were excluded from analysis as they had not done more than 10 con-tinuous minutes of PA and did not have the complete data necessary to calculate MET/min/week. The level of signiicance was 5% in all analyses. The Statistical Package for the Social Sciences SPSS 20.0 and Stata 7.0 were used for the analyses.
This study was approved by the Research Ethics Committee of the Faculty of Medicine, Universidade de Passo Fundo and of the Hospital São Vicente de Paulo (Process 2010/16929). Participants signed an informed consent form.
RESULTS
The sample was composed of middle-aged women, with a mean age of 57.11 (SD = 5.36), and a mean 8.74 years of schooling (SD = 4.48), 20.0% of whom repor-ted having fewer than four years of schooling. Of those with low levels of schooling, more than 70.0% were in the inactive group. Regarding menopausal symptoms, 7.2% of patients were in the pre-menopause, 8.6% in the peri-menopause, 78.4% were post-menopausal and 5.8% had had hysterectomies. The prevalence of smokers was 19.2%, and 18.0% were using HT. Body mass index was 28.3 kg/m2 (SD = 7.1), with the majority of the sam-ple being overweight or obese (Table 1). There was no association between schooling, menopausal status and
age and concordance between the two instruments (p = 0.191, p = 0.268 and p = 0.619, respectively).
Concordance between the two instruments, evaluated using the Kappa coeficient, was poor (steps/day and PA min/week, k = 0.110; p = 0.007 and steps/day and MET/ min/week, k = 0.075; p = 0.013). The CC as 47.0% (num-ber of steps and PA min/week) and 32.0% (num(num-ber of steps and MET/min/week), resulting in an intermediate value, considered poor concordance (Table 2).
Table 3. Strata of physical activity in pre-, peri- and post-menopausal women, using the IPAQ-SF and pedometer, MET/min/ week versus steps per day. (N = 292)
Variable
Inactive < 6,000 steps/day;
< 150 min/week
Active ≥ 6,000 steps/day;
≥ 150 min/week Kappaa
n % n %
Number of steps (pedometer) 199 68.2 93 31.8 0.110
Min/week (IPAQ-SF) 75 26.0 214 74.0
IPAQ-SF: International Physical Activity Questionnaire – short form McNemar’s Chi-square test, p ≤ 0.001
a Kappa coefficient p ≤ 0.05
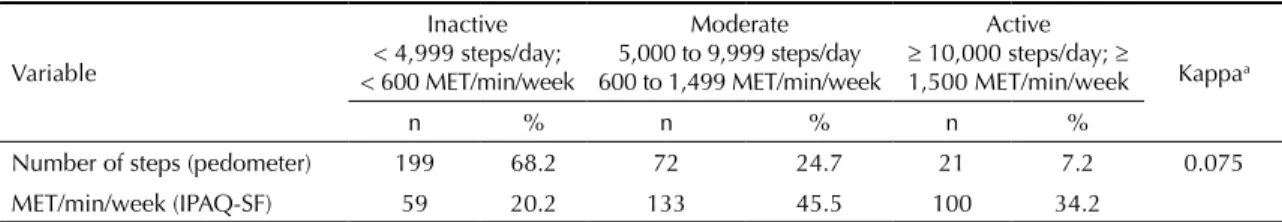
Table 2. Strata of physical activity in pre-, peri- and post-menopausal women, using the IPAQ-SF and pedometer, MET/min/
week versus steps per day. (N = 292)
Variable
Inactive < 4,999 steps/day; < 600 MET/min/week
Moderate 5,000 to 9,999 steps/day 600 to 1,499 MET/min/week
Active ≥ 10,000 steps/day; ≥
1,500 MET/min/week Kappaa
n % n % n %
Number of steps (pedometer) 199 68.2 72 24.7 21 7.2 0.075
MET/min/week (IPAQ-SF) 59 20.2 133 45.5 100 34.2
IPAQ-SF: International Physical Activity Questionnaire – short form McNemar’s Chi-square test, p ≤ 0.001
a Kappa coefficient p ≤ 0.05
Tables 2 and 3 show the frequency of participants in each strata of PA according to the two instruments used. There was a signiicant difference between the women classiied in different strata of PA, with Kappa coefi -cients of 0.075 and 0.110, respectively.
DISCUSSION
The number of women classed as active was at least twice as high when classiied by the IPAQ-SF compared with when evaluated using a pedometer, for both the MET/min/week and the PA/week criteria.
The results show that data referring to the PA strata obtai-ned using the IPAQ-SF are not similar to those asses-sed in an objective way, using a pedometer. The Bland-Altman indings corroborate Tables 2 and 3, showing the frequency of inactive women is greater when asses-sed using a pedometer than using the IPAQ-SF, and the opposite is true for active women. The data indicate that the IPAQ-SF overestimates compared with the pedo-meter, principally in the active category.
A recent systematic review of the IPAQ-SF validity showed studies in populations in a similar age range to that of this study and which reported low to moderate correlation between the two methods.13 Studies com-paring pedometer use and the IPAQ-SF stand out, such as that by De Cocker et al,6 with 310 healthy adults, reporting low to moderate correlation (PA total rho = 0.28), and the study by Deng et al,7 with a sample of the Chinese population with a mean age of 65, and
moderate correlation (PA total rho = 0.33; p < 0.001) between the two methods.
A Brazilian study of 21 post-menopausal women with osteoporosis assessed concordance between the IPAQ-LF and the pedometer. According to the IPAQ, 71.4% of participants were classiied as active and 28.6% seden -tary. The concordance between the IPAQ and the pedo-meter had a Kappa of 0.21.5 Although the study sam-ple used post-menopausal women and the long form IPAQ, it also found poor correlation between reported PA and direct evaluation using the pedometer. This study conirms these indings using the IPAQ-SF, although with a larger, representative sample of pre-, peri- and post-menopausal women.
The majority of women studied were middle-aged, did not work, were overweight or obese, had central adipo-sity, high blood pressure and were predominantly inac-tive when assessed using the pedometer.4 This proile of cardiovascular risk is strongly linked to sedentarism and reinforces that evaluating PA using a pedometer may be appropriate, on the other hand. Participants who walked more than ≥ 6,000 steps/day had less central adiposity, metabolic syndrome or diabetes.4
ULC: Upper limit of concordance; LLC: Lower limit of concordance A. Spearman’s correlation (rho = 0.113; p = 0.025)
B. Bland-Altman test for concordance of measures of physical activity between the IPAQ-SF and the pedometer, mean Z score of steps/MET(log)
Figure. Analysis of correlation and concordance in measures of physical activity between the International Physical Activity
Questionnaire – short form and pedometer. 25.000
25.000 20.000
20.000 15.000
15.000 10.000
MET/min/week
Steps/day
Linear R Sq = 0,006
10.000 5.000
5.000 30.000
0
3.5
2.5
1.5
.5
-.5
-1.5
-2.5
-3.5
-4.5 4.5
-5.5 A.
0
Difference between pedometer and IP
A
Q-SF
Mean between pedometer and IPAQ-SF
LSC: 2.028
-0.165
LIC: -2.357
-.5 0 .5 1 1.5 2
-1.5 -1
B. -2
patients can take this form, increasing adherence due to ease of use and shorter intervention. Regardless, when evaluating PA longitudinally the use of the same ins-trument facilitates comparison of results.
between the two methods was a little greater after adjus-ting for sex, age and schooling.7
Regarding the instruments used, questionnaires are more accessible and allow the intensity and type of PA to be estimated. Their use may be preferred in long studies or those monitoring a large number of participants. On the other hand, it is a subjective method relying on memory, which may increase the chance of error. The concept of the 10 minute session and errors in perceiving intensity may lead to errors in interpreting and responding to the IPAQ-SF,10 although using interviewers to apply it helps to decrease this bias. The reliability of the IPAQ-SF means it can be used, with caution, in repetitive measure studies, there is no evidence corroborating its use as an absolute or relative measure of PA.13
The pedometer is an objective method of evaluating PA. However, although it is a valuable tool in estima-ting and encouraging habitual and daily PA, it does not quantify movement on the horizontal and superior plane.3 It is appropriate for measuring travel (steps/ day) through the body’s vertical oscillations, but it is not capable of evaluating activities such as cycling or any activity in water, and it does not discriminate type or intensity of PA.
Individuals accelerate, decelerate, stop and sit down many times in the course of a day while using a pedometer, and this may affect evaluation of energy expended and level of PA. North American adults show a variation in the time of repose or in the cadence (steps/min) throu-ghout the day. There is a close relationship between cadence and walking speed, and 100 steps/min can be considered an appropriate estimate of a 3 MET acti-vity. These estimates, however, cannot be considered as ixed values for total energy expenditure in a day. In
this study, cadence was not measured individually, the-refore, energy expenditure in MET cannot be used as a unit of measurement of the pedometer.22 Using an acce-lerometer would be a better alternative for comparing and converting energy expenditure evaluated by the IPAQ-SF and the distance covered by each participant. Some studies have shown moderate and strong corre-lation between igures obtained from the accelerome -ter and MET in adults,18 in contrast to other studies.13 The accelerometer method is more expensive and it is also unable to distinguish static activities (e.g., weight training), water sports or cycling, and there are still faults in correct and easy conversion and interpreta-tion of the raw data produced from this instrument.14,15
A limitation of this study was the fact that the two ins-truments give results using different measures, which may limit the Bland-Altman analyses. However, cal-culating the Z score enables analysis between the tests.
This is the irst Brazilian population-based study inves -tigating these two methods of evaluating PA and rela-ting them to menopausal status and schooling. The study design means the results can be transposed to similar populations.
Considering that habitual PA is an easily adopted behavior to prevent cardiovascular risk, it is essential that accurate methods of estimating it are used and that the instruments used can be considered of use in beha-vior modifying interventions encouraging PA.
1. Bastos CA, Oppermann K, Fuchs SC, Donato GB, Spritzer PM. Determinants of ovarian volume in pre-, menopausal transition, and post-menopausal women: a population-based study. Maturitas. 2006;53(4):405-12. DOI:10.1016/j.maturitas.2005.07.002
2. Bland JM, Altman DG. Statistical methods for assessing agreement between two methods of clinical measurement. Lancet. 1986;327(8476):307-10. DOI:10.1016/S0140-6736(86)90837-8
3. Butte NF, Ekelund U, Westerterp KR. Assessing physical activity using wearable monitors: measures of physical activity. Med Sci Sports Exerc. 2012;44(1 Suppl 1):S5-12. DOI:10.1249/MSS.0b013e3182399c0e
4. Colpani V, Oppermann K, Spritzer PM. Association between habitual physical activity and lower
cardiovascular risk in premenopausal, perimenopausal, and postmenopausal women: a
population-based study. Menopause. 2013;20(5):525-31. DOI:10.1097/GME.0b013e318271b388
5. Dallanezi GC, Corrrente JE, Freire BF, Mazeto GMFS. Concordância do International Physical Activity Questionnaire com o pedômetro, em mulheres pós-menopausadas portadoras de osteoporose. Rev Soc Bras Clin Med. 2011;9(2):93-6.
6. De Cocker KA, De Bourdeaudhuij IM, Cardon GM. What do pedometer counts represent? A comparison between pedometer data and data from four different questionnaires. Public Health Nutr. 2009;12(1):74-81. DOI:10.1017/S1368980008001973
7. Deng HB, Macfarlane DJ, Thomas GN, Lao XQ, Cheng KK, Lam TH. Reliability and validity of the IPAQ-Chinese: the Guangzhou Biobank Cohort study. Med Sci Sports Exerc. 2008;40(2):303-7. DOI:10.1249/mss.0b013e31815b0db5
8. Donato GB, Fuchs SC, Oppermann K, Bastos C, Spritzer PM. Association between menopause status and central adiposity measured at different cutoffs of waist circumference and waist-to-hip ratio. Menopause. 2006;13(2):280-5. DOI:10.1097/01.gme.0000177907.32634.ae
9. Graff SK, Alves BC, Toscani MK, Spritzer PM. Benefits of pedometer-measured habitual physical activity in healthy women. Appl Physiol Nutr Metab.
2012;37(1):149-56. DOI:10.1139/h11-145
10. Hallal PC, Gomez LF, Parra DC, Lobelo F, Mosquera J, Florindo AA, et al. Lessons learned after 10 years of IPAQ use in Brazil and Colombia. J Phys Act Health.
2010;7(Suppl 2):S259-64.
11. Hart TL, Swartz AM, Cashin SE, Strath SJ. How many days of monitoring predict physical activity and sedentary behaviour in older adults? Int J Behav Nutr Phys Act. 2011;8:62. DOI:10.1186/1479-5868-8-62
12. Hirakata VN CS. Análise de concordância entre métodos de Bland-Altman. Rev HCPA. 2009;29(3):261-8.
13. Lee PH, Macfarlane DJ, Lam TH, Stewart SM. Validity of the International Physical Activity Questionnaire Short Form (IPAQ-SF): a systematic review. Int J Behav Nutr Phys Act. 2011;8:115. DOI:10.1186/1479-5868-8-115
14. Matthew CE. Calibration of accelerometer output for adults. Med Sci Sports Exerc. 2005;37(11 Suppl):S512-22. DOI:10.1249/01.mss.0000185659.11982.3d
15. Murphy SL. Review of physical activity measurement using accelerometers in older adults: considerations for research design and conduct. Prev Med. 2009;48(2):108-14. DOI:10.1016/j.ypmed.2008.12.001
16. Oppermann K, Fuchs SC, Spritzer PM. Ovarian volume in pre- and perimenopausal women: a population-based study. Menopause. 2003;10(3):209-13.
17. Ramirez-Marrero FA, Rivera-Brown AM, Nazario CM, Rodriguez-Orengo JF, Smit E, Smith BA. Self-reported physical activity in Hispanic adults living with HIV: comparison with accelerometer and pedometer.
J Assoc Nurses AIDS Care. 2008;19(4):283-94. DOI:10.1016/j.jana.2008.04.003
18. Trost SG, McIver KL, Pate RR. Conducting accelerometer-based activity assessments in field-based research. Med Sci Sports Exerc. 2005;37(11 Suppl):S531-43. DOI:10.1249/01.mss.0000185657.86065.98
19. Tudor-Locke C, Bassett DR Jr. How many steps/day are enough? Preliminary pedometer indices for public health. Sports Med. 2004;34(1):1-8.
20. Tudor-Locke C, Burkett L, Reis JP, Ainsworth BE, Macera CA, Wilson DK. How many days of pedometer monitoring predict weekly physical activity in adults? Prev Med. 2005;40(3):293-8. DOI:10.1016/j.ypmed.2004.06.003
21. Tudor-Locke C, Craig CL, Brown WJ, Clemes SA, De Crocker K, Giles-Corti B, et al. How many steps/day are enough? For adults. Int J Behav Nutr Phys Act.
2011;8:79. DOI:10.1186/1479-5868-8-79
22. Tudor-Locke C, Rowe DA. Using cadence to study free-living ambulatory behaviour.
Sports Med. 2012;42(5):381-98.
DOI:10.2165/11599170-000000000-00000
REFERENCES