○ ○ ○ ○ ○ ○ ○ ○ ○ ○ ○ ○A BSTRA CT○ ○ ○ ○ ○ ○
Original Ar
ticle
system among intensive care
patients at a teaching hospital
Intensive Therapy Service, Santa Casa de Misericórdia de São Paulo,
São Paulo, Brazil
○ ○ ○ ○ ○ ○ ○ ○ ○ ○I N TRO D U CTI O N○ ○ ○ ○ ○ ○ ○ ○ ○ ○
The high-complexity features of intensive care unit services and the clinical situation of patients themselves render correct prognosis fun-damentally important not only for patients, their families and physicians, but also for hospital administrators, fund-providers and controllers. Prognostic indices have been developed for esti-mating hospital mortality rates for patients hos-pitalized in intensive care units, based on demo-graphic, physiological and clinical data. The most frequently used indices are APACHE II (Acute Physiology and Chronic Health Evaluation II), APACHE III (Acute Physiology And Chronic Health Evaluation III), SAPS II (Simplified Acute Physiology Score II) and MPM II (Mor-tality Probability Model II).1,4
The APACHE II index consists of a score that takes account of the patient’s age, chronic health condition and physiological variables (internal temperature, heart rate, respiratory rate, oxygenation, arterial pH, sodium, po-tassium, creatinine, hematocrit, white blood cells and Glasgow coma score). Although APACHE II was one of the first systems de-scribed, it is still the most widely used of them, insofar as the data required for its calculation are simple, well defined, reproducible, and collected on a routine basis during intensive care service provision.In Brazil, it is used by the Ministry of Health as a criterion for clas-sifying intensive care units.5
Markgraf et al.6 compared the predictive ca-pabilities of APACHE II, APACHE III and SAPS II and concluded that the three indices have good discriminating power and that APACHE II has the best calibration. For this
reason, it scored the most accurate mortality pre-diction. Because of the differences between in-tensive care unit patients, we think it is neces-sary for every intensive care unit to have a pre-diction system which is validated for its specific kind of patients. Some factors for calculating mortality corrections must also be established, in order to help estimate the mortality of similar groups of patients in the same intensive care unit.
○ ○ ○ ○ ○ ○ ○ ○ ○ ○ ○ ○ ○O BJECTI VES○ ○ ○ ○ ○ ○ ○
This study aimed to assess the APACHE II prognostic index in an intensive care unit at a Brazilian medical school hospital. The analysis of the capacity of the system for pre-dicting hospital mortality rate was also an objective of this study, as well as to compare the hospital’s recorded mortality rate with the expected mortality rate.
○ ○ ○ ○ ○ ○ ○ ○ ○ ○ ○ ○ ○ ○M ETH O D S○ ○ ○ ○ ○ ○
A total of 600 patients admitted to the 15 intensive care unit beds of Santa Casa de Misericórdia de São Paulo on a consecutive ba-sis made up the initial assessment during the pe-riod from July 1998 to June 1999. This hospital is a tertiary and teaching facility of the Faculdade de Ciências Médicas da Santa CasadeSão Paulo, Brazil. The study method was approved by the Institution’s Research Ethics Committee.
For standardization purposes, 68 patients who remained for less than 24 hours in the in-tensive care unit were excluded from the study, as well as 11 others whose medical files could not provide all the required information. Pa-tients were evaluated with regard to
demo-CONTEXT: The high-complexity features of intensive care unit services and the clinical situation of pa-tients themselves render correct prognosis funda-mentally important not only for patients, their fami-lies and physicians, but also for hospital adminis-trators, fund-providers and controllers. Prognostic indices have been developed for estimating hos-pital mortality rates for hoshos-pitalized patients, based on demographic, physiological and clinical data.
OBJECTIVE: The APACHE II system was applied within an intensive care unit to evaluate its ability to pre-dict patient outcome; to compare illness severity with outcomes for clinical and surgical patients; and to compare the recorded result with the pre-dicted death rate.
DESIGN: Diagnostic test.
SETTING: Clinical and surgical intensive care unit in a tertiary-care teaching hospital.
PARTICIPANTS: The study involved 521 consecutive patients admitted to the intensive care unit from July 1998 to June 1999.
MAIN MEASUREMENTS: APACHE II score, in-hospi-tal morin-hospi-tality, receiver operating characteristic curve, decision matrices and linear regression analysis.
RESULTS: The patients’ mean age was 50 ± 19 years and the APACHE II score was 16.7 ± 7.3. There were 166 clinical patients (32%), 173 (33%) post-elective surgery patients (33%), and 182 post-emer-gency surgery patients (35%), thus producing sta-tistically similar proportions. The APACHE II scores for clinical patients (18.5 ± 7.8) were similar to those for non-elective surgery patients (18.6 ± 6.5) and both were greater than for elective surgery patients (13.0 ± 6.3) (p < 0.05). The higher this score was, the higher the mortality rate was (p < 0.05). The predicted death rate was 25.6% and the recorded death rate was 35.5%. Through the use of receiver operating curve analysis, good dis-crimination was found (area under the curve = 0.80). From the 2 x 2 decision matrix, 72.2% of patients were correctly classified (sensitivity = 35.1%; specificity = 92.6%). Linear regression analysis was equivalent to r2 = 0.92. CONCLUSIONS: APACHE II was useful for stratifying
these patients. The illness severity and death rate among clinical patients were higher than those recorded for surgical patients. Despite the stratifi-cation ability of the APACHE II system, it lacked accuracy in predicting death rates. The recorded death rate was higher than the predicted rate.
graphic information and hospitalization diag-nosis, as well as their health condition at the time of discharge from hospital. They were di-vided into three groups, according to their kind of hospitalization: clinical patients, post-elec-tive surgery patients and post-emergency sur-gery patients. Patients who came to the inten-sive care unit directly from the surgical theater or from the recovery room after post-anesthesia procedures were regarded as surgical.
For the APACHE II calculation, physi-ological variables were obtained within the first 24 hours of admission to the intensive care unit, as were the age and information on chronic disease. On the other hand, an equa-tion established by Knaus et al. in 1985 was
used for the calculation of mortality risk.1 In the case of sedated patients still under imme-diate post-anesthesia observation, the score relating to the assessment of consciousness level via the Glasgow Scale was calculated only after the patient had overcome the anesthetic effect. For intubated patients, this score was calculated considering their capacity to un-derstand, regardless of speech. Recorded and expected mortality rates were compared for each group of patients, and the standard mor-tality ratio was calculated.
Statistical analysis
Student’s t test was used for comparing the averages of continuous measurements. The
chi-squared test was usedfor comparing the proportions of categorized measurements and showing trends in situations of ranking. Av-erages across more than two groups were com-pared via analysis of variance between groups (ANOVA). The predictive capability of the index was assessed using the receiver operat-ing characteristic curve, through a 2 x 2 deci-sion matrix and linear regresdeci-sion analysis. The Statistical Package for the Social Sciences (SPSS) program, version 10.01, and Epi Info
versions 6.04 and 2000 were used. p < 0.05 was considered statistically significant.
○ ○ ○ ○ ○ ○ ○ ○ ○ ○ ○ ○ ○ ○ ○RESU LTS○ ○ ○ ○ ○
The patients ranged from 13 to 91 years of age, with an average age of 50 ± 19 years. Three hundred and eighteen patients (61%) were male and 203 (39%) were female. With regard to the kind of hospitalization, 166 pa-tients (32%) were clinical, 173 (33%) were post-elective surgery patients and 182 (35%) were post-emergency surgery patients, thus producing statistically similar proportions.
Among the clinical patients, the four most frequent diagnostic categories (67% of the to-tal) were acute respiratory failure or insuffi-ciency, sepsis, cardiac failure or insufficiency and post-cardiopulmonary arrest. The four most frequent post-elective surgery categories (75% of the total) were gastrointestinal surgery, post revascularization of the myocardium, heart valve surgery and transplantations (of liver and kidney). For the patients who underwent emer-gency surgery, the four most frequent catego-ries recorded (70% of the total) were multiple trauma, abdominal surgery, surgery for sepsis or infection and head trauma. Trauma ac-counted for 15% of the diagnoses.
The patients’ average APACHE II score was 16.7 ± 7.3. The average APACHE II score for post-elective surgery patients was signifi-cantly lower than for the clinical patients and post-emergency surgery patients (respectively 13.0 ± 6.3, 18.5 ± 7.8 and 18.6 ± 6.5, p < 0.05). No differences between APACHE II averages for post-emergency surgery patients and clinical patients were recorded. Table 1 shows the distribution according to APACHE II score intervals and that 48% of the patients were in the interval between 11 and 20.
The average hospital mortality rate was 35.5%, with the highest mortality being that of clinical patients (53.6%), followed by emergency surgery patients (37.9%) and post-elective surgery patients (15.6%). The mor-tality rate recorded was higher than the pre-dicted mortality (25.6%) by APACHE II, in Table 1. Acute Physiology and Chronic Health Evaluation (APACHE II) scores of Intensive
Care Unit patients at the Santa Casa de São Paulo Hospital, from July 1998 to June 1999
APACHE II Patients
Scores N %
0 – 5 23 4.4
6 – 10 94 18.0 11 – 15 116 22.3 16 – 20 134 25.7 21 – 25 90 17.3 26 – 30 41 7.9
> 30 23 4.4
Total 521 100.0
Table 2. Actual and expected hospital mortality rates via APACHE II and the standardized mortality rate (SMR) - Data compiled from 521 Brazilian intensive
care unit patients’ medical files in the Intensive Care Unit of the Santa Casa de São Paulo Hospital, from July 1998 to June 1999
Patients Actual Expected p SMR
mortality % mortality %
Non-surgical 53.6 32.1 0.0001 1.67 Elective surgery 15.6 10.9 0.2052 1.43 Emergency surgery 37.9 33.6 0.3815 1.13
Total 35.5 25.6 0.0004 1.39
SMR = standardized mortality rate (actual/expected); χ² comparing actual and expected mortality (significance was considered when p < 0.05).
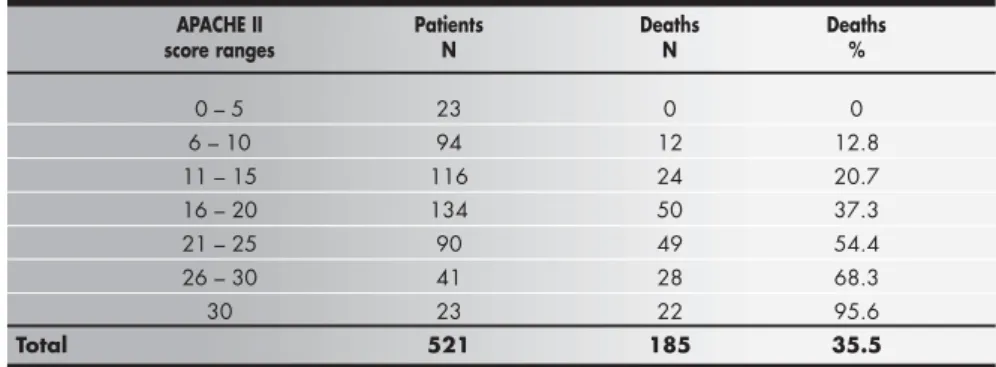
Table 3. APACHE II score ranges and deaths among 521 Brazilian intensive care unit patients of Santa Casa de São Paulo Hospital admitted from July 1998 to June 1999
APACHE II Patients Deaths Deaths
score ranges N N %
0 – 5 23 0 0
6 – 10 94 12 12.8 11 – 15 116 24 20.7 16 – 20 134 50 37.3 21 – 25 90 49 54.4 26 – 30 41 28 68.3
30 23 22 95.6
Total 521 185 35.5
χ²(linear trend) = 96.9; p < 0.001.
that the mortality rate observed in clinical patients was substantially higher than expected, whereas for post-elec-tive surgery patients and post-emergency surgery patients the mortality rates recorded were statistically similar to those expected. The standard mortality ratio for all patients was 1.39, ranging from 1.13 for post-emergency surgery pa-tients to 1.43 forpost-elective surgery patients and up to 1.67 for clinical patients (Table 2).
The comparison between APACHE II intervals and the mortality rate (Table 3) shows meaningful association between the APACHE II increases and the increase in mortality.
The counting of patients who survived and those who died, for each level of death risk predicted, allowed the calcu-lation of sensitivity, specificity and the percentage of correct predictions for each level of predicted death risk. Table 4 shows that the sensitivity of the calculated death risk was higher (90.3%) in level 0.1, and that it gradually decreased as the level increased, reaching 0% for level 1.0. Conversely, the specificity increased from 44.6% for level 0.1 up to 100% for death risk at 0.9. The most accurate prediction percentage (75.4%) occurred at death risk 0.4, with gradual decrease in accuracy when going upwards or downwards from this level. For death risk level 0.5, the correct classification was 72.2%, the sensitivity was 35.1% and the specificity was 92.6%.
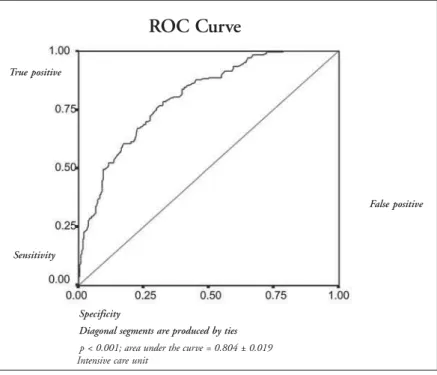
The receiver operating characteristic curve, based on the sensitivity and complemented specificity of predicted death risk, shows an area under the curve of 0.80 ± 0.02 (Figure 1).
The calibration curve, with the death rates recorded as the ordinate and the rates of predicted death as the ab-scissa, stratified into 10% risk ranges, had a linear regres-sion (r2) value = 0.923 (Figure 2).
○ ○ ○ ○ ○ ○ ○ ○ ○ ○ ○ ○ ○ ○ ○ ○ ○ ○D I SCU SSI O N○ ○ ○ ○ ○ ○ ○
The analysis of the population studied showed that the three groups of patients (clinical, post-elective surgery and post-emergency surgery) had similar percentages and numbers of patients. This differed from the study of Knaus et al.,7 in which higher frequencies of clinical (47%) and post-elective surgery (40%) patients were recorded.
The percentage of post-emergency surgery patients that we recorded was higher than that recorded by most other studies.6,7-11 There was a higher frequency of trauma (15%) in relation to American and European studies, but this was similar to what has already been found in Brazil,7,10,12 The patient distribution in the APACHE II score intervals showed highest concentrations in the intermediate ranges, coincid-ing with what was found by other authors.8,10,13 However, the percentage of patients with APACHE II scores of less than 10 (22.4%), and thus with less severe illness condi-tions, was much lower than for the US study, 56%.7 The APACHE II average14,15 was higher than what was recorded in the United States,7 Europe6,10 and Japan,8 similar to what has been found in Brazil16 and Canada,13 and lower than what was recorded in Hong Kong.14
There was a meaningful connection between APACHE II scores and the mortality rate, for all the patients and for each diagnostic group. In each successive APACHE II score
Table 4. Sensitivity, specificity and correct classification according to levels of predicted death risk from 521 Brazilian intensive care unit patients of the
Santa Casa de São Paulo Hospital admitted from July 1998 to June 1999
Predicted Sensitivity Specificity Correct
death risk % % classification %
0.1 90.3 44.6 60.8 0.2 75.7 69.9 72.0 0.3 60.5 82.7 74.8 0.4 49.2 89.9 75.4 0.5 35.1 92.6 72.2 0.6 23.8 96.7 70.8 0.7 13.5 98.8 68.5 0.8 7.0 99.4 66.6 0.9 2.2 100.0 65.3 1.0 0 100.0 64.5 Observed
death rate (%)
Predicted death rate (10% ranges)
p < 0.001; r2 = 0.923; slope of the line = 0.961
Figure 2. Calibration curve constructed by plotting observed death rate against predicted death rate, stratified
into 10% risk ranges, from 521 Brazilian intensive care unit patients, of the Santa Casa de São Paulo
Hospi-tal admitted July 1998 to June 1999.
Figure 1. Receiver operating characteristic curve (ROC) from 521 Brazilian intensive care unit patients of the
Santa Casa de São Paulo Hospital admitted from July 1998 to June 1999.
True positive
False positive
ROC Curve
Sensitivity
p < 0.001; area under the curve = 0.804 ± 0.019 Intensive care unit
Specificity
interval the mortality rate was higher than that of the preceding interval. Thus, this result has confirmed the capability of this index to stratify such patients according to the degree of severity of their health condition, as seen in the study by Knaus et al.7 and in Brazil.11
In conformity with the features mentioned, important differences can be observed between our study’s patients and those of other studies that have assessed the applicability of APACHE II. The most relevant of these are: lower aver-age aver-age, higher percentaver-age of post-emergency surgery patients, lower percentage of post-elec-tive surgery patients, higher percentage of trau-mas, higher APACHE II average, and lower percentage of patients with APACHE II score lower than 10. Thus, our patients were younger, with a higher frequency of multiple trauma and acute surgical diseases that were more severe than those of the studies referred to.
On account of such differences, it has become important to assess the predictive ca-pability of this prognostic index for particu-lar patient populations. The ability of this gra-dational system to predict mortality rates for different patient groups has been assessed in several countries.8,9,12-14,17-19 The following items have been used for assessing the predic-tive capability of the APACHE II index: re-ceiver operating characteristic curve, 2 x 2 decision matrix, and linear regression analysis (calibration curve).
Analysis of the receiver operating charac-teristic curve for hospital death prediction showed an area under the curve of 0.80, which was higher than the random prediction, but not enough to predict accurately the mortal-ity rate of such patient populations. In com-paring the capability of the APACHE II sys-tem for predicting mortality through this method, we observed that in this patient popu-lation it was meaningfully lower than what was recorded in the study by Knaus et al.7 and some from other countries,9,13,14,19 but similar to what was recorded in other studies,6,8,17 in-cluding one from Brazil.20
In the 2 x 2 decision matrix assessment, the most accurate classification percentage was obtained using criterion 0.4, which cor-rectly classified 75.2% of the patients. With a 0.5 decision criterion, 72.2% patients were correctly classified. This correct classification was better than that recorded by random pre-cision, yet not accurate enough to predict these patients’ mortality, and also substan-tially less accurate than the classification found in other countries for similar decision criteria.1,6,14,17 Thus, of the three statistical methods assessed, the APACHE II system
showed good capability for stratifying this patient population according to mortality, with good discriminating power, good cali-bration, reasonable sensitivity and specificity, and a correct classification rate, but still with insufficient accuracy for predicting the mor-tality rate with precision.
The total mortality rate recorded was 35.5%. Mortality rates recorded in other countries have ranged from 16.9% to 36%1,8,14,17 and in Brazil from 38.1%16 to 40.5%.15 Costa et al.11 found a mortality rate of 28.5%, but their study considered inten-sive care unit mortality only, and not hospital mortality, as in other studies.
The predicted mortality rate was substan-tially lower than what was actually recorded, with a standard mortality ratio of 1.39, which was lower than the figure of 1.66 found in the multicenter study in Brazilian intensive care units.12 The standard mortality ratio has ranged from 0.59 to 1.58 in American hospi-tals, whereas in Europe it has ranged from 0.7 to 1.39.7,17 Bastos et al.12 assessed the use of APACHE II in a Brazilian multicenter study with 1.781 patients, and showed that it was able to stratify patients by mortality rate. However, a meaningful difference was found between the expected mortality rate and what was actually recorded, with a standard mor-tality ratio of 1.66 (variation from 0.95 to 2.4). Also in Brazil, Milani and Rocha15 found a standard mortality ratio of 1.20, but these authors only considered intensive care unit mortality, and not hospital mortality, as in this study and others mentioned earlier.
Many factors may explain the difference between the predicted mortality and what was actually recorded. These may include: the limi-tations of APACHE II, which is not a perfect prediction instrument; differences between this population and those of the studies that validated the index (some patient features like nutritional, ethnic, social, cultural and eco-nomic conditions); and its use in circum-stances not applied by Knaus et al. (e.g. fol-lowing revascularization of the myocardium).7 Other differences may include the criteria for selecting intensive care unit patients and also the availability of beds. Such aspects definitely affect the results, as well.
At the hospital where this study was car-ried out, the percentage of intensive care unit beds in relation to the total number is lower than in other countries, particularly the United States, where the APACHE II system was de-veloped. Thus, at the time of the study by Knaus et al.,7 the percentage of intensive care unit beds in relation to the overall number of beds in
United States’ hospitals was 5.6% and this in-creased to 10% by 1992.18 On the other hand, in Europe this percentage ranged from 2.6% to 3.8%, and in Japan it was 2%.8 At our hos-pital, it was 2.5%, thus demonstrating the lim-ited availability of intensive care unit beds. The characteristics of such a tertiary hospital school, which is a referral center for multiple trauma patients and highly complex procedures, un-derline the need for a larger number of inten-sive care unit beds. Some other relevant differ-ences with the other countries involved, which have an influence on the results, relate to health and cost policies, as well as financial conditions and resources made available.
Although the APACHE II index was not developed for assessing individual prognoses, intensive care unit physicians and medicine as a whole have yearned for such predictive abil-ity. Thus, many studies have attempted to as-sess the use of this index with this purpose in mind.13 In this study, an absence of specificity for predicting individual death was noticed. Therefore, for individual procedures, we can-not depend only on this index and its formula for calculating death risk. Other issues that underlie these decisions, including those of an ethical nature, must be respected.21 However, APACHE II may be useful as an additional instrument for backing up clinical decisions.
This study showed that in this popula-tion, APACHE II was capable of stratifying patients according to illness severity in rela-tion to mortality. However, it was not as ac-curate as in other studies.7,8,13,14,19 It had good discriminating power for distinguishing pa-tients who survived from those who died; it also had good calibration, but it was gener-ally not sensitive, specific and accurate enough to predict the patients’ exact mortality. Like-wise, it was not accurate enough to predict the patients’ individual mortality. Thus, on account of the differences amongst intensive care unit patients, each intensive care unit needs to have a prediction system that is vali-dated for its specific kind of patients, and needs to verify its standard mortality rate. Some factors for calculating mortality correc-tions must also be established, in order to help estimate the mortality of similar patient groups in the same intensive care unit. It is just as important to develop and perfect indices that assess not only the patients’ mortality rate, but also their quality of life after hospitalization within intensive care units. In our intensive care unit, we have been using this prognosis index and attempting to determine correction factors so as to improve the capacity for esti-mating patient prognoses.
○ ○ ○ ○ ○ ○ ○ ○ ○ ○ ○ CO N CLU SI O N○ ○ ○ ○ ○ ○ ○ ○ ○
The APACHE II prognostic index was uful for stratifying patients according to the se-verity of their health condition. The higher the APACHE II score was, the higher the mortality
rate was. The severity and mortality rates were different and they were assessed in the following decreasing order: clinical patients, post-emer-gency surgery patients and post-elective surgery patients. The predictive capability of APACHE II was good, but not enough to accurately
pre-dict the mortality among the population stud-ied. The recorded mortality rate was similar to the predicted rate for surgical patients and higher than what was predicted for clinical patients. In general terms, the recorded mortality rate was higher than expected from the APACHE II score.
CONTEXTO: Pela complexidade do
atendimen-to nas unidades de terapia intensiva e a pró-pria situação dos pacientes, o prognóstico correto é de fundamental importância. Os índices prognósticos surgiram para auxiliar na avaliação do prognóstico destes pacientes.
OBJETIVO: Avaliar o APACHE II (Acute
Physiology and Cronic Health Evaluation II), analisando a estratificação dos pacientes quanto à letalidade, comparar a gravidade e condições de saída dos pacientes clínicos, pós-cirurgias eletivas, e pós-cirurgias de urgências; avaliar a capacidade do APACHE II de prever a letalidade hospitalar; e comparar a letalidade hospitalar observada com a esperada.
TIPO DE ESTUDO: de acurácia, retrospectivo.
LOCAL: Unidade de terapia intensiva da Santa
Casa de Misericórdia de São Paulo (hospital terciário de ensino universitário).
PARTICIPANTES: 521 pacientes
consecutiva-mente admitidos entre julho de 1998 a ju-nho de 1999.
VARIÁVEIS ESTUDADAS: Escore APACHE II,
mortalidade intra-hospitalar. A acurácia do APACHE II foi avaliada pela curva receiver operating characteristic, pela decisão matricial e pela regressão linear.
RESULTADOS: A idade média foi 50 ± 19 anos e
a média do APACHE II foi de 16,7 ± 7,3. Entre os internados, 166 pacientes (32%) ti-nham doenças clínicas, 173 (33%) sofreram
○ ○ ○ ○ ○ ○ ○ ○ ○ ○ ○ ○ ○ ○ ○ ○ ○ ○ ○ ○ ○ ○ ○ ○ ○ ○ ○ ○ ○ ○ ○ ○ ○ ○ ○ ○RESU M O○ ○ ○ ○ ○ ○
cirurgias eletivas e 182 (35%), cirurgias de urgências, sendo esta proporção estatisticamen-te similar. A média do APACHE II dos paci-entes clínicos foi 18,5 ± 7,8, dos pacipaci-entes pós-cirurgias de urgências, 18,6 ± 6,5 e dos paci-entes pós-cirurgias eletivas foi 13,0 ± 6,3. Quanto maior o APACHE II, maior a letalidade para todos os pacientes e para cada grupo. A letalidade prevista foi 25,6%, enquan-to a observada foi 35,5%, com razão de mor-talidade padronizada de 1,39. A análise da curva receiver operating characteristic mostrou boa discriminação do índice (área sob a curva = 0,80). Com a matriz de decisão 2 x 2, 72,2% dos pacientes foram corretamente classificados, sendo a sensibilidade 35,1% e a especificidade 92,6% (risco de 0,5). Quando a letalidade observada foi relacionada com a prevista, a análise de regressão linear mostrou r2 de 0,92.
CONCLUSÕES: O APACHE II foi útil para
estratificar os pacientes pela letalidade. A gra-vidade e a letalidade dos pacientes clínicos foram maiores que dos pacientes cirúrgicos. A capacidade do sistema APACHE II de estratificação foi boa, mas insuficiente para predizer com exatidão a letalidade destes pa-cientes. A letalidade observada foi maior que a prevista pelo APACHE II.
PALAVRAS-CHAVE: APACHE II. Índices.
Prog-nósticos. Gravidade. Doença.. Unidade Te-rapia. Intensiva.
Acknowledgments: The authors are grateful to all the mem-bers of the multidisciplinary professional staff of the intensive care unit of the Santa Casa de São Paulo Hospital, as well as to all of their patients for making this study possible. Special thanks to Expedito José de A. Luna, MD, for his assistance in the statistical analysis, to Mrs Maria da Glória Chiavone de Andrade for her contribution to the paper’s art and layout, tables and illustrations and to Mr. Alexandre Aikawa for his very important contribution regarding translation.
Paulo Antonio Chiavone, MD, MSc. Assistant profes-sor in the Faculdade de Ciências Médicas da Santa Casa de São Paulo; director of the Departament of Intensive Therapy of Santa Casa de São Paulo, São Paulo, Brazil.
Yvoty Alves dos Santos Sens, MD. Faculdade de Medicina, Universidade de São Paulo; Associate professor of the Faculdade de Ciências Médicas da Santa Casa de São Paulo; director of the Department of Nefrology and Renal Transplant of Santa Casa de São Paulo, São Paulo, Brazil.
Sources of financial support: None
Conflict of interest: None
Date of first submission: August 20, 2002
Last received: October 11, 2002
Accepted: November 1, 2002
Address for correspondence:
Paulo Antonio Chiavone Serviço de Terapia Intensiva
Santa Casa de Misericórdia de São Paulo Rua Dona Veridiana, 311 – 3o andar
São Paulo/SP – Brasil - CEP 01238-010 Tel./Fax (+55 11) 3224-0578/3226-7700 Ext. 5331 E-mail: [email protected]
COPYRIGHT © 2003, Associação Paulista de Medicina
○ ○ ○ ○ ○ ○Pu b l i sh i n g i n f o r m a t i o n○ ○ ○ ○ ○ ○ ○ ○ ○ ○ ○ ○ ○ ○
1. Knaus WA, Draper EA, Wagner DP, Zimmerman JE. APACHE II: a severity of disease classification system. Crit Care Med 1985;13(10):818-29.
2. Knaus WA, Wagner DP, Draper EA, et al. The APACHE III prognostic system. Risk prediction of hospital mortality for criti-cally ill hospitalized adults. Chest 1991;100(6):1619-36. 3. Le Gall JR, Lemeshow S, Saulnier F. A new Simplified Acute
Physiology Score (SAPS II) based on a European/North Ameri-can multicenter study. JAMA 1993;270(24):2957-63. 4. Lemeshow S, Klar J, Teres D, et al. Mortality probability models
for patients in the intensive care unit for 48 or 72 hours: a pro-spective, multicenter study. Crit Care Med 1994;22(9):1351-8. 5. Brasil. Ministério da Saúde. [Ministry of Health] Portaria no 2.918, de 09 de junho de 1998. Estabelece critérios de classificação entre as unidades de tratamento intensivo. [Estab-lishes the classification criteria for different intensive care units]. Diário Oficial da União 1998;11(15 de junho de 1998):39. 6. Markgraf R, Deutschinoff G, Pientka L, Scholten T. Comparison
of acute physiology and chronic health evaluations II and III and simplified acute physiology score II: a prospective cohort study evaluating these methods to predict outcome in a German inter-disciplinary intensive care unit. Crit Care Med 2000;28(1):26-33. 7. Knaus WA, Draper EA, Wagner DP, Zimmerman JE. An evalu-ation of outcome from intensive care in major medical centers. Ann Intern Med 1986;104(3):410-8.
○ ○ ○ ○ ○ ○ ○ ○ ○ ○ ○ ○ ○ ○ ○ ○ ○ ○ ○ ○ ○ ○ ○ ○ ○ ○ ○ ○ ○ ○ ○ ○ ○ ○ ○ ○ ○ ○ ○ ○ ○ ○ ○ ○ ○ ○ ○ ○ ○ ○ ○ ○ ○ ○ ○ ○ REFEREN CES○ ○ ○ ○ ○ ○ ○ ○
8. Sirio CA, Tajimi K, Tase C, et al. An initial comparison of in-tensive care in Japan and the United States. Crit. Care Med 1992;20(9):1207-15.
9. Chen FG, Koh KF, Goh MH. Validation of APACHE II score in a surgical intensive care unit. Singapore Med J 1993;34(4):322-4. 10. Beck DH, Taylor BL, Millar B, Smith GB. Prediction of out-come from intensive care: a prospective cohort study compar-ing Acute Physiology and Chronic Health Evaluation II and III prognostic systems in a United Kingdom intensive care unit. Crit Care Med 1997;25(1):9-15.
11. Costa JI, Gomes do Amaral JL, Munechika M, Juliano Y, Bezerra Filho JG. Severity and prognosis in intensive care: prospective application of the APACHE II index. São Paulo Med J 1999;117(5):205-14.
12. Bastos PG, Sun X, Wagner DP, Wu Aw, Knaus WA. Glasgow Coma Scale score in the evaluation of outcome in the intensive care unit: findings from the Acute Physiology and Chronic Health Evaluation III Study. Crit Care Med 1993;21(10):1459-65. 13. Wong DT, Crofts SL, Gomez M, McGuire GP, Byrick RJ.
Evalu-ation of predictive ability of APACHE II system and hospital outcome in Canadian intensive care unit patients.Crit Care Med 1995;23(7):1177-83.
14. Oh TE, Hutchinson R, Short S, Buckley T, Lin E, Leung D. Verification of the Acute Physiology and Chronic Health Evalu-ation scoring system in a Hong Kong intensive care unit. Crit
Care Med 1993;21(5):698-705.
15. Milani Júnior R, Rocha AS. Acurácia prognóstica e eficácia de tratamento em UTI avaliadas pelo sistema APACHE II. Rev Hosp Clin Fac Med São Paulo 1989;44(4):149-52. 16. Gonçalves WM, Kruel NF, Araújo PA, Teixeira DO. Análise do
sistema prognóstico de mortalidade apache II em pacientes cirúrgicos de unidade de terapia intensiva. Rev Col Bras Cir 1999;26(2):115-8.
17. Rowan KM, Kerr JH, Major E, McPherson K, Short A, Vessey MP. Intensive Care Society’s APACHE II study in Britain and Ireland II: Outcome comparisons of intensive care units after adjustment for case mix by the American APACHE II method. BMJ 1993;307(6910):977-81.
18. Zimmerman JE, Knaus WA, Judson JA, et al. Patient selection for intensive care: a comparison of New Zealand and United States hospitals. Crit Care Med 1988;16(4):318-26. 19. Giangiuliani G, Mancini A, Gui D. Validation of a severity of
illness score (APACHE II) in a surgical intensive care unit. In-tensive Care Med 1989;15(8):519-22.
20. Livianu J, Orlando JM, Maciel FM, Proença JO. Comparison of 3 severity of illness scoring systems for intensive care unit (ICU) patients. Crit Care Med 1998;26(1 Suppl):A125. 21. Dowling RD, Landreneau RJ, Wachs ME, Ferson PF.