Nutritional status and interdialytic weight gain of chronic
hemodialysis patients
Authors
Sanzia Francisca Ferraz 1 Ana Tereza Vaz de Souza Freitas 2
Inaiana Marques Filizola Vaz 2
Marta Isabel Valente Andrade Morais Campos 2
Maria do Rosário Gondim Peixoto 2
Edna Regina Silva Pereira 2
1 Hospital de Doenças Tropicais. 2 Universidade Federal de Goiás.
Submitted on: 10/10/2014. Approved on: 12/11/2014.
Correspondence to: Sanzia Francisca Ferraz. Faculdade de Nutrição da Universidade Federal de Goiás. Avenida Botafogo, Quadra 112, Lote 13, Setor Pedro Ludovico, Goiânia, Goiás, Brasil. CEP: 74830030.
E-mail: [email protected] Tel: (62) 3255-1830.
I
NTRODUCTIONThe nutritional status of patients with chronic kidney disease (CKD) on hemodialysis (HD) is cause for concern and challenge for the multidisciplinary teams who assist them. Malnutrition is common in these patients and it is related to a worse prognosis.1-3 In addition to
lower survival, malnourished patients on dialysis have higher morbidity,4,5
more functional disability6,7 and worst
quality of life;2,4 hence the importance
of monitoring and enhancing their nutritional status.
In this context, many are the studies8-12 indicating positive
correlations between interdialytic weight gain (IDWG) and diet, which makes this parameter a putative indicator of the nutritional status of patients on hemodialysis.
Nevertheless, IDWG is also seen with clinically negative connotation, such as a risk for hypertension, congestive heart failure, hyponatremia, and complications related to the rapid removal of fluids during HD (hypotension, angina, arrhythmia and cramps).12-14 Thus, HD patients are
often advised to limit their IDWG. However, such practice may result in adverse clinical outcomes, since the attempt to avoid fluid overload can jeopardize the nutritional statuses of these pacientes.9,12,15
DOI: 10.5935/0101-2800.20150050
Introduction: The nutritional status
(NS) of patients on hemodialysis (HD) is a major concern and challenge. Malnutrition is common in these patients and is related to poorer clinical outcomes. Objectives: To assess the association between the NS and the interdialytic weight gain (IDWG) of patients with chronic kidney disease (CKD) on HD. Methods: Cross-sectional study with 322 patients older than 18 years. The NS was assessed by body mass index (BMI), percentage body fat estimated by the sum of four skinfolds (triceps, biceps, subscapular and supra iliac), lean body mass (LBM), serum creatinine and albumin and rate of nitrogen appearance (PNA). The IDWG was evaluated from the sum of the weight difference of 12 hemodialysis sessions (IDWGm). Results: Considering the sample into quartiles IDWGm, it was found that BMI, LBM, serum creatinine (p < 0.001) and PNA (p = 0.011) were directly correlated. There was no association between IDWGm and serum albumin. Using multivariate analysis, it was found that the prevalence of patients with BMI suitability and serum creatinine were significantly higher for patients in the bottom quartile with respect to the first IDWGm. Conclusion:
The NS is positively associated with IDWG. The results point to the need for individualized assessment of IDWG and cautious in order not to generalize a recommendation that does not meet the expectations of maintaining and promoting the nutritional status of these patients.
A
BSTRACTKeywords: malnutrition; nutritional
Pinpointing the IDWG range of patients with better nutritional status can help reduce the risk of malnutrition and bring about an ideal nutritional status. Thus, this study aimed to analyze the association between nutritional status and IDWG of CKD patients on Hemodialysis.
M
ETHODSThis is a cross-sectional study carried out between May 2009 and March 2010, with clinically stable patients on regular HD programs from ten clinical centers in Goiânia, Goiás. The research project was assessed and approved by the Ethics in Human and Animal Research Committee from the University Hospital of the Federal University of Goiás (HC/UFG).
The study included patients over 18 years old, of both genders, on HD for over a year, anuric or with residual urine output < 100 ml/day and no clinical evidence of inflammatory and infectious processes in the past three months. The exclusion criteria were: use of central venous catheter, neoplasms, uncontrolled diabetes mellitus, chronic inflammatory diseases, severe lung disease and symptomatic heart failure (classes III and IV).16
Sample size was calculated considering the total number of individuals on HD in Goiania in 2008 (n = 1400), according to Municipal Health Secretariat data. For this estimate, we also considered the prevalence of malnutrition in this population as being 50%,17-19 with 95%
confidence and 5% error. The required sample had 302 patients and at the end of the study, we evaluated 361 individuals in proportion to the total number of patients from each HD center. From all the patients evaluated, 322 were included in the final sample because they fit into all established selection criteria.
All patients underwent HD through an arteriovenous fistula every three weeks, with session time between 3.5 and 4 hours, dialysis with bicarbonate buffer solution, containing glucose and sodium concentration between 135 and 142 mEq/L. Among all patients, 91% used high performance polysulphone dialyzers, with
an area between 1.2 and 2.2 m2, while 9% used
cellulose acetate dialyzers, with an area between 1.6 and 2.1 m2.
Clinical data such as time in HD, pre-dialysis systolic blood pressure (SBP) and diastolic blood pressure (DBP), causes of CKD, comorbidities, dry weight and IDWG were learned from medical records of each patient and confirmed with the local medical staff. The mean arterial pressure was obtained by averaging 12 blood pressure measurements before the HD session. Hypertensive patients were those with mean BP
≥ 140/90 mmHg or those on anti-hypertensive medication.20 Mean IDWG (IDWGm) was
calculated from the sum of the difference between the patient’s weight upon entering and leaving 12 HD sessions, and the IDWGm = Σ entry weight - Output weight ÷ number of sessions. The relative IDWG (IDWGr) was obtained by dividing the IDWGm by the patient’s dry weight, IDWGr = IDWGm ÷ dry weight X 100.11,21 An
IDWGm ≤ 2.5 kg and an IDWGr ≤ 4.5% over the dry weight were considered normal values.22
The demographic data we analyzed included gender and age. We assessed the nutritional status based on anthropometric and laboratory parameters, and we calculated the nitrogen appearance rate (NAR). The dialysis efficiency was estimated by calculating the Kt/V, using the value ≥ 1.2 as the cutoff point for normality - following current guidelines for HD adequacy.23
Body mass index (BMI) was obtained from the ratio between the average dry weight and the square of height; and the patients’ nutritional statuses were classified as recommended by the World Health Organization (WHO).25 The
skinfolds were measured in millimeters, using the Lange Skinfold Caliper according to the Lohman, Roche and Martorell protocol.26 Body fat (BF)
was estimated as a percentage and in kg, from the sum of the four skinfold measurements, using the equations from Durnin & Womersley27 and
Siri.28 LBM was calculated in kilograms by the
difference between the dry weight and body fat. The laboratory parameters analyzed were serum levels of albumin, creatinine and urea before and after HD. The biochemical measurements were performed on the Konelab 30 biochemical analyzer, and albumin was evaluated by the colorimetric method (bromocresol green); and serum creatinine and urea by the kinetic method. All analyses were performed by the University Hospital Clinical Laboratory - UFG. To interpret the nutritional status, we considered the following as normal values: serum creatinine ≥ 10 mg/ dL,29,30 serum albumin> 4.0 g/dL;22,29 NAR ≥ 1.0
g/Kg21 and BMI > 23Kg/m².22
Protein intake was estimated by calculating the protein equivalent of the nitrogen appearance rate (NAR)
nutritional characteristics were performed by the Pearson chi-square test for categorical variables and ANOVA, and Kruskal Wallis test for continuous variables. Mean differences between groups were analyzed by the Tukey test.
Associations between among IDWGm quartiles with indicators of nutritional status: serum creatinine ≥ 10 mg/dL and BMI > 23 kg/m² were analyzed by the Poisson regression model with robust variance adjusted for clinical and demographic conditions. We included in the regression the variables in the bivariate analysis that had significance below 20% (p < 0.20). The level of significance was set at p < 0.05.
R
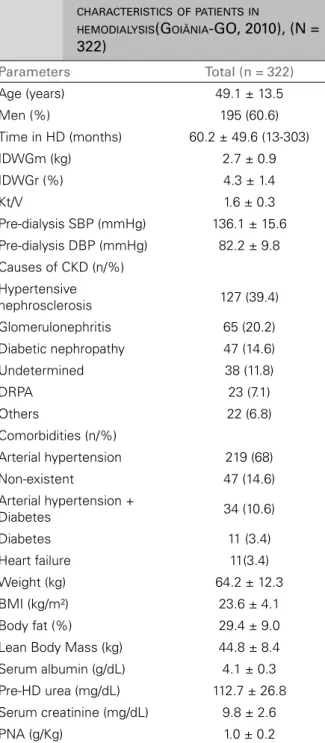
ESULTSTable 1 depicts the general characteristics of the patients. We had 322 patients analyzed, aged 19-90 years, 76% adults and 24% older than 60 years. The HD treatment time ranged from 13 to 303 months. The IDWGm was above the recommended, the IDWGr was within the expected range, although it is important to point out that 41.6% of patients had IDWGr > 4.5%. Hypertensive nephrosclerosis was the most frequent cause of CKD (39.4%), followed by chronic glomerulonephritis (20.2%) and diabetes (14.6%), while the most prevalent comorbidity was hypertension (68%).
The population showed, on average, adequate levels for BMI, with 54% had optimal values for HD patients (BMI > 23 kg/m²). The prevalence of underweight patients (BMI < 18.5 kg/m2) was
8%, while normal weight (BMI between 18.5-24.9 kg/m2) and overweight (BMI ≥ 25 kg/m2)
patients totaled 60% and 32%, respectively. As for laboratory data, our sample had a suitable average level for albumin, with 64% of patients presenting values above 4.0 g/dL. However, serum creatinine was, on average, below recommended values, with 56% of patients with values below the ideal for HD patients. On average, NAR levels were as recommended, although the percentage of patients with lower levels was 53%.
(NAR) = NAR (g/day) = pre-dialysis serum ureic
nitrogen ÷ [36.3 + (5.48) x (Kt/V)] + 0.168.29
STATISTICAL ANALYSIS
Data was double entered and subsequently validated. After validation and consistency analysis, the data was analyzed using the Statistical Package for Social Sciences, version 18.0 for Windows (SPSS, Inc. Chicago) and presented as mean, standard deviation and frequency. All continuous variables were previously evaluated for normality using the Kolmogorov-Smirnov test, considering a p≥ 0.05 as normal.
TABLE 1 DEMOGRAPHIC, CLINICALANDNUTRITIONAL
CHARACTERISTICSOFPATIENTSIN
HEMODIALYSIS(GOIÂNIA-GO, 2010), (N =
322)
Parameters Total (n = 322)
Age (years) 49.1 ± 13.5 Men (%) 195 (60.6) Time in HD (months) 60.2 ± 49.6 (13-303) IDWGm (kg) 2.7 ± 0.9 IDWGr (%) 4.3 ± 1.4
Kt/V 1.6 ± 0.3
Pre-dialysis SBP (mmHg) 136.1 ± 15.6 Pre-dialysis DBP (mmHg) 82.2 ± 9.8 Causes of CKD (n/%)
Hypertensive
nephrosclerosis 127 (39.4) Glomerulonephritis 65 (20.2) Diabetic nephropathy 47 (14.6) Undetermined 38 (11.8)
DRPA 23 (7.1)
Others 22 (6.8) Comorbidities (n/%)
Arterial hypertension 219 (68) Non-existent 47 (14.6) Arterial hypertension +
Diabetes 34 (10.6) Diabetes 11 (3.4) Heart failure 11(3.4) Weight (kg) 64.2 ± 12.3 BMI (kg/m²) 23.6 ± 4.1 Body fat (%) 29.4 ± 9.0 Lean Body Mass (kg) 44.8 ± 8.4 Serum albumin (g/dL) 4.1 ± 0.3 Pre-HD urea (mg/dL) 112.7 ± 26.8 Serum creatinine (mg/dL) 9.8 ± 2.6 PNA (g/Kg) 1.0 ± 0.2
Table 2 depicts the clinical and demographic characteristics according to IDWGm distribution by quartiles. The prevalence of hypertension was 68%. Average blood pressure levels were not associated with IDWGm. Age and gender were associated with IDWGm; the number of elderly patients was significantly lower in the last quartile in relation to the other quartiles (p < 0.001); and females were associated with lower IDWG (p < 0.001).
There was strong association between IDWGm and nutritional parameters (Table 2). Patients in the highest IDWGm quartile had higher body weight, BMI and LBM (p < 0.001), higher levels of serum creatinine (p < 0,001) and higher NAR (p = 0.011) compared to those in the other quartiles. IDWGm was not associated with serum albumin levels. Considering the BMI for nutritional diagnosis of the population, there was a significantly higher number of patients with low body weight (supposedly malnourished) in the first two quartiles of IDWG. The number of well-nourished patients was statistically higher in the last two quartiles, while those who were overweight (supposedly better fed) were associated with the higher range of interdialytic weight gain. Patients with better nutritional status, according to the investigated parameters, had average IDWGm of 4.1 ± 0.6 kg and IDWGr of 5.9 ± 1.3%.
After a multivariate analysis, we concluded at the prevalence of patients with adequate BMI (> 23 kg/m2) in the last quartile of IDWGm
was 79% higher (PR = 1.79; 95% CI: 1.33 to 2.4) compared to the first quartile, while the prevalence of adaptation to serum creatinine was 52% higher (PR = 1.52; 95% CI: 1.01 to 2.3) (Table 3).
D
ISCUSSIONAlthough most patients in this study had BMI and serum albumin levels as expected, the assessment of other parameters such as serum creatinine and NAR indicated impaired LBM and/or impaired protein ingestion.30,31 These findings suggest a
common problem to the population in HD: poor or inadequate dietary intake32-34 associated with
the most common cause of impairment to the nutritional status.22,32 Nonetheless, one of the
limitations of this study was not evaluating the direct contribution of food consumption on the IDWG.
Until recently, the ideal and excessive IDWG were arbitrarily interpreted.9,10,12,35 Currently,
TABLE 2 CLINICAL, DEMOGRAPHICANDNUTRITIONALCHARACTERISTICSACCORDINGTOTHEMEANINTERDIALYTICWEIGHT
GAINQUARTILESOFPATIENTSINHEMODIALYSIS - GO, 2010 (N = 322)
IDWGm IDWGm IDWGm IDWGm
p*
≤ 2.1kg > 2.1 ≤ 2.7kg > 2.7 ≤ 3.4kg > 3.4kg
n = 92 n = 82 n = 78 n = 70
IDWGm (kg) 1.7 ± 0.3a 2.5 ± 0.2b 3.1 ± 0.2c 4.1 ± 0.6d < 0.001
IDWGr (%) 3.1 ± 0.8a 4.0 ± 0.8b 4.8 ± 0.8c 5.9 ± 1.3d < 0.001
Time in HD
(months) 55.2 ± 42.9 55.6 ± 48 61.3 ± 48.8 70.7 ± 58.8 0.185*** Kt/V 1.6 ± 0.2 1.6 ± 0.3 1.5 ± 0.3 1.5 ± 0.3 0.313 Arterial
hypertension (n/%)
62 (67.4) 58 (70.7) 59 (75.6) 40 (57.2) 0.479**
SBP (mmHg) 136.1 ± 15.7 136.2 ± 16.3 136.2 ± 14.1 136.1 ± 16.5 0.999 DBP (mmHg) 81.2 ± 10.8 82.9 ± 7.9 83.0 ± 7.8 81.7 ± 12.0 0.513 Age (years) 51.7 ± 14.5 49.0 ± 14.9 48.6 ± 13.4 46.2 ± 8.9 0.071 Age range
< 60 years 58 (63)a 63 (76.8)b 59 (75.6)b 65 (92.9)c < 0.001**
≥ 60 years 34 (37)a 19 (23.2)b 19 (24.4)b 5 (7.1)c
Gender (n/%)
Men 41 (44.6)a 48 (58.5)a.b 54 (69.2)b.c 52 (74.3)c < 0.001**
Women 51 (55.4)a 34 (41.5)a.b 24 (30.8)b.c 18 (25.7)c
Weight (kg) 57.9 ± 9.3a 62.7 ± 11.3b 66.2 ± 10.2c 71.8 ± 14.4d < 0.001
Nutritional Status (n/%)
Low weight 20 (21.7)a 15 (18.3)a 6 (7.7)b 3 (4.29)b < 0.001**
Eutrophic 58 (63.0)a 51 (62.2)a 47 (60.3)a.b 26 (37.1)b
Overweight 14 (15.2)a 16 (19.5)a 25 (32.0)a 41 (58.5)b
BMI (kg/m²) 22.4 ± 3.4a 23.0 ± 3.8a.b 23.9 ± 3.8b 25.6 ± 4.6c < 0.001
BMI > 23kg/m²
(n/%) 38 (41.3)
a 40 (48.8)a.b 46 (59.9)b 50 (71.4)c < 0.001**
BF (%) 29.7 ± 9.3 28.6 ± 9.2 29.6 ± 8.3 29.7 ± 9.2 0.823 LBM (kg) 40.5 ± 7.3a 44.4 ± 7.8b 46.3 ± 7.6b 49.8 ± 8.9c < 0.001
Serum creatinine
(mg/dL) 8.7 ± 1.9
a 9.4 ± 2.3b 9.9 ± 2.1b 11.6 ± 2.5c < 0.001
Serum creatinine
≥ 10mg/dL 23 (25.5)
a 30 (36.6)a.b 40 (51.3)b.c 54 (69.2)c < 0.001**
Serum albumin
(g/dL) 4.1 ± 0.3 4.2 ± 0.3 4.1 ± 0.3 4.1 ± 0.2 0.961 Albumin > 4.0g/dL 59 (64.1) 54 (65.9) 49 (62.8) 49 (70) 0.950** NAR (g/kg) 1.0 ± 0.2a 1.0 ± 0.2a 1.0 ± 0.2a 1.1 ± 0.2b 0.011
NAR ≥ 1.0g/kg 40 (43.5) 36 (43.9) 36 (46.2) 39 (55.7) 0.403** a,b,c,d Mean values of the same line with equal letters are statistically significant among each other (p ≤ 0,05). HD: hemodialysis; Kt/V: dialysis
adequacy index; SBP: systolic blood pressure; DBP: diastolic blood pressure; BMI: body mass index; BF: Body Fat; LBM: Lean body mass; NAR: Ureic nitrogen appearance rate; * ANOVA; **χ2 test; *** Kruskal Wallis.
4 to 4.5% of IDWG on the dry weight during the interdialytic period.22 However, a higher
IDWG may be justified for patients with higher body weight, especially when associated with increased LBM, as demonstrated in this study.
Different studies also support the hypothesis of better nutritional status in patients with IDWGr > 4.5%,9,10,12 suggesting that the current
TABLE 3 PREVALENCERATIO (PR) * FORINTERDIALYTICWEIGHTGAINFORPATIENTSINHEMODIALYSIS. GOIÂNIA,
GO - 2010, (N = 322)
Variables **BMI > 23kg/m² p ***Serum
creatinine ≥ 10mg p
IDWGm ≤ 2.10 kg 1.00 1.00
IDWGm 2.11-2.70 kg 1.27 (0.93 - 1.73) 0.121 1.15 (0.7 5 - 1.75) 0.509 IDWGm 2.71-3.40 kg 1.52 (1.14 - 2.03) 0.004 1.39 (0.94 - 2.10) 0.100 IDWGm > 3.40 kg 1.79 (1.33 - 2.40) < 0.001 1.52 (1.01 - 2.30) 0.045
* Poisson regression - 95%CI; ** Model adjusted for gender, age, creatinine, NAR and time in HD; *** Model adjusted for gender, age, BMI, NAR and time in HD.
for patients on HD, especially considering the nutritional indicators and their respective cut-off points used in this study. Importantly, an ideal nutritional indicator should be able to predict clinical outcomes and identify patients who need nutritional intervention.31
In this study, female patients and the elderly had lower IDWG, while individuals with higher BMI and LBM, and higher levels of serum creatinine and NAR had higher IDWG. These results confirm data already published in the literature, i.e. IDWG diminishes with advancing age. Of the 77 elderly enrolled in the study, more than 90% were allocated to the first three IDWG quartiles. Yang et al.21 previously demonstrated
lower IDWG in patients aged over 65 years. Other studies have also found a negative correlation between age and IDWG.11,36
Young patients, more metabolically active, tend to have higher food and water intake, determining factors for the IDWG.10,37,38
These findings corroborate the fact that younger patients on HD are subject to greater IDWG because of their metabolic response. It would also signal that the elderly on HD, emerging population under this condition, need to be on stricter nutritional monitoring, because a lower IDWG may also be indicative of poor dietary intake, making this group more susceptible to malnutrition and all its consequences.
The lower IDWG found for females is due in part to the fact the IDWG be proportional to body weight,36 and there was a lower total
body mass for women compared to men in this study (results not shown).
Consistent with previous studies,11,39 we found
a positive association between BMI and IDWG. BMI is considered an important marker of nutritional status for patients on HD. Unlike the general population, studies involving HD patients suggest that overweight is associated with better clinical outcome,39-44 with BMI above 23 kg/
m² listed as lower risk for morbimortality.16,40,41
Evidence indicates, however, this condition is limited to those with normal or elevated LBM,45 a
condition seen among the patients in the bottom IDWG quartile in this study.
The largest number of patients with adequate BMI was represented by the last IDWG quartile. This group is also highlighted by presenting significantly higher LBM than the other, suggesting higher energy spending and consumption. Consequently, the higher proportion of metabolically active tissue could explain the higher IDWG so as to justify the higher NAR and serum creatinine levels.
Several studies8,35,39 point out positive
association between serum creatinine and IDWG, considering this marker also as an independent predictor of IDWG39 and suggesting
that patients with higher LBM and/or protein intake, a favorable prognostic condition for this population29,45,46 may have higher IDWG.
Although serum creatinine levels indicative of malnutrition in HD patients are not known, its prognostic capacity is evidenced in several studies,47-49 with survival directly proportional
to their serum level. Mortality increases when serum creatinine levels are below 10 mg/dL.31,47-49
creatinine, which may represent a greater advantage in terms of survival for patients with higher IDWG. This hypothesis, however, remains controversial, since some studies have reported longer survival,11,39 while a more recent study
involving over 34,000 patients reported that, after adjusted analysis, regardless of nutritional status, those with higher IDWG had higher rates of cardiovascular mortality and mortality by other causes.8 Indeed, these results reinforce
the importance of investigating strategies that mitigate or reduce the exposure time to water retention without jeopardizing the nutritional status of this population.
About 60-90% of hemodialysis patients had hypertension,20 a result similar to that found in
this study, and different from the one reported by Lopez-Gomez et al.11 IDWG was not associated
with hypertension. Testa & Plou10 found results
similar to those observed in this study. One cannot ignore that BP control mechanisms used for dialysis patients are multifactorial and complex.
In this study, there was no difference between serum albumin according to IDWG. Although serum albumin stands out as a strong clinical prognostic factor for the dialysis population,49,50
its use as a marker of nutritional status is questionable, since serum levels may reflect not only the protein consumption, but different clinical situations, such as inflammation51 and
superhydration.52 Thus, in this study it is likely
that serum albumin behaved much more like a clinical indicator, highlighting those patients with fewer serious comorbidities and less inflammatory activity than necessarily well-nourished patients.
Regarding NAR, although there is no consensus that more IDWG can confer benefits to the population in HD, the results observed in this study confirms the hypothesis that protein intake is one of the determinants of this variable. Although a causal association between protein intake and nutritional status of dialysis patients is not well defined,46 different studies indicate
that low intake of this nutrient is associated with
worse outcomes.6,46,53 Thus, clinically stable HD
patients need to reach a NAR of at least 1.0 g/kg of weight.22
The results obtained in this study suggest that the IDWG may reflect the balance between nutritional demand and maintenance of body reserves. Regardless of gender, age and clinical conditions, patients in this study with higher BMI, LBM and/or higher protein intake, as evidenced by serum creatinine levels, had higher IDWG.
Similar to this study, Hecking et al.36 also
found better performance of nutritional indicators (PCR/NAR and serum creatinine) among patients from countries which IDWGr frequency, they termed as excessive (> 5.7%), was higher. Certainly, a higher IDWG can serve as a positive marker of food intake, for the satisfaction of energy and protein demands may be associated with increased fluid intake, leading to a higher IDWG.9,10,12,36
In this context, IDWG interpretation according to suitability for nutritional indicators may be an alternative. To discriminate against a high IDWG resulting from high intake hydrosaline or related to successful dietary intake is mandatory for clinical monitoring of these patients. Both the registration or food recall can be instruments for evaluating such events because they enable the identification both of the habit as well as inadequate food intake, enabling relevant interventions.
HD patients should be continuously advised to limit the intake of salt and foods high in sodium, in order to enhance thirst control, favoring the lower fluid intake and IDWG, and not inadvertently directed to control food intake in order to limit water retention.
interest, so that the actual outcomes can guide strategies for clinical management and intervention.
C
ONCLUSIONNutritional status was positively associated with the IDWG of the population evaluated in this study. The results point to the need for individualized and careful evaluation of the IDWG in order to not generalize one IDWG recommendation that does not meet the expectations of ideal nutritional status maintenance and promotion for these patients.
R
EFERENCES1. Cooper BA, Penne EL, Bartlett LH, Pollock CA. Protein malnu-trition and hypoalbuminemia as predictors of vascular events and mortality in ESRD. Am J Kidney Dis 2004;43:61-6. DOI: http://dx.doi.org/10.1053/j.ajkd.2003.08.045
2. Dwyer JT, Larive B, Leung J, Rocco MV, Greene T, Burrowes J, et al.; HEMO Study Group. Are nutritional status indicators associated with mortality in the Hemodialysis (HEMO) Study? Kidney Int 2005;68:1766-76.
3. Stojanovic M, Stojanovic D, Stefanovic V. The impact of mal-nutrition on mortality in patients on maintenance hemodialysis in Serbia. Artif Organs 2008;32:398-405. PMID: 18471169 DOI: http://dx.doi.org/10.1111/j.1525-1594.2008.00558.x 4. Kalantar-Zadeh K, Kopple JD, Block G, Humphreys MH.
As-sociation among SF-36 quality of life measures and nutrition, hospitalization, and mortality in hemodialysis. J Am Soc Ne-phrol 2001;12:2797-806.
5. Laws RA, Topsell LC, Kelly J. Nutritional status and its rela-tionship to quality of life in a sample of chronic hemodialysis pa-tients. J Ren Nutr 2000;10:139-47. DOI: http://dx.doi.org/10.1053/ jren.2000.7412
6. Ohri-Vachaspati P, Seghal AR. Quality of life implications of inadequate protein nutrition among hemodialysis patients. J Ren Nutr 1999;9:9-13. DOI:http://dx.doi.org/10.1016/S1051--2276(99)90016-X
7. Dwyer JT, Larive B, Leung J, Rocco M, Burrowes JD, Chu-mlea WC, et al.; Hemodialysis Study Group. Nutritional status affects quality of life in Hemodialysis (HEMO) Stu-dy patients at baseline. J Ren Nutr 2002;12:213-23. DOI: http://dx.doi.org/10.1053/jren.2002.35297
8. Kalantar-Zadeh K, Regidor DL, Kovesdy CP, Van Wyck D, Bunna-pradist S, Horwich TB, et al. Fluid retention is associated with car-diovascular mortality in patients undergoing long-term hemodialy-sis. Circulation 2009;10;119:671-9. PMID: 19171851 DOI:http:// dx.doi.org/10.1161/CIRCULATIONAHA.108.807362
9. Sherman RA, Cody RP, Rogers ME, Solanchick JC. Interdialytic weight gain and nutritional parameters in chronic hemodialysis patients. Am J Kidney Dis 1995;25:579-83. PMID: 7702053 DOI: http://dx.doi.org/10.1016/0272-6386(95)90126-4
10. Testa A, Plou A. Clinical determinants of interdialytic weight gain. J Ren Nutr 2001;11:155-60. DOI: http://dx.doi.org/10.1053/ jren.2001.24362
11. López-Gómez JM, Villaverde M, Jofre R, Rodriguez-Benítez P, Pérez-García R. Interdialytic weight gain as a marker of blood pressure, nutrition, and survival in hemodialysis patients. Kid-ney Int Suppl 2005;93:S63-8. PMID: 15613071
12. Testa A, Beaud JM. The other side of the coin: interdialytic weight gain as an index of good nutrition. Am J Kidney Dis 1998;31:830-4. DOI:http://dx.doi.org/10.1016/S0272-6386(98)70052-6 13. Daugirdas, JT. Dialysis hypotension: a hemodynamic
analysis. Kidney Int 1991;39:233-46. DOI: http://dx.doi. org/10.1038/ki.1991.28
14. Rahman M, Dixit A, Donley V, Gupta S, Hanslik T, Lacson E, et al. Factors associated with inadequate blood pressure control in hypertensive hemodialysis patients. Am J Kidney Dis 1999:33:498-506. PMID: 10070914 DOI: http://dx.doi. org/10.1016/S0272-6386(99)70187-3
15. Bellizzi V, Di Iorio BR, Terracciano V, Minutolo R, Iodice C, De Nicola L, et al. Daily nutrient intake represents a mo-difiable determinant of nutritional status in chronic haemo-dialysis patients. Nephrol Dial Transplant 2003;18:1874-81. DOI: http://dx.doi.org/10.1093/ndt/gfg239
16. The Criteria Committee of the New York Heart Association. Functional capacity and objective assessment. In: Dolgin, M. ed. Nomenclature and criteria for diagnosis of diseases of the heart and great vessels. 9th ed. Boston: Little, Brown and Company; 1994. p.253-55.
17. Aparicio M, Cano N, Chauveau P, Azar R, Canaud B, Flory A, et al. Nutritional status of haemodialysis patients: a Fren-ch national cooperative study. FrenFren-ch Study Group for Nu-trition in Dialysis. Nephrol Dial Transplant 1999;14:1679-89. DOI: http://dx.doi.org/10.1093/ndt/14.7.1679
18. Locatelli F, Fouque D, Heimburger O, Drüeke TB, Canna-ta-Andía JB, Hörl WH, et al. Nutritional status in dialy-sis patients: a European consensus. Nephrol Dial Trans-plant 2002;17:563-72. DOI: http://dx.doi.org/10.1093/ ndt/17.4.563
19. Valenzuela RGV, Giffoni AG, Cuppari L, Canziani MEF. Esta-do nutricional de pacientes com insuficiência renal crônica em hemodiálise no Amazonas. Rev Assoc Med Bras 2003;49:72-8. DOI: http://dx.doi.org/10.1590/S0104-42302003000100037 20. K/DOQI Workgroup. K/DOQI clinical practice guidelines for
cardiovascular disease in dialysis patients. Am J Kidney Dis 2005;45:S1-53.
21. Yang SC, Chiang CK, Hsu SP, Hung KY. Relationship between interdialytic weight gain and nutritional markers in younger and older hemodialysis patients. J Ren Nutr 2008;18:210-22. DOI: http://dx.doi.org/10.1053/j.jrn.2007.11.012
22. Fouque D, Vennegoor M, ter Wee P, Wanner C, Basci A, Canaud B, et al. EBPG guideline on nutrition. Nephrol Dial Transplant 2007;22:ii45-87. DOI:http://dx.doi.org/10.1093/ ndt/gfm020
23. Hemodialysis Adequacy 2006 Work Group. Clinical practice guidelines for hemodialysis adequacy, update 2006. Am J Kid-ney Dis 2006;48:S2-90. PMID: 16813990
24. Habicht JP. Estandartización de métodos epidemiológi-cos quantitativos sobre el terreno. Bol Oficina Sanit Panam 1974;76:375-84.
25. World Health Organization (WHO). Obesity: preventing and managing the global epidemic. Report of the WHO Consulta-tion on Obesity. Geneva: World Health OrganizaConsulta-tion; 1997. 26. Lohman TG, Roche AF, Martorel R. Anthropometric
standardi-zation reference manual. Ilinois: Human Kinetics Books, 1988. 27. Durnin JV, Womersley J. Body fat assessed from total body
density and its estimation from skinfold tickness: measurements in 481 men and women aged from 16 to 72 years. Br J Nutr 1974;32:77-9. DOI: http://dx.doi.org/10.1079/BJN19740060 28. Siri WE. Body composition from fluid spaces and density
analy-sis of methods. In: Brozek J, Henschel A, eds. Techniques for measuring body composition. Washington: National Research Council; 1961. p.223-44.
29. Clinical practice guidelines for nutrition in chronic renal fai-lure. K/DOQI, National Kidney Foundation. Am J Kidney Dis 2000;35:S1-40.
30. Kopple JD. National kidney foundation K/DOQI clinical prac-tice guidelines for nutrition in chronic renal failure. Am J Kid-ney Dis 2001;37:S66-70. PMID: 11158865 DOI: http://dx.doi. org/10.1053/ajkd.2001.20748
32. Bossola M, Muscaritoli M, Tazza L, Panocchia N, Liberatori M, Giungi S, et al. Variables associated with reduced dietary intake in hemodialysis patients. J Ren Nutr 2005;15:244-52. DOI: http://dx.doi.org/10.1053/j.jrn.2005.01.004
33. Rocco MV, Paranandi L, Burrowes JD, Cockram DB, Dwyer JT, Kusek JW, et al. Nutritional status in the HEMO Study co-hort at baseline. Hemodialysis. Am J Kidney Dis 2002;39:245-56. DOI: http://dx.doi.org/10.1053/ajkd.2002.30543 34. Zimmerer JL, Leon JB, Covinsky KE, Desai U, Sehgal AR.
Diet monotony as a correlate of poor nutritional intake among hemodialysis patients. J Ren Nutr 2003;13:72-7. DOI: http://dx.doi.org/10.1053/jren.2003.50025
35. Hecking E, Bragg-Gresham JL, Rayner HC, Pisoni RL, An-dreucci VE, Combe C, et al. Haemodialysis prescription, adherence and nutritional indicators in five European coun-tries: results from the Dialysis Outcomes and Practice Patterns Study (DOPPS). Nephrol Dial Transplant 2004;19:100-7. DOI: http://dx.doi.org/10.1093/ndt/gfg418
36. Ifudu O, Uribarri J, Rajwani I, Vlacich V, Reydel K, Delos-reyes G, et al. Relation between interdialytic weight gain, body weight and nutrition in hemodialysis patients. Am J Neprol 2002;22:363-8. DOI: http://dx.doi.org/10.1159/000065228 37. Holmberg B, Stegmayr BG. Cardiovascular conditions in
he-modialysis patients may be worsened by extensive interdialytic weight gain. Hemodial Int 2009;13:27-31. DOI: http://dx.doi. org/10.1111/j.1542-4758.2009.00335.x
38. Bots CP, Brand HS, Veerman EC, Valentijn-Benz M, Van Amerongen BM, Valentijn RM, et al. Interdialytic weight gain in patients on hemodialysis is associated with dry mouth and thirst. Kidney Int 2004;66:1662-8. PMID: 15458464 DOI: http://dx.doi.org/10.1111/j.1523-1755.2004.00933.x 39. Sezer S, Ozdemir FN, Arat Z, Perim O, Turan M, Haberal
M. The association of interdialytic weight gain with nutritio-nal parameters and mortality risk in hemodialysis patients. Ren Fail 2002;24:37-48. DOI: http://dx.doi.org/10.1081/JDI-120002659
40. Kopple JD, Zhu X, Lew NL, Lowrie EG. Body weight-for-hei-ght relationships predict mortality in maintenance hemodialy-sis patients. Kidney Int 1999;56:1136-48. PMID: 10469384 DOI: http://dx.doi.org/10.1046/j.1523-1755.1999.00615.x 41. Abbott KC, Glanton CW, Trespalacios FC, Oliver DK, Ortiz
MI, Agodoa LY, et al. Body mass index, dialysis modality, and survival: analysis of the United States Renal Data System Dialysis Morbidity and Mortality Wave II Study. Kidney Int 2004;65:597-605. DOI: http://dx.doi.org/10.1111/j.1523-1755.2004.00385.x
42. Chazot C, Gassia JP, Di Benedetto A, Cesare S, Ponce P, Mar-celli D. Is there any survival advantage of obesity in Southern European haemodialysis patients? Nephrol Dial Transplant 2009;24:2871-6.
43. Kalantar-Zadeh K, Abbott KC, Salahudeen AK, Kilpamick RD, Horwich TB. Survival advantages of obesity in dialysis patients. Am J Clin Nutr 2005;81:543-54.
44. Herselman M, Esau N, Kruger JM, Labadarios D, Moosa MR. Relationship between body mass index and mortality in adults on maintenance hemodialysis: a systematic review. J Ren Nutr 2010;20:281-92. DOI: http://dx.doi.org/10.1053/j.jrn.2010.03.010 45. Beddhu S, Pappas LM, Ramkumar N, Samore M. Effects of
body size and body composition on survival in hemodialysis patients. J Am Soc Nephrol 2003;14:2366-72. DOI: http:// dx.doi.org/10.1097/01.ASN.0000083905.72794.E6
46. Beddhu S, Ramkumar N, Pappas LM. Normalization of pro-tein intake by body weight and the association of propro-tein intake with nutritional status and survival. J Ren Nutr 2005;15:387-97. DOI: http://dx.doi.org/10.1053/j.jrn.2005.07.001
47. Pifer TB, McCullough KP, Port FK, Goodkin DA, Maroni BJ, Held PJ, et al. Mortality risk in hemodialysis patients and chan-ges in nutritional indicators: DOPPS. Kidney Int 2002;62:2238-45. PMID: 12427151 DOI: http://dx.doi.org/10.1046/j.1523-1755.2002.00658.x
48. Lopes AA, Bragg-Gresham JL, Elder SJ, Ginsberg N, Goodkin DA, Pifer T, et al. Independent and joint associations of nutri-tional status indicators with mortality risk among chronic he-modialysis patients in the Dialysis Outcomes and Practice Pat-terns Study (DOPPS). J Ren Nutr 2010;20:224-34. DOI:http:// dx.doi.org/10.1053/j.jrn.2009.10.002
49. Mazairac AH, de Wit GA, Grooteman MP, Penne EL, van der Weerd NC, van den Dorpel MA, et al.; CONTRAST investiga-tors. A composite score of protein-energy nutritional status pre-dicts mortality in haemodialysis patients no better than its indi-vidual components. Nephrol Dial Transplant 2011;26:1962-7. DOI: http://dx.doi.org/10.1093/ndt/gfq643
50. Herselman M, Esau N, Kruger JM, Labadarios D, Moosa MR. Relationship between serum protein and mortality in adults on long-term hemodialysis: exhaustive review and meta-analysis. Nutrition 2010;26:10-32. DOI: http://dx.doi.org/10.1016/j. nut.2009.07.009
51. Kaysen GA, Stevenson FT, Depner TA. Determinants of al-bumin concentration in hemodialysis patients. Am J Kidney Dis 1997;29:658-68. PMID:9159298 DOI: http://dx.doi. org/10.1016/S0272-6386(97)90117-7
52. Jones CH, Akbani H, Croft DC, Worth DP. The relationship between serum albumin and hydration status in hemodialysis patients. J Renal Nutr 2002;12:209-12. DOI: http://dx.doi. org/10.1053/jren.2002.35295