Gene Expression Profile of Renal Cell Carcinoma Clear Cell
Type
Marcos F. Dall’Oglio, Rafael F. Coelho, Katia R. M. Leite, Juliana M. Sousa-Canavez, Paulo S. L. Oliveira, Miguel Srougi
Division of Urology (MFDO, RFC, MS) and Laboratory of Medical Investigation (KRML), University of Sao Paulo Medical School, Sao Paulo, Brazil, Genoa Biotechnology (JMSC), Sao Paulo, Brazil, Laboratory of Genetics and Molecular Cardiology (PSLO), Heart Institute, University of Sao Paulo, SP, Brazil
ABSTRACT
Purpose: The determination of prognosis in patients with renal cell carcinoma (RCC) is based, classically, on stage and histopathological aspects. The metastatic disease develops in one third of patients after surgery, even in localized tumors. There are few options for treating those patients, and even the new target designed drugs have shown low rates of suc-cess in controlling disease progression. Few studies used high throughput genomic analysis in renal cell carcinoma for determination of prognosis. This study is focused on the identification of gene expression signatures in tissues of low-risk, high-risk and metastatic RCC clear cell type (RCC-CCT).
Materials and Methods: We analyzed the expression of approximately 55,000 distinct transcripts using the Whole Ge-nome microarray platform hybridized with RNA extracted from 19 patients submitted to surgery to treat RCC-CCT with different clinical outcomes. They were divided into three groups (1) low risk, characterized by pT1, Fuhrman grade 1 or 2, no microvascular invasion RCC; (2) high risk, pT2-3, Fuhrman grade 3 or 4 with, necrosis and microvascular invasion present and (3) metastatic RCC-CCT. Normal renal tissue was used as control.
Results: After comparison of differentially expressed genes among low-risk, high-risk and metastatic groups, we identified a group of common genes characterizing metastatic disease. Among them Interleukin-8 and Heat shock protein 70 were over-expressed in metastasis and validated by real-time polymerase chain reaction.
Conclusion: These findings can be used as a starting point to generate molecular markers of RCC-CCT as well as a target for the development of innovative therapies.
Key words: carcinoma, renal cell; microarray analysis; neoplasm metastasis; oncogenes; Interleukin 8, heat-shock pro-tein; gene expression profiling
Int Braz J Urol. 2010; 36: 410-9
INTRODUCTION
Renal cell carcinoma (RCC) accounts for ap-proximately 5% of all malignancies and is considered the most lethal urological cancer (1,2). At early stages, it can be curable by surgical resection, but no effective
doi: 10.1590/S1677-55382010000400004
treatment option is available for patients at advanced stage. Up to 30% of the cases have metastasis at initial diagnosis and 30% of initially organ-confined cases will develop metastases during follow-up (3,4).
tar-get therapy has been developed based on molecular peculiarities of RCC. Transcriptional profiling has also emerged as a powerful approach to identify the molecular mechanism underlying renal carcinogen-esis and in predicting clinical outcomes (5). Gene expression profile may help to identify new bio-markers of aggressiveness and prognosis, selecting patients who could benefit from ancillary therapy. Microarray-based expression profiles have become a standard methodology in any high-throughput analysis.
There are few reported studies of gene ex-pression in RCC clear cell type (RCC-CCT) which have assessed prognosis. Most of these studies used different subtypes of RCC, which is inappropriate since they have different carcinogenesis pathways and clinical behavior (6-9).
This study is focused on the identification of gene expression signatures in tissues of low-risk, high-risk and metastatic RCC-CCT. It was carried out using the Whole Genome Microarray platform, which simultaneously evaluates the mRNA level of 55.000 transcripts ESTs (Expressed Sequences Tags). The resulting expression panel is a statistical representa-tion of physiological responses occurring in the finely tuned transcriptional regulation.
MATERIALS AND METHODS
Patients and Tumor Samples
Tissue samples of RCC-CCT obtained from the surgical specimens extracted from open nephrec-tomy of 19 patients were evaluated. The patients were divided in three groups: 1) Low risk RCC-CCT (Fuhrman nuclear grade 1 or 2, pT1 and no microvas-cular neoplastic invasion or tumor necrosis); 2) High risk RCC-CCT (Fuhrman nuclear grade 3 or 4 all staged pT3, all tumors had necrosis and microvascular neoplastic invasion), and 3) Metastatic RCC-CCT. Group 1 was composed of five men and two women submitted to tumor resection or partial nephrectomy; mean age 53.3 years-old (median 53, range 48-56), pT1, mean tumor size of 3.7 cm (median 3, range 1.8-6.5), Fuhrman grade 1 or 2, no microvascular invasion
or necrosis. Group 2 was constituted of four males and one female submitted to radical nephrectomy, mean age 60 years-old (median 65, range 39-73), T2-3 mean tumor size of 8.2 cm (median 9, range 3.9-11), Fuhrman grade 3 or 4 with necrosis and microvascu-lar invasion present. Group 3 was characterized by seven patients with metastatic RCC, (six males and one female) mean age 57.7 years-old (median 60, range 39-69) extracted from metastatic specimens of the primary tumor. The control group was a pool of normal cortical renal tissue from 4 patients with chronic kidney infections.
Surgical specimens were immediately sent to surgical pathology laboratory, and frozen at -170°C in liquid nitrogen maximum after 15 minutes. Insti-tutional Review Board approved the protocol and informed consent was obtained from all patients.
Microarray Experiment
Microarray Statistical Analysis
Statistical analysis of the CodeLink® micro-array slides was performed using the publicly avail-able R statistical environment (http://www.r-project. org). The normalization and background correction were performed using the LIMMA package (Linear Models for Microarray Analysis) (10); a part of the Bioconductor Microarray Suite (www.bioconductor. org).The background noise was corrected using the normEXP algorithm and the values were normalized by a cyclic LOESS smooth function with a hundred of interactions using the a adjusting parameter of 1.0.
The normalized data were organized lo-cally and using a Perl (http://www.perl.org) script we determined the minimum variation (fold change) threshold accepted as been significant. Datasets of each histological group were compared in a pairwise fashion. For each comparison performed, the fold change for a given spot was calculated. These values were distributed and the mean and standard devia-tion (SD) values of expression variadevia-tion of all genes were determined. A gene was accepted as differently expressed if its expression variation was greater than the mean plus one SD or lower than the mean minus one SD. Finally, only genes accepted as significant on all comparisons were selected. This group of candi-date genes were identified and organized locally. The gene lists were numerically sorted and the top UP and DOWN regulated genes were determined for each comparison. Functional classification of these genes was performed using Gene Ontology Consortium 2000.
Quantitative Real-Time PCR and Gene Expression
For qRT-PCR gene expression validation we evaluated 7 patients from group 1 (Low risk RCC-CCT), 5 patients from group 2 (High risk RCC-CCT) and 7 patients from group 3 (Metastatic RCC-CCT).
Total RNA extraction was performed using Trizol (Invitrogen Life Technologies, Carlsbad, CA) as mentioned previously. Pureness and concentra-tion of RNA were measured in a spectrophotometer
(260/280 nM), and integrity was verified in an Agilent 2100 bioanalyzer (Agilent Technologies, Santa Clara, CA, USA). Synthesis of cDNA was performed from at least 5μg of total RNA with the enzyme M-MLV reverse transcriptase and random primers (Invitrogen Life Technologies, Carlsbad, CA, USA). The reac-tions were incubated at 65°C for 5 min followed by 37°C for 1h and finally 95°C for 5 min. The cDNA reactions were diluted to 100 μL in nuclease-free water (Invitrogen Life Technologies, Carlsbad, CA, USA) and stored at -20°C until further use.
The expression of two genes was analyzed from cDNA through the qRT-PCR technology in the Abi7500 platform using the TaqMan® protocol (Ap-plied Biosystems). TaqMan® Endogenous Control Assay ID is Hs99999907-m1 (B2M) and Gene Ex-pression Assay IDs are Hs00359147-s1 (HSPA1A and HSPA1B) and Hs00174103-m1 Interleukin 8 (IL-8). cDNA (2μL) from each tumor sample was added to a PCR reaction mix containing 1X TaqMan® Uni-versal PCR Master Mix, AmpErase® UNG and 1 μL Endogenous Control Assay or Gene Expression Assay (Applied Biosystems) in a 20 μL reaction volume. The cycling conditions were 50ºC for 2 min, 95ºC for 10 min and 40 cycles of 95ºC for 15 sec and 60ºC for 1 min. The ΔΔCT method was used to calculate the relative expression of the two target genes and the fold change in gene expression in tumor relative to normal tissues determined by 2-ΔΔCT (11).
RESULTS
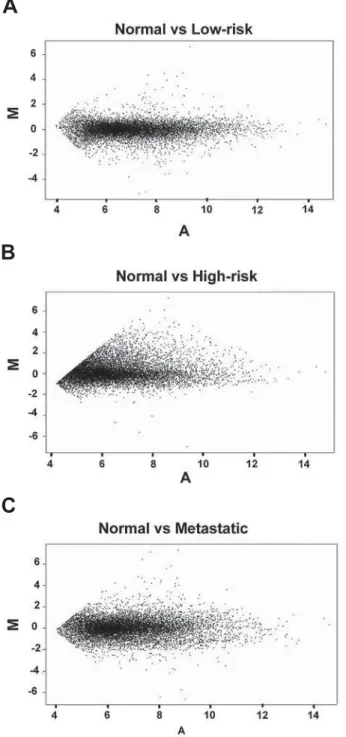
genes. This could reflect the expected disequilibrium in gene regulation of metastatic or prone to be tis-sues. The MA plots were used as quality control of
the microarray experiments, since it is expected that variations in global gene expression tend to be subtle and any variation of linearity can reflect physiologi-cal/pathological adaptations.
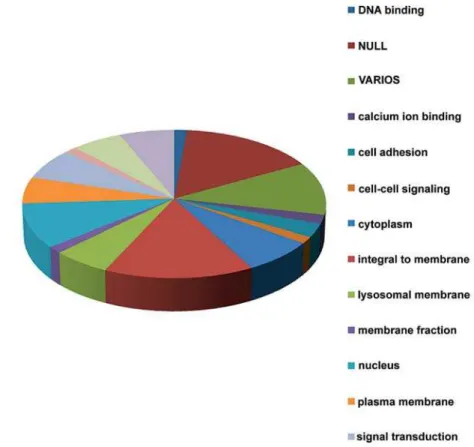
To identify the most important genes in the progression of RCC-CCT we selected the 50 most differentially expressed genes in each comparative group. After comparison among the differentially ex-pressed genes in the low-risk, high-risk and metastatic groups, we identified a group of common genes, which presented either increase or reduction in their expres-sion, from the low risk to the metastatic state. These genes are shown in Tables 1 and 2. When compared to the low-risk and high-risk groups, nine over-expressed and eleven under-expressed genes were found in the metastatic group. The differentially expressed genes in each comparison were functionally classified using the GO (Gene Ontology) database (Figure-2).
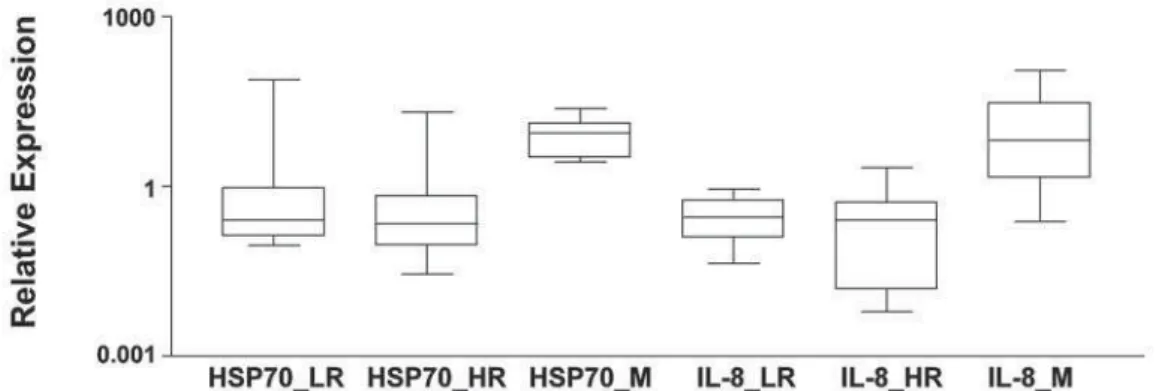
Two genes, IL-8 and HSP70, which had pre-sented greater expression differences, were chosen to be validated by qRT-PCR. The validation was performed in the three groups mentioned as low-risk (LR), high-risk (HR) and metastatic (M) renal cell carcinomas. As seen in Figure-3, over expression of HSP70 and IL-8 was present in 100% (13/13) and 77% (10/13) respec-tively of metastatic carcinoma cases tested. The graph shows quantitative expression of genes in RCC tissue relative to normal cells. Fold change in gene expres-sion was calculated using the ΔΔCT method (QRel = 2-ΔΔCT). Kruskal-Wallis test showed significant dif-ference between metastatic and the other two groups (p = 0.0002). This pattern was significantly different from high-risk and low-risk carcinomas.
COMMENTS
Description of thousands of genomic se-quences along with the technological development to identify the gene expression profile on a large scale has provided a remarkable improvement in the analysis of carcinogenesis process. This improved knowledge has had an impact on the latest advances regarding classification of neoplasias, identification of new diagnostic and prognostic markers, and find-ing of possible therapeutic targets. Until recently, the studies that evaluated genetic expression through the
Figure 1 – Representation of gene expression variation in dif-ferent ranges of intensity (MA-plot) between (A) normal vs. low-risk, (B) normal vs. high-low-risk, and (C) normal vs. metastatic genes.
A
B
microarray technique in RCC had focused particularly on the description of genes for diagnostic molecular classification (6). The purpose of our research was the identification of gene expression profiles related to known anatomopathological parameters that are cor-related to the prognosis (12). These genetic expression
profiles can help to describe a comprehensible pattern via RCC progression and metastatization. Among the genes identified in our study the most important ones are IL-8, and the heat shock protein (HSP-70) genes, which are closely linked to the known carcinogenesis way of the clear cell carcinoma.
Table 1 – Genes with lower expression from Low-risk to metastatic stage.
Abbreviation Official/GI*
Identification
CodeLink® Gene Identification
gi40578461 12878 EST- atypical PKC isotype-specific interacting protein long variant mRNA
C7 16412 complement component 7 (C7)
FCGBP 16152 Fc fragment of IgG binding protein
PRAP1 46920 proline-rich acidic protein 1
PCP4 19612 Purkinje cell protein 4 (PCP4)
gi52793583 24985 EST-QV4-BN0090-210400-182-h09 BN0090 Homo sapiens cDNA
gi3870266 38798 EST-qz33c05x1 NCI_CGAP_Kid11 cDNA clone IMAGE:2028680 3’ similar to gb:X02747 FRUCTOSE-BISPHOSPHATE ALDOLASE B
WFDCD2 20765 WAP four-disulfide core domain 2 transcript variant 1
gi1401452 23196 EST-zh66h10s1 Soares_fetal_liver_spleen_1NFLS_S1 cDNA clone IM-AGE:417091 3’
*GI = genomic identification according to National Institutes of Health data bank. (http://www.ncbi.nlm.nih.gov)
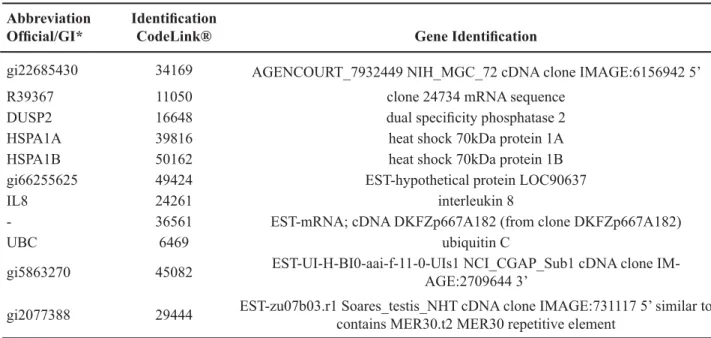
Table 2 – Genes with higher expression from low-risk to metastatic stage.
Abbreviation Official/GI*
Identification
CodeLink® Gene Identification
gi22685430 34169 AGENCOURT_7932449 NIH_MGC_72 cDNA clone IMAGE:6156942 5’
R39367 11050 clone 24734 mRNA sequence
DUSP2 16648 dual specificity phosphatase 2
HSPA1A 39816 heat shock 70kDa protein 1A
HSPA1B 50162 heat shock 70kDa protein 1B
gi66255625 49424 EST-hypothetical protein LOC90637
IL8 24261 interleukin 8
- 36561 EST-mRNA; cDNA DKFZp667A182 (from clone DKFZp667A182)
UBC 6469 ubiquitin C
gi5863270 45082 EST-UI-H-BI0-aai-f-11-0-UIs1 NCI_CGAP_Sub1 cDNA clone IM-AGE:2709644 3’
gi2077388 29444 EST-zu07b03.r1 Soares_testis_NHT cDNA clone IMAGE:731117 5’ similar to contains MER30.t2 MER30 repetitive element
The gene profiles of the high-risk and meta-static disease are quite similar, and this was described by Jones et al. (7) These authors, studying clear cell type RCC, identified a similar profile of genetic ex-pression among both locally advanced and metastatic tumors, which was named metastatic signature. Kosari et al. (9) in a study quite similar to ours, also identified genes expressed in both aggressive and metastatic carcinomas.
In recent years, the analysis of the gene expression profile on a large scale has been widely used to define genetic expression patterns that can be related to neoplasia aggressiveness (13). Current studies on RCC have sought the identification of new prognostic markers. By studying 16 RCCs in a platform comprising 21,632 genes, (6) a correlation between the histological and genetic classifications in 14 renal tumors. Jones et al. was identified. (7), study-ing 65 RCC (23 CCC, 13 papillary, 7 chromophobes, 12 oncocytomas) and 24 normal renal tissues defined
a genetic profile associated with the development of metastasis, based on a platform of 22,283 genes (Affymetrix). Liou et al. (8) studied six RCCs and compared the differentiated genic expression with six normal renal tissues. By using a platform of 7,129 genes (Affymetrics), they were able to demonstrate that 25% of genes are differentially expressed and among them, an over expression of adhesion mol-ecules (laminin A and fibronectin) which would act in the progression of the neoplasia.
The membrane receptors, like the epidermal growth factor receptor (EGFR), were poorly ex-pressed in the initial RCC, as pT1a tumors; however, its overexpression was correlated with an increase in the tumor stage. These transmembrane glycoproteins interact with tyrosine kinase and promote invasion, metastasis and expression of biomarkers (14). Many target drugs have been studied in the attempt to inhibit cellular events acting directly on these receptors. Pres-ently, tyrosine kinase inhibitory drugs have shown
promising results in cases of metastatic RCC, thus pointing to more reasonable expectations of disease control than isolated immunotherapy (15).
The VHL gene is responsible for the codi-fication of a protein, which is part of the elongin B and C complex, whose function is the degradation of the hypoxia-induced factor (HIF-1). This factor is an upregulator of the tyrosine kinase VEGFR receptor, that is overexpressed in RCCs. VEGFR regulates the hypervascular characteristic of RCC (16,17), which has already been the target for the development of inhibitory molecules and antibodies for therapeutic use. Both familiar and sporadic RCCs are related to mutation and/or loss of VHL gene, resulting in non-formation of the elongin B and C complex and HIF-1 accumulation. HIF-1 induces translation of genes related to angiogenesis, favoring the carcinogenesis. The VHL suppressor gene mutations are responsible for the VHL syndrome. The mutated gene is found in 75% of sporadic RCC cases (18). It is believed that the tumor necrosis factor alpha (TNF-α) contributes to the VHL gene suppressive function (19); in our study, this gene was overexpressed in the low-risk cases in relation to the normal ones, validating Caldwell’s theory.
Clear renal cell carcinoma occurs in approxi-mately 80% of RCC cases, and a great deal of research shows different gene groups - either underexpressed or overexpressed - without significant intersections among the various studies. These discrepancies prob-ably occur due to different criteria in the selection of the altered genes and the use of different microarray
platforms with distinct anchored markers. Another aspect of criticism in any microarray analysis is the improper collection of neoplastic tissue and loss of cellular lineage in tumors, which are mostly hetero-geneous (14).
Using qRT-PCR we were able to validate the overexpression of IL-8 and HSP-70 in metastatic RCC-CCT. HSP is expressed by cells under pathologi-cal and physiologipathologi-cal conditions; its most important functions include homeostasis, apoptosis, and also a relevant role in antigenicity mediated by T cells (20). HSP27 and 72 overexpression are clinically relevant (21), particularly HSP27 overexpression in CCR when compared to normal renal cells (22). Conversely, in our study HSP70 1A and 1B were overexpressed in metastatic cases in relation to low-risk and high-risk cases. The HSP 70 is considered one of the most powerful stimulants to human immune response and the structure and function of these proteins and their relation with immunity have been extensively investigated (23). HSP is an integral component of HIF and this interaction induces HSP overexpres-sion. Drug-oriented actions inhibiting the HIF-HSP complex might exert an inhibitory potential over this important carcinogenesis mechanism; it is necessary, however, to distinguish the effects of the HSP family members (23).
IL-8 is over expressed by tumors and has been related to angiogenesis, mitotic activity and metastatization (24). Yoshida et al. (25) showed IL-8 expression in breast, ovary, pancreas and prostate car-cinoma related to higher stage and tumor progression.
It regulates metalloproteinases 2 and 9 promoting stromal infiltration and angiogenesis facilitating the metastatic progression.
Based on carefully analyzed molecular events in RCC, the benefits of individualized therapies will become prominent in the near future. However, con-sidering that genetic alterations in cancer progression are complex and frequently imply multiple paths, the combination of new target-drugs for particular genes involved in each RCC histological subtype will be necessary.
CONCLUSIONS
Distinct gene expression profiles of low-risk, high-risk and metastatic RCCs were demonstrated, with emphasis on the progressive higher expression of the HSP 70 and IL-8 genes from Low-risk to metastatic stage. Based on our findings, it is possible to suggest these genes as starting points for prognostic molecular markers and/or targets for specific therapies.
CONFLICT OF INTEREST
None declared.
REFERENCES
1. Parkin DM, Bray F, Ferlay J, Pisani P: Global cancer statistics, 2002. CA Cancer J Clin. 2005; 55: 74-108. 2. Jemal A, Siegel R, Ward E, Hao Y, Xu J, Thun MJ:
Cancer statistics, 2009. CA Cancer J Clin. 2009; 59: 225-49.
3. Uchida K, Miyao N, Masumori N, Takahashi A, Oda T, Yanase M, et al.: Recurrence of renal cell carcinoma more than 5 years after nephrectomy. Int J Urol. 2002; 9: 19-23.
4. Levy DA, Slaton JW, Swanson DA, Dinney CP: Stage specific guidelines for surveillance after radical nephrectomy for local renal cell carcinoma. J Urol. 1998; 159: 1163-7.
5. van de Vijver MJ, He YD, van’t Veer LJ, Dai H, Hart AA, Voskuil DW, et al.: A gene-expression signature as a predictor of survival in breast cancer. N Engl J Med. 2002; 347: 1999-2009.
6. Yang XJ, Sugimura J, Schafernak KT, Tretiakova MS, Han M, Vogelzang NJ, et al.: Classification of renal neoplasms based on molecular signatures. J Urol. 2006; 175: 2302-6.
7. Jones J, Otu H, Spentzos D, Kolia S, Inan M, Beecken WD, et al.: Gene signatures of progression and metas-tasis in renal cell cancer. Clin Cancer Res. 2005; 11: 5730-9.
8. Liou LS, Shi T, Duan ZH, Sadhukhan P, Der SD, Novick AA, et al.: Microarray gene expression profil-ing and analysis in renal cell carcinoma. BMC Urol. 2004; 4: 9.
9. Kosari F, Parker AS, Kube DM, Lohse CM, Leibovich BC, Blute ML, et al.: Clear cell renal cell carcinoma: gene expression analyses identify a potential signature for tumor aggressiveness. Clin Cancer Res. 2005; 11: 5128-39.
10. Smyth GK: Limma: linear models for microarray data. In: Gentleman R, Carey V, Dudoit S, Irizarry R, Huber W, (ed.), Bioinformatics and computational biology solutions using R and bioconductor. New York, Springer. 2005; pp. 397-420.
11. Livak KJ, Schmittgen TD: Analysis of relative gene expression data using real-time quantitative PCR and the 2(-Delta Delta C(T)) Method. Methods. 2001; 25: 402-8.
12. Dall’Oglio MF, Arap MA, Antunes AA, Cury J, Leite KR, Srougi M: Impact of clinicopathological param-eters in patients treated for renal cell carcinoma. J Urol. 2007; 177: 1687-91.
13. Yin-Goen Q, Dale J, Yang WL, Phan J, Moffitt R, Petros JA, et al.: Advances in molecular classification of renal neoplasms. Histol Histopathol. 2006; 21: 325-39. 14. Langner C, Ratschek M, Rehak P, Tsybrovskyy O,
Zigeuner R: The pT1a and pT1b category subdivision in renal cell carcinoma: is it reflected by differences in tumour biology? BJU Int. 2005; 95: 310-4. 15. Motzer RJ, Hutson TE, Tomczak P, Michaelson MD,
Bukowski RM, Rixe O, et al.: Sunitinib versus inter-feron alfa in metastatic renal-cell carcinoma. N Engl J Med. 2007; 356: 115-24.
16. Hirota E, Yan L, Tsunoda T, Ashida S, Fujime M, Shuin T, et al.: Genome-wide gene expression profiles of clear cell renal cell carcinoma: identification of mo-lecular targets for treatment of renal cell carcinoma. Int J Oncol. 2006; 29: 799-827.
17. Staehler M, Rohrmann K, Haseke N, Stief CG, Siebels M: Targeted agents for the treatment of advanced renal cell carcinoma. Curr Drug Targets. 2005; 6: 835-46. 18. Foster K, Prowse A, van den Berg A, Fleming S,
of the von Hippel-Lindau disease tumour suppressor gene in non-familial clear cell renal carcinoma. Hum Mol Genet. 1994; 3: 2169-73.
19. Caldwell MC, Hough C, Fürer S, Linehan WM, Morin PJ, Gorospe M: Serial analysis of gene expression in renal carcinoma cells reveals VHL-dependent sensi-tivity to TNFalpha cytotoxicity. Oncogene. 2002; 21: 929-36.
20. Seliger B, Lichtenfels R, Kellner R: Detection of renal cell carcinoma-associated markers via proteome- and other ‘ome’-based analyses. Brief Funct Genomic Proteomic. 2003; 2: 194-212.
21. Santarosa M, Favaro D, Quaia M, Galligioni E: Expres-sion of heat shock protein 72 in renal cell carcinoma: possible role and prognostic implications in cancer patients. Eur J Cancer. 1997; 33: 873-7.
22. Lichtenfels R, Kellner R, Bukur J, Beck J, Brenner W, Ackermann A, et al.: Heat shock protein expression and anti-heat shock protein reactivity in renal cell carcinoma. Proteomics. 2002; 2: 561-70.
23. Javid B, MacAry PA, Lehner PJ: Structure and func-tion: heat shock proteins and adaptive immunity. J Immunol. 2007; 179: 2035-40.
24. Koch AE, Polverini PJ, Kunkel SL, Harlow LA, DiPietro LA, Elner VM, et al.: Interleukin-8 as a mac-rophage-derived mediator of angiogenesis. Science. 1992; 258: 1798-801.
25. Yoshida T, Matsumoto E, Hanamura N, Kalembeyi I, Katsuta K, Ishihara A, et al.: Co-expression of tenascin and fibronectin in epithelial and stromal cells of benign lesions and ductal carcinomas in the human breast. J Pathol. 1997; 182: 421-8.
Accepted after revision: January 6, 2010
Correspondence address: Dr. Marcos F. Dall’Oglio
Rua Barata Ribeiro, 398 - 5º Andar São Paulo, SP, 01308-000, Brazil Fax: + 55 11 3159-3618
E-mail: [email protected]
EDITORIAL COMMENT
In this nicely written paper by Dall’Oglio et al., the gene expression profile of clear cell type re-nal cell carcinoma (RCC) was conducted to identify the functional genes selectively expressed in low-, high-, and metastatic RCC patients. Although sev-eral groups have conducted tissue microarray stud-ies focusing on RCC (1-4), the present study has several merits; firstly, the authors have evaluated the gene expression profiles of a uniform patient cohort (i.e. those with clear cell histology) remov-ing study population heterogeneity as a confoundremov-ing variable, secondly, the authors have stratified their study population according to risk of progression whereby allowing to better define the gene expres-sion profiles of these prognostic subsets. It is clear
metastatic RCC will undergo a pre-treatment percu-taneous renal biopsy enabling us to not only identify the histologic tumor type but rather develop a tissue microarray identifying the specific genetic altera-tions in an individual patient’s tumor which can then be targeted using a selective treatment combination and enabling a more personalized and highly effec-tive therapeutic approach to be initiated.
REFERENCES
1. Dahinden C, Ingold B, Wild P, Boysen G, Luu VD, Montani M, et al.: Mining tissue microarray data to uncover combinations of biomarker expression
pat-terns that improve intermediate staging and grading of clear cell renal cell cancer. Clin Cancer Res. 2010; 16: 88-98.
2. Rogers CG, Ditlev JA, Tan MH, Sugimura J, Qian CN, Cooper J, et al.: Microarray gene expression profiling using core biopsies of renal neoplasia. Am J Transl Res. 2009; 1: 55-61.
3. Huang Y, Dai Y, Yang J, Chen T, Yin Y, Tang M, et al.: Microarray analysis of microRNA expression in renal clear cell carcinoma. Eur J Surg Oncol. 2009; 35: 1119-23.
4. Lane BR, Li J, Zhou M, Babineau D, Faber P, Novick AC, et al.: Differential expression in clear cell renal cell carcinoma identified by gene expression profil-ing. J Urol. 2009; 181: 849-60.
Dr. Philippe E. Spiess