*Correspondence: R. A. Fock. Laboratório de Hematologia Experimental. Departamento de Análises Clínicas e Toxicológicas. Faculdade de Ciências Farmacêuticas – USP. Avenida Lineu Prestes, 580 Bloco 17 - 05508-900 - São Paulo - SP, Brazil. E-mail: [email protected]
A
vol. 52, n. 3, jul./sep., 2016 http://dx.doi.org/10.1590/S1984-82502016000300003
The influence of protein malnutrition on the production of GM-CSF
and M-CSF by macrophages
Dalila Cunha de Oliveira, Araceli Aparecida Hastreiter, Primavera Borelli,
Ricardo Ambrósio Fock
*Department of Clinical and Toxicological Analyses, School of Pharmaceutical Sciences, University of Sao Paulo, São Paulo, SP, Brazil
It is well established that protein malnutrition (PM) impairs immune defenses and increases susceptibility to infection. Macrophages are cells that play a central role in innate immunity, constituting one of the
irst barriers against infections. Macrophages produce several soluble factors, including cytokines
and growth factors, important to the immune response. Among those growth factors, granulocyte-macrophage colony-stimulating factor (GM-CSF) and granulocyte-macrophage colony-stimulating factor (M-CSF). GM-CSF and M-CSF are important to monocyte and macrophage development and stimulation of the immune response process. Knowing the importance of GM-CSF and M-CSF, we sought to investigate
the inluence of PM on macrophage production of these growth factors. Two-month-old male BALB/c
mice were subjected to PM with a low-protein diet (2%) and compared to a control diet (12%) mouse group. Nutritional status, hemogram and the number of peritoneal cells were evaluated. Additionally, peritoneal macrophages were cultured and the production of GM-CSF and M-CSF and mRNA expression were evaluated. To determine if PM altered macrophage production of GM-CSF and M-CSF, they were
stimulated with TNF-α. The PM animals had anemia, leukopenia and a reduced number of peritoneal cells. The production of M-CSF was not diferent between groups; however, cells from PM animals, stimulated with or without TNF-α, presented reduced capability to produce GM-CSF. These data imply that PM interferes with the production of GM-CSF, and consequently would afect the production and
maturation of hematopoietic cells and the immune response.
Uniterms: Protein malnutrition. Granulocyte-Macrophage Colony-Stimulating Factor (GM-CSF). Macrophage Colony-Stimulating Factor (M-CSF).
INTRODUCTION
Protein malnutrition (PM) is the most widespread nutritional disorder in developing countries and it is associated with high rates of morbidity and mortality. PM decreases immune defenses, increasing susceptibility to infection. Though all forms of immune response can be
afected by PM, non-speciic defense and cell-mediated immunity are the most severely afected (Keusch, 2003; Calder, 2013).
The term “cell-mediated immunity” refers to the
recognition and/or killing of pathogens by phagocytes,
cytotoxic T-lymphocytes and cytokines. Monocytes and macrophages are critical effectors of cell-mediated immunity and regulate cells of the innate and adaptive
immune systems. Monocytes and macrophages also produce important hematopoietic growth factors and
immune modulators with profound efects on the functional
activities of leukocytes. Among the soluble mediators, granulocyte-macrophage colony-stimulating factor (GM-CSF) and macrophage colony-stimulating factor (M-(GM-CSF) play important biological roles in the immune response as well as in the process of blood cell formation and maturation
(Metcalf, 2007; Hamilton, Achuthan, 2013; Meshkibaf et al., 2014; Morrison, Scadden, 2014).
GM-CSF and M-CSF mediate cell survival, proliferation and differentiation and also modulate chemotaxis, degranulation, activation, adhesion, cytotoxicity and mRNA phenotype changes of various
blood cell populations (Barreda, 2004; Hamilton, Achuthan, 2013). M-CSF is easily detectable in the
steady state, but GM-CSF requires an inflammatory
Although many different myeloid populations respond to GM-CSF and M-CSF, cells of the monocyte and macrophage lineages are the main target for both of these factors (Hamilton, 2008). GM-CSF is able to
stimulate proliferation and diferentiation of primitive and
early macrophage progenitors while M-CSF is essential to
the survival, proliferation, diferentiation and maturation
of the macrophage myeloid lineage (Rutherford, Schook
1992; Hamilton, 2008).
In this vein, our group has previously shown that PM reduces the proliferation rate of hematopoietic progenitor cells and alters the bone marrow extracellular matrix, and therefore reduces circulating blood cell production. This leads to peripheral leukopenia commonly found in the PM condition (Xavier et al., 2007; Borelli et al., 2009).
GM-CSF and M-CSF produced by macrophages are important soluble factors that stimulate blood cell maturation and immune cell production. PM can impair the generation and maturation of blood cells and the immune system. Therefore, we sought to investigate the
inluence of PM on GM-CSF and M-CSF production by
macrophages, since they act as important soluble factors for both processes.
MATERIAL AND METHODS
Diets
Murine diets were prepared in our laboratory. Mineral and vitamin mixtures were prepared according to the recommendations of the American Institute of Nutrition for adult mice (Reeves et al., 1993). Casein (> 85% protein) was used as the protein source. The
two diets prepared contained 100 g/kg sucrose, 80 g/kg corn oil, 10 g/kg fiber, 2.5 g/kg choline bitartrate, 1.5 g/kg L-methionine, 40 g/kg mineral mixture and 10 g/kg vitamin mixture. The control diet contained 120 g/kg casein and 636 g/kg cornstarch, whereas the PM diet contained 20 g/kg casein and 736 g/kg cornstarch.
Except for the protein content, the two diets were identical
and isocaloric; the total amount of casein removed from
the formulation of the hypoproteic diet was substituted for the same mass of cornstarch. Both diets provided
1716.3 kJ/100 g. The inal protein content was conirmed using the standard micro-Kjeldahl method (Ward, 1963).
Animals
Two-month-old male outbred BALB/c mice were
obtained from the animal laboratory at the School of Pharmaceutical Sciences at the University of São Paulo.
The mice were individually placed in cages and received the control diet for 7 days until their body weight stabilized. After this period of adaptation, the animals were divided into two groups and maintained under a regular
12 h light/dark cycle at a temperature of 22–25 °C and a
relative humidity of 55 ± 10%. These mice received either
the control (n = 12) or the low-protein (n = 12) diet and water ad libitum. Body weight and food consumption were monitored every 48 h. The mice were subjected to PM experimental assays after 28 days of eating their respective diets, when the PM group had lost approximately 20% of their original body weight. This study was approved by the Ethics Committee of the School of Pharmaceutical
Sciences at the University of São Paulo (Protocol CEUA/ FCF/316).
Nutritional evaluation
A nutritional evaluation was performed by measuring body weight, diet, protein consumption and plasma concentrations of protein and albumin. Body weight variation was calculated using the initial (after the
adaptation period) and inal (on the day of euthanasia)
weights of the animals in both groups. For protein and albumin analyses, the animals were anaesthetized with
xylazine chlorohydrate (10 mg/kg; Rompun®, Bayer
Animal Health, Brazil) and with ketamine chlorohydrate
(100 mg/kg; Ketamina
, Cristália, Brazil), and
whole-blood samples containing EDTA (1 mg/mL)
(Sigma-Aldrich®, St. Louis, MO, USA) were collected. Plasma
was separated by centrifugation (1000 × g for 10 min at
4 °C) and total protein content and albumin levels were
determined by standard methods (Gornall et al., 1949; Dumas et al., 1997).
Hemogram and peritoneal cell count
Blood samples containing EDTA (1 mg/mL)
(Sigma-Aldrich®) as an anticoagulant were used to perform a
hemogram. The evaluation was performed on ABX Micros
ABC Vet equipment (Horiba, Japan). Morphological and
leukocyte differentiation analyses were conducted on blood smears stained using the standard May–Grünwald– Giemsa (Sigma-Aldrich®) technique.
After being anaesthetized, the animals were euthanized and the peritoneal cavities were washed with 5 mL of sterile RPMI medium (VitroCell®, Campinas,
SP, Brazil) and supplemented with fetal bovine serum
(10% v/v, VitroCell®), penicillin and streptomycin
re-suspended in 1 mL of sterile RPMI medium. Cell viability was determined by Trypan blue exclusion. Macrophages were obtained by incubating 1 × 10⁶ cells
per well in 24-well polystyrene culture plates for 1 h. Non-adherent cells were removed by three vigorous washes with RPMI medium. The entire procedure was executed under aseptic conditions and all of the materials used had been previously sterilized and were pyrogen free. Total cell counts were determined using a Neubauer chamber and the different types of cells
were quantiied in cytocentrifuge smears stained with
standard May–Grünwald–Giemsa solution (Sigma-Aldrich®).
Flow cytometric analysis using a FACSCalibur low cytometer (Becton & Dickinson, San Jose, CA, USA) was used to determine the fraction of peritoneal F4/80+ cells
labeled with the F4/80 FITC antibody. Peritoneal exudate cells consisted of more than 80% F4/80+ macrophages
whereas more than 90% of the cells adhering to the wells
were F4/80+ macrophages (data not shown).
Macrophage cell cultures
Peritoneal macrophage cultures were plated in 24-well polystyrene culture plates (Falcon, Lincoln
Park, NJ, USA) at a inal concentration of 1 × 10⁶ cells/
mL and cultured (at 37 °C in a humidiied atmosphere with 5% CO2) for 2 h in the presence or absence of
TNF-α (10 ng/mL) stimulation. The incubation time and TNF-α concentration had been previously standardized.
After this period, the supernatants were collected for
quantiication of the levels of GM-CSF (cat #DY415) and M-CSF (cat #DY417) by ELISA. The tests were
performed using the commercially available reagent Quantikine® M Mouse (R&D Systems, Inc., Minneapolis,
MN, USA), following the procedures recommended by the manufacturer.
Macrophages and quantitative PCR (qPCR) for CSF1 and CSF2
Peritoneal macrophages from the control and PM groups were isolated as described above. Total RNA was obtained using an RNeasy Mini Kit (Qiagen, Germantown, MD, USA) according to the manufacturer’s protocol. The total RNA was reverse transcribed into cDNA using a High-Capacity cDNA Reverse Transcription Kit (Applied Biosystems, Foster City, CA, USA). The cDNA samples were then amplified using TaqMan Universal Master Mix with an optimized concentration of the primer set for GM-CSF (CSF2,
Mm01290062_m1, Applied Biosystems, Foster City, CA, USA) and M-CSF (CSF1, Mm00432686_m1, Applied
Biosystems, Foster City, CA, USA). The internal control
used was ACTB (Mm00607939_s1, Applied Biosystems,
Foster City, CA, USA). The expression of CSF 1 and CSF2 was evaluated by qPCR using StepOnePlus™ (Applied Biosystems, Foster City, CA, USA). The amplification conditions were as follows: an initial 5 min at 95 °C, followed by 40 cycles of denaturation at 95 °C for 10 s and annealing and extension at 60 °C for
30 s. The relative quantiication of GM-CSF and M-CSF
was conducted according to the ΔΔCt method (Livak, Schmittgen, 2001).
Statistical analysis
All statistical analyses were performed with GraphPad Prism software (version 5.03 for Windows;
GraphPad Software, San Diego, CA, USA) and the data are expressed as mean values with their standard deviations. The dependent variables were normally distributed. The results were analyzed by analysis of variance (ANOVA), followed by Bonferroni’s multiple comparison test when three or more groups were compared and by parametric Student’s t-test when two groups
were compared. Statistically signiicant diferences were
considered at p ≤ 0.05.
RESULTS
Body weight variation, diet and protein
consumption, total plasma protein and albumin concentrations and hemogram
The amount of food and calories consumed by the PM and control groups were similar. However, the PM experimental diet with lower protein content resulted in
signiicantly reduced protein ingestion in the PM group as
expected. Animals from control and PM groups had body weight around 21 g at the beginning of the experimental protocol. After 28 days of the experimental protocol the body weight mean of control animals was around 25 g and of PM animals was around 17 g. Mice fed with the
hypoproteic diet exhibited signiicant body weight loss,
amounting to approximately 20% of their initial weight, and a significant decrease in total plasma protein and albumin concentrations was observed (Table I).
of polymorphonuclear granulocytes, lymphocytes and monocytes (Table II).
Cellularity of the peritoneal exudate
PM animals displayed a signiicant reduction in the
number of peritoneal cavity cells and mononuclear cells in comparison with the control group (Table II).
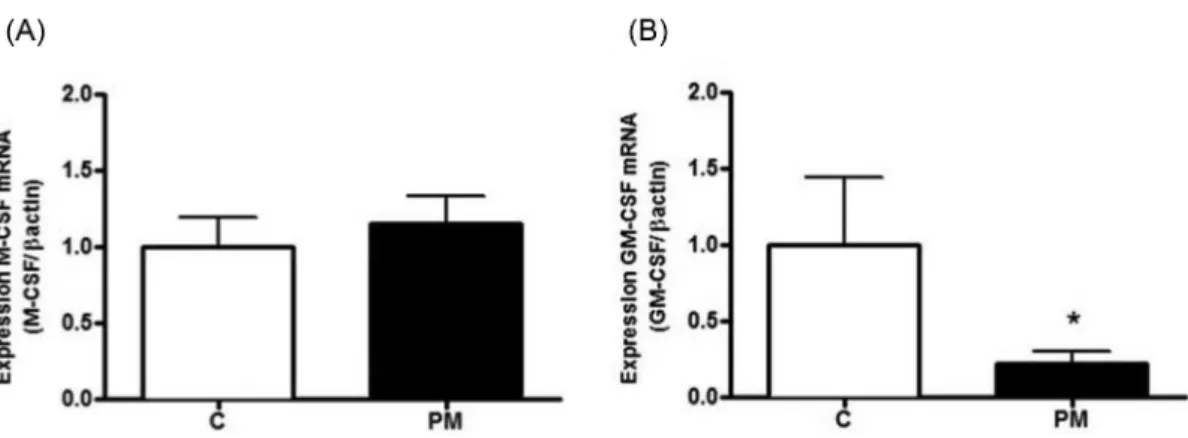
M-CSF (CSF1) and GM-CSF (CSF2) qPCR
qPCR was performed to determine expression of
M-CSF (CSF1) and GM-CSF (CSF2) in the peritoneal cells ex vivo. There was no diference between M-CSF mRNA expression in the control and PM groups (Figure 1A). However, the expression of GM-CSF mRNA was reduced in the PM group when compared with the control group (Figure 1B).
Determination of M-CSF and GM-CSF production in vitro by peritoneal cells
ELISA was used to determine cytokine levels in the supernatants of peritoneal cells cultured with or without TABLE I - The body weight variation, diet and protein consumption, concentrations of plasmatic protein and albumin, and hemogram in control (C) and protein malnourished (PM) animals
Variables C
(n=12)
PM (n=12)
Body weight variation (%) +20.49±1.65 -18.59±1.15***
Diet consumption (g/day/animal) 5.16±0.20 4.98±0.14
Protein consumption (g/day/animal) 0.62±0.02 0.09±0.01***
Plasma protein (g/dL) 6.53±0.30 5.24±0.23**
Albumin (g/dL) 2.82±0.14 1.88±0.16***
Erythrocytes (x106/mm³) 9.30±0.31 7.46±0.31**
Hematocrit (%) 41.6±0.95 35.8±1.12**
Hemoglobin (g/dL) 13.2±0.52 11.0±0.42**
Peripheral leukocytes (/mm³) 2833±273.1 1283 ± 107.9***
Peripheral neutrophils (/mm3) 563.8±67.2 160.6± 16.7***
Peripheral eosinophils (/mm3) 13.42±7.26 2.33±1.64
Peripheral lymphocytes (/mm3) 2153±216.8 1089±99.5***
Peripheral monocytes (/mm3) 106.2±17.78 31.9±5.09**
Results are expressed as the mean with standard deviation of body weight variation; diet and protein consumption; concentrations of plasma protein and albumin; hemoglobin levels; total number of erythrocytes and peripheral leukocytes; and the diferent leukocyte subsets in the blood of control (C) and protein-malnourished (PM) animals. Numbers in parentheses denote the number of animals used in the experiments. ** p ≤ 0.01 and *** p ≤ 0.0001 where there was a signiicant diference between the PM and C groups.
TABLE II - Total cell numbers and diferent types of cells in peritoneal exudates from control (C) and protein malnourished (PM)
animals
Variables (x106/mL) C
(n=12)
PM (n=12)
Peritoneal total cells 2.42±0.14 1.86±0.16*
Peritoneal mononuclear cells 2.31±0.13 1.77±0.15*
Peritoneal granulocytes 0.08±0.02 0.06±0.01
Peritoneal mastocytes 0.026±0.006 0.026±0.01
10 ng/mL TNF-α for 2 h. There was no diference in the
levels of M-CSF produced by peritoneal cells with or
without stimulation by TNF-α (Figure 2A).
The results showed that the level of GM-CSF was
diminished in the PM group without TNF-α stimulation
when compared with the control group level (Figure 2B).
TNF-α stimulation for 2 h increased GM-CSF production
in the control group but not the PM group (Figure 2B).
DISCUSSION
In this study, we evaluated the capacity of macrophages to produce GM-CSF and M-CSF in a PM model. Additionally, we evaluated GM-CSF and M-CSF
production by macrophages after TNF-α stimulation. Our primary inding from this study is that PM results in
reduced capability of macrophages to produce GM-CSF, as we observed reduced CSF2 (GM-CSF) mRNA as well as reduced GM-CSF protein in the supernatant of
peritoneal macrophages.
The control group received a diet containing adequate protein, while the PM group received a
protein-deicient diet. The PM animals consumed the same amount of food as control animals; however, a markedly lower
protein intake and weight loss were observed, with mice losing approximately 20% of their initial weight in a period of 28 days after the introduction of the hypoprotein diet. The levels of micronutrient consumption were in accordance with the minimum daily recommendations (Reeves et al., 1993). Considering the fact that both groups consumed the same amount of food, we can conclude that the changes observed in our PM experimental model were mainly due to the decrease in protein intake.
In our study, the PM animals exhibited reduced protein and albumin concentrations as well as leukopenia associated with anemia and reduction of peritoneal cell number. These results are in accordance with the literature and the evidence also indicates that, even in situations in FIGURE 1 - Expression of M-CSF (A) and GM-CSF (B) mRNA in peritoneal cells. Results are expressed as the mean and standard deviation for the control (C) (n = 6) and protein-malnourished (PM) (n = 6) groups. * Signiicant diference between the PM and control groups (p ≤ 0.05).
which malnutrition is not associated with other diseases, leukopenia always occurs (Catchatourian et al., 1980;
Grimble, 1996; Borelli et al., 2009; Cunha et al., 2013). However, the exact mechanism underlying protein-malnourishment leukopenia remains unknown.
Innate immunity is the irst barrier against infections
and plays a pivotal role in the induction of adaptive
immunity (Chandra, Kumari, 1994; Grimble, 1996; Fock et al., 2007). Macrophages are involved in innate immunity, and are capable of phagocytosing and killing fungi and other microorganisms. Furthermore, macrophages are also responsible for the secretion of soluble stimulatory factors, such as cytokines and growth factors. The up-regulation of these soluble factors is an important mechanism of host defense against infection and has an important function in the production and maturation of hematopoietic cells
(Ulevitch, Tobias, 1995; Katholnig et al., 2013).
Among these growth factors, the evaluation of M-CSF and GM-CSF production by macrophages is not just important to understand the immune response, but also to understand the production and maturation of hematopoietic cells, especially monocytes and macrophage lineage. M-CSF is the primary regulator of mononuclear phagocyte production in vivo and plays an
essential role in the survival, proliferation, diferentiation
and maturation of the macrophage myeloid lineage. GM-CSF has been shown to be involved in maturation and mobilization of macrophages and antigen presentation
to these cells, and acts as a pro-inlammatory cytokine (Burgess, Metcalf 1980; Gonzalez-Juarrero et al., 2005).
As described above, M-CSF levels can be detectable
in steady states; however, GM-CSF requires an additional stimulus to be detected (Hamilton, 2008; Sierra-Filardi
et al., 2014) and, because of that, in the current study we decided to stimulate the peritoneal macrophages with
TNF-α. Our results revealed no difference in M-CSF production; however, macrophages from PM animals
showed reduced GM-CSF mRNA expression, which led to a reduced capability to produce GM-CSF. In addition,
macrophages from PM animals stimulated with TNF-α did
not show an increase in GM-CSF production as observed
in the control group in which, after TNF-α stimulation, the
macrophage production of GM-CSF increased two-fold in comparison to unstimulated cells. These results can be explained, in part, by reduced expression of the TNF receptor as previously reported by our group (Oliveira et al., 2014).
GM-CSF supports the diferentiation and maturation
of hematopoietic cells, activates mature blood cells, stimulates phagocytosis and antigen-induced immune
responses and alters the Th1/Th2 cytokine balance
(Burgess, Metcalf, 1980; Gonzalez-Juarrero et al., 2005). Studies blocking GM-CSF with a neutralizing monoclonal
antibody (mAb) in inlammation and autoimmune models
demonstrate that endogenous GM-CSF can contribute to mobilization of monocytes and neutrophils, presumably
from the bone marrow. Thus, its pro-inlammatory efects
may lead to a systemic and local increase of myeloid cell
numbers (Hamilton, Tak, 2009; Hamilton, Achuthan, 2013).
CONCLUSIONS
Based on previous literature results (Vinolo et al.,
2008; Cunha et al., 2013; Oliveira et al., 2014) and with the current results, we can conclude that PM impacts GM-CSF production, leading to alterations in hematopoietic cell production and immune response. This pattern of cytokine production could partially explain immunodeficiency and the hematopoietic changes presented in protein-malnourished organisms.
ACKNOWLEDGEMENTS
This investigation was supported by grants from the Fundação de Amparo à Pesquisa do Estado de São Paulo – FAPESP.
REFERENCES
BARREDA, D. Regulation of myeloid development and
function by colony stimulating factors. Dev. Comp.
Immunol., v.28, n.5, p.509-554, 2004.
BORELLI, P.; BARROS, F.E.; NAKAJIMA, K.; BLATT, S.L.; BEUTLER, B.; PEREIRA, J.; TSUJITA, M.; FAVERO, G.M.; FOCK, R.A. Protein-energy malnutrition halts hemopoietic progenitor cells in the G0/G1 cell cycle stage, thereby altering cell production rates. Braz. J. Med. Biol. Res., v.42, n.6, p.523-530, 2009.
CHANDRA, R.K.; KUMARI, S. Effects of nutrition on the immune system. Nutr., v.10, n.3, p.207-210, 1994. [Review].
BURGESS, A.W.; METCALF, D. The nature and action of granulocyte-macrophage colony stimulating factors. Blood, v.56, n.6, p.947-958, 1980.
CALDER, P.C. Feeding the immune system. Proc. Nutr. Soc.,
CATCHATOURIAN, R.; ECKERLING, G.; FRIED, W. Efect of short-term protein deprivation on hemopoietic functions of healthy volunteers. Blood, v.55, n.4, p.625-628, 1980.
CUNHA, M.C.R.; LIMA, F.S.; RAMIREZ VINOLO, M.A.; HASTREITER, A.; CURI, R.; BORELLI, P.; FOCK, R.A. Protein malnutrition induces bone marrow mesenchymal stem cells commitment to adipogenic diferentiation leading to hematopoietic failure. PLoS One, v.8, n.3, art.e58872,
p.1-12, 2013. Available at: http://journals.plos.org/plosone/ article?id=10.1371/journal.pone.0058872. Accessed on: 15 nov. 2014.
DUMAS, B.T.; WATSON, W.A.; BIGGS, H.G. Albumin standards and the measurement of serum albumin with bromcresol green. Clin. Chim. Acta, v.258, n.1, p.21-30,
1997.
FOCK, R.A.; VINOLO, M.A.; SÁ ROCHA, V.M.; SÁ ROCHA, L.C.; BORELLI, P. Protein-energy malnutrition decreases the expression of TLR-4/MD-2 and CD14 receptors in peritoneal macrophages and reduces the synthesis of TNF-alpha in response to lipopolysaccharide (LPS) in mice.
Cytokine, v.40, n.2, p.105-114, 2007.
GONZALEZ-JUARRERO, M.; HATTLE, J.M.; IZZO, A.; JUNQUEIRA-KIPNIS, A.P.; SHIM, T.S.; TRAPNELL, B.C.; COOPER, A.M.; ORME, I.M. Disruption of granulocyte macrophage-colony stimulating factor production in the lungs severely afects the ability of mice to control Mycobacterium tuberculosis infection. J. Leukoc. Biol., v.77, n.6, p.914-922, 2005.
GORNALL, A.G.; BARDAWILL, C.J.; DAVID, M.M. Determination of serum proteins by means of the biuret reaction. J. Biol. Chem., v.177, n.2, p.751-766, 1949.
GRIMBLE, R.F. Interaction between nutrients, pro-inlammatory cytokines and inlammation. Clin. Sci., v.91, n.2, p.121-130,
1996.
HAMILTON, J.A.; TAK, P.P. The dynamics of macrophage lineage populations in inflammatory and autoimmune diseases. Arthritis Rheum., v.60, n.5, p.1210-1221, 2009.
HAMILTON, J.A. Colony-stimulating factors in inlammation and autoimmunity. Nat. Rev. Immunol., v.8, n.7, p.533-544,
2008.
HAMILTON, J.A.; ACHUTHAN, A. Colony stimulating factors
and myeloid cell biology in health and disease. Trends
Immunol., v.34, n.2, p.81-89, 2013.
K AT H O L N I G , K . ; L I N K E , M . ; P H A M , H . ; HENGSTSCHLÄGER, M.; WEICHHART, T. Immune responses of macrophages and dendritic cells regulated by mTOR signalling. Biochem. Soc. Trans., v.41, n.4, p.927-933, 2013.
KEUSCH, G.T. The history of nutrition: malnutrition, infection and immunity. J. Nutr., v.133, n.1, p.336S-340S, 2003.
LIVAK, K.J.; SCHMITTGEN, T.D. Analysis of relative gene expression data using real-time quantitative PCR and the 2(-Delta Delta C(T))method. Methods, v.25, p.402-408, 2001.
MESHKIBAF, S.; WILLIAM GOWER, M.; DEKABAN, G.A.; OUK KIM, S. G-CSF preferentially supports the generation of gut-homing Gr-1high macrophages in M-CSF-treated bone marrow cells. J. Leukoc. Biol., v.96, n.4, p.549-561,
2014.
METCALF, D. Concise review: hematopoietic stem cells and tissue stem cells: current concepts and unanswered questions. Stem Cells, v.25, n.10, p.2390-2395, 2007.
MORRISON, S.J.; SCADDEN, D.T. The bone marrow niche for haematopoietic stem cells. Nature, v.505, n.7483,
p.327-334, 2014.
OLIVEIRA, D.C.; HASTREITER, A.A.; MELLO, A.S.; OLIVEIRA BELTRAN, J.S.; OLIVEIRA SANTOS, E.W.; BORELLI, P.; FOCK, R.A. The efects of protein malnutrition on the TNF-RI and NF-κB expression via the TNF-α signaling pathway. Cytokine, v.69, n.2, p.218-225,
2014.
REEVES, P.G.; NIELSEN, F.H.; FAHEY, G.C. AIN-93 puriied diets for laboratory rodents: inal report of the American Institute of Nutrition ad hoc writing committee on the reformulation of the AIN-76A rodent diet. J. Nutr., v.123,
n.11, p.1939-1951, 1993.
SIERRA-FILARDI, E.; NIETO, C.; DOMINGUEZ-SOTO, A.; BARROSO, R.; SÁNCHEZ-MATEOS, P.; PUIG-KROGER, A.; LÓPEZ-BRAVO, M.; JOVEN, J.; ARDAVÍN, C.; RODRÍGUEZ-FERNÁNDEZ, J.L.; SÁNCHEZ-TORRES, C.; MELLADO, M.; CORBÍ, A.L. CCL2 Shapes macrophage polarization by GM-CSF and M-CSF: identification of CCL2/CCR2-dependent gene expression proile. J. Immunol.,v.192, n.8, p.3858-3867, 2014.
ULEVITCH, R.J.; TOBIAS, P.S. Receptor-dependent mechanisms of cell stimulation by bacterial endotoxin.
Annu. Rev. Immunol., v.13, p.437-457, 1995.
VINOLO, M.A.; CRISMA, A.R.; NAKAJIMA, K.; ROGERO, M.M.; FOCK, R.A.; BORELLI, P. Malnourished mice display an impaired hematologic response to granulocyte colony-stimulating factor administration. Nutr. Res., v.28, n.11, p.791-797, 2008.
WARD, P.G. A Micro-Kjeldahl procedure for ield use. J. Med. Lab. Technol., v.20, p.191-195, 1963.
XAVIER, J.G.; FAVERO, M.E.; VINOLO, M.A.; ROGERO, M.M.; DAGLI, M.L.; ARANA-CHAVEZ, V.E.; BOROJEVIC, R.; BORELLI, P. Protein-energy malnutrition alters histological and ultrastructural characteristics of the bone marrow and decreases haematopoiesis in adult mice.
Histol. Histopathol., v.22, n.6, p.651-660, 2007.
Received for publication on 11st February 2015