Indicators: how much complexity
is desirable?
Indicadores: quanta complexidade é
desejável ?
Philip Musgrove
Principal Economist
Health, Nutrition and Population The World Bank
Room G-7-015
1818 H Street NW Washington, DC 20433
Paper prepared for Round-Table VI. Indicators: Methodological Aspects. V Brazilian Epidemiology Congress, Curitiba, PR, Brazil. March 23-27, 2002.
The opinions expressed here are entirely the author’s, and do not necessarily represent the views of the World Bank, its Executive Directors, or the countries they represent.
Introduction
A great many specific topics could be treated under the heading of “methodologi-cal aspects of indicators” – purposes, defini-tions, data needs, methods of calculation or estimation, accuracy, sensitivity, specificity, potential uses, and so on. This paper ap-proaches the subject not through any of these topics, but by looking at several indicators and trying to draw some conclusions from them about how to make up good indicators for moderately complex situations. That is, all the indicators considered involve at least two measurable variables; and they are sometimes built up from other indicators which are already generally accepted as ad-equately representing simpler concepts.
All the examples chosen, except the first, are ones with which I have had some per-sonal involvement, in making them up, criti-cizing them, or both. I think some useful les-sons can be drawn from these cases – lesles-sons about what to do, or in some cases, what not to do. The principal lessons concern the right degree of complexity of an indicator – how many variables to base it on, how to relate them to one another, and how to assure that the result is understood by whoever needs to understand it. This is particularly important when the indicator is to be used directly to determine the allocation of resources, or in-directly to influence such decisions.
A non-epidemiological example:
the “wind-chill index”
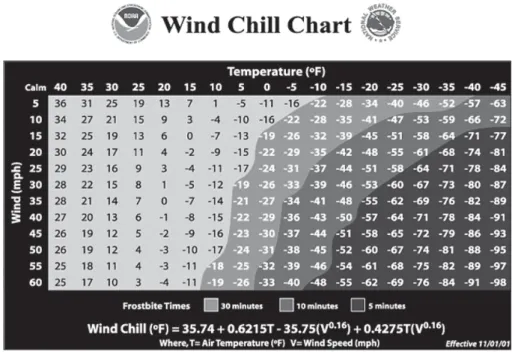
chill index, replacing one that has been in use since 19451. The formula for the new index is
Wind Chill = 35.74 + 0.6215TTTTT – 35.75(VVVVV**0.16) + 0.4275TTTTT(VVVVV**0.16)
Where TTTT is the temperature in degreesT Fahrenheit and VVVVV is the wind velocity in miles per hour, both measured or estimated at a height of five feet above the ground. Figure 1 shows the effective temperature for meas-ured temperatures from 40 F (4.4 C) down to 45 below zero (- 43 C), and wind speeds from calm air (under 3 mph or 5 kph) to 60 mph (100 kph), which is nearly hurricane force. The chart also shows how long it would take for exposed skin to become frostbitten, which is the maximum safe time out of doors. Converting to metric units changes the numerical parameters but not the way the two variables are related.
As with many other indicators, this one required specification of the way the com-ponent variables are to be measured (units, and height above ground). What is more important is that the index is built on a model of the human face – the area most exposed to frostbite – using modern theory about how
heat is transferred out of the body. This is the key improvement on the old index, which was based on the rapidity with which water in exposed containers freezes, under differ-ent combinations of temperature and wind speed. This theoretical modeling is what leads to the interaction of the two variables and to the exponent of 0.16 on the velocity. The ef-fect of the wind is greater, the lower the tem-perature is; and at a given temtem-perature, the effective temperature falls less rapidly than the wind speed increases because there is an upper limit to how fast heat is lost.
This example has nothing to do with epi-demiology, which would be relevant only for estimating the incidence of hypothermia or frostbite. Nonetheless this case suggests some more general properties of good indicators. First, it has to be clear what one is trying to measure. What matters is not how cold it is, but how cold it feels to a human being. The old index, without the theoretical modeling that went into the revised version, gave a very different notion of how the effective tem-perature fell as wind velocity increased (Fig-ure 2), and even showed an implausible warming after the speed passed 55 mph (88 kph). Second, even this carefully worked-out
measure misses some important effects, such as those due to warming by sunlight, so further refinements may be undertaken. This may improve the accuracy of the indicator, at some cost to how easily it can be under-stood by someone deciding how warmly to dress; certainly the inclusion of a sunlight variable in the indicator will require making it as easy to understand as temperature and wind speed are. Third, there is no ideology, no extra-scientific assumption, in the con-struction of the wind chill indicator. This seems so obviously desirable as hardly to need mentioning, but indicators in the health field are not always free of assumptions that have little theoretical or evidentiary founda-tion. Finally, just because two or more vari-ables are involved does not mean the only way to relate them is to add them together. The wind chill index includes a term linear in temperature, but not in velocity, and there is also an interactive term. For this particular indicator, linearity would lead to overesti-mation of the danger of frostbite at high wind velocities and would not take account of how the effect of the wind depends on the tem-perature. Both the question of ideology and that of linearity arise in the next example to be considered.
Indicator overload: trying to
measure “health needs”
Just as it seems desirable to have an indi-cator of the total health situation of a popula-tion, involving a number of criteria and some difficult issues of judgment2,3, it might seem
helpful to have an aggregate indicator of the “health needs” of that population—that is, some way of summarizing not only how healthy or sick the population is, but what capacity the society has to take care of or improve its health and how well that capacity is being used. Some such reasoning must have appealed to the Pan American Health Organi-zation in 1988, because when it published an “analysis of basic indicators”4, the technical
document included an attempt to construct an “indicator of health needs”. Unfortunately, the attempt was a failure; and if the consult-ants hired for this task were not actually char-latans, at least they did not know what they were doing. There are many things wrong with the indicator they produced5, but three in
particular are relevant to this discussion. First, the index included no fewer than 20 different variables, grouped in five classes. This is simply overload, and makes it all but impossible to grasp intuitively what is being
measured. Some of the variables are purely demographic – fertility, growth rate of popu-lation, and shares of population under 15 or over 60; some are measures of health status – life expectancy at birth, infant and child mor-tality rates, and fraction of newborns who are underweight; others refer to health service utilization – immunization rates and hospital discharges; still others count health-related capital – hospital beds, doctors, dentists, nurses and auxiliaries per capita; and some refer to economic variables – income per head, health expenditure as a share of GDP and the share of health spending by the cen-tral government. It can certainly be argued that many or all of these variables would be relevant to decisions, say, about whether a country needed or could use more foreign assistance in health, which is currently the subject of considerable debate6. But that
would require some conceptual or theoreti-cal basis for how to relate needs as a function of one variable, to the levels of other vari-ables. If immunization rates in a country are low because spending is low and there are too few trained personnel, the implications are very different from the case when there is no shortage of money or of nurses and auxil-iaries and yet children go unprotected.
In the absence of any such model relat-ing the variables, the index was constructed by linear combination. The complete for-mula – actually the first principal compo-nent to emerge from the analysis is:
Index of needs = -0.09239(Population < 15) + 0.09221(Population > 60) - 0.07477(Popula-tion growth rate) – 0.08918 (Fertility rate) + 0.06780(Literacy rate) + 0.08330(Life Expect-ancy) – 0.07413(Infant Mortality) – 0.06569 (Child Mortality) – 0.04743(Low Birth-weight) + 0.08231(Beds per capita) + 0.05923(Doc-tors per capita) + 0.05933(Dentists per capita) + 0.08943(Nurses per capita) + 0.08090(Aux-iliaries per capita) + 0.07542(Hospital Dis-charges per capita) + 0.04327(Polio Immuni-zation) + 0.05733(DPT ImmuniImmuni-zation) + 0.08397(GNP per capita) + 0.03225(Health spending as % of GNP) + 0.08121(Central Government % of health spending)
to test whether they are sound. It is a differ-ent matter to argue that the worst kind of health spending is out of pocket, and that public expenditure can protect against the impoverishing effects of such spending, es-pecially when most people cannot afford meaningful private insurance7,8. But even on
that view, it does not follow that all public spending should come from the central gov-ernment.
The point of this discussion is not to criti-cize PAHO for being misled into a nonsensi-cal exercise. It is only to illustrate the dangers of trying to make complicated indicators for ill-defined notions, particularly without ad-equate conceptual and mathematical under-pinning. Stringing so many variables together is almost sure to lead to an unsound or unin-telligible outcome, even if every variable by itself is a valid indicator of something.
Probabilities as indicators:
judging equity by inequalities
There are other ways to link variables than by linear combination (or even non-linear and interactive formulas, as with the wind-chill in-dex). Sometimes the variables correspond to a natural progression of events or possibilities, so that indicators can be chosen for each stage. The next example takes this approach, which avoids the need to find a single indicator cor-responding to a complex notion – in this case, the notion of equity in health.
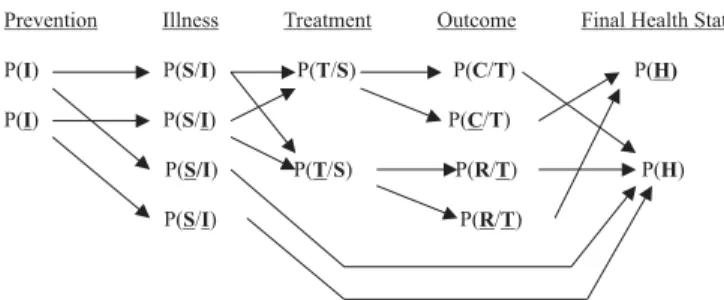
In a simplified model of an episode of illness or injury, a person may or may not benefit from a preventive action IIIII (immuni-zation, for instance); may or may not be-come sick SSSSS or injured; and if sick or hurt,
may or may not receive treatment TTTTT. In the absence of treatment, he or she may or may not recover RRRRR; with treatment, he or she may or may not be cured CCCC. If each of these eventsC is regarded as all-or-nothing, abstracting from the severity of illness and from incom-plete or inadequate treatment, cure and re-covery, then each stage can be character-ized by a probability. Equity may be consid-ered a state of equal probability for every-one – equal chances of being protected, be-ing sick, gettbe-ing treated, and so on. (The prob-ability that someone will get treatment de-spite not being sick or otherwise needing in-tervention, is not considered.) This will be an unconditional probability for IIIII, and for all but the last of the subsequent stages, a prob-ability conditional on what happened at the previous stage. The person’s final state of health HHHHH then depends on the whole se-quence of probabilities, as shown in Figure 3, modified from9 by the addition of the
pre-ventive stage IIIII. Underlining indicates that the event in question does not happen; the prob-ability of that is 1.0 minus the probprob-ability that it does happen. Arrows indicate the transi-tions from one stage to the next.
Good health status at the end of this se-quence comes from not having been sick or hurt; from recovering without treatment, if sick; or from getting treatment that cures the problems or restores health. The prob-ability of that outcome depends on the ef-fectiveness of the preventive action, P(SSSSS/IIIII) – P(SSSSS/IIIII), as well as on the likelihood or cover-age of that action, P(IIIII). Similarly, it depends on the effectiveness of treatment, P(CCCCC/TTTTT) – P(RRRRR/TTTTT), as well as on the chance of being treated when in need, P(TTTT/ST SSSS). Thus one
son from this approach is that equity of final outcomes depends not only on the equity of intermediate steps but also on the effective-ness of those steps. If treatment is ineffec-tive, for reasons of poor quality or some other cause, it does not matter much, so far as health outcomes are concerned, that some people get treated and some do not.
Effectiveness, as indicated, is measured by the difference of two probabilities. In or-der to calculate P(HHHHH), probabilities are also sometimes multiplied. This can be done sen-sibly because the denominator of one prob-ability is the numerator of the one before. But there are no simple linear combinations, and the underlying variables – the numbers of people given preventive care, or who get sick, or are treated, or recover – are never added together. Among other things, this means that a high probability of something desirable at one stage does not hide or offset a low probability elsewhere in the sequence. A more significant lesson from linking probabilities in this way is that “the equity of health” is not one thing but a series of chances, with probabilities that may differ from stage to stage, and among people or population groups at each stage. The incidence of illness may be more or less equally distributed than the utilization of treatment, and may also vary with the equity of coverage of preven-tive activities. A health system may perform well at one stage – immunization, say – and quite poorly at another, such as treatment that actually resolves problems. And of course equity may look very different de-pending on which risk factor, disease, con-dition or treatment one considers. It is true that the end of the sequence is a single prob-ability, P(HHHH), but differences in the chance ofH good health depend on differences at all prior stages, so equity cannot be summed up by inequalities in that one probability. In par-ticular, how the health system performs in achieving equity is a question of the stages which are or should be under its control, namely P(IIIII), P(TTT/STT SS) and P(CSS CCCC/TTTTT). Public health measures, especially information to the public, may also allow the health system to improve the likelihood of recovery
with-out treatment, P(RRRRR/TTTT). These questions ofT how to judge the health system arise explic-itly in the example discussed next.
One feature that is missing from this ap-proach to equity is that of equity or fairness in how health care is financed. This is now seen as extremely important for its effect in preventing some people from receiving treat-ment because they cannot afford the cost, and also in its own right7. It is increasingly
considered inequitable that some people should be impoverished by paying for health care, or because poor health destroys their capacity to earn income. From household data it is possible to construct indicators of the extent and severity of the impoverishing effects of recent spending on health care10.
How much of current poverty is due to ill health is less easy to sum up in an aggregate indicator, partly because the ill health may be chronic or may have occurred long ago.
Estimating health sector
“attainment” and “performance”
The World Health Organization has pub-lished indicators for five notions of what a health system appears to achieve (“attain-ments”), and for how well those achieve-ments compare to an idea of what should be possible, given the society’s average level of schooling and the amount of money it spends on health (“performance”)7. These indicators
have been widely criticized, particularly be-cause they were made up without any con-sultation with the countries whose health systems were being judged, and also because the majority of the numbers were not based on any observation of the variables of inter-est but were imputed, based on other vari-ables. This is not the place to take up the whole debate over WHO’s numbers and how they were derived; rather, the question is whether the indicators proposed illustrate some of the same issues raised by the other indicators discussed here.
inter-est. The “performance” measure, which de-pends on estimating both the maximum pos-sible attainment and the minimum that would be reached even if there were no health sys-tem, can be considered an example of over-loading with assumptions: too much has to be assumed, relative to the amount of actual information in the calculation. In the case of the “responsiveness” indicator, imputing val-ues based on regressions led to a formula which is overloaded both in variables and in the ways they are related to one another – not only linearly but also exponentially and in loga-rithms and powers, sometimes singly and sometimes interactively. The result – which WHO does not propose to repeat – is some-thing shorter than the “health needs index” but even more complicated11:
Responsiveness = 1.123 + 0.0000423(Health Spending per head) + 0.0123(Mean School-ing) + 0.0142 Ln (mean SchoolSchool-ing) + 0.0000208 (GDP per head) + 0.0239 Ln (GDP per head) + 0.0165(Access Rate) + 0.0417(%Private Health Spending) + 0.0494(%>65**-0.139) (Mean Schooling**0.203)(Access Rate**0.059) + 0.0702(Mean Schooling**0.173) EXP[0.213 (Access Rate)] + 0.0310(%Poor**0.562) (Ac-cess Rate**-0.462).
Other criticisms apply to the indicator of “health status”, measured in disability-ad-justed life years, and to the indicator of “fi-nancial fairness”. In the first case, the indica-tor does add useful information, but requires numerous somewhat arbitrary parameters to compare conditions of disability, just as for the estimation of the burden of disease12.
The fewer arbitrary parameters, the better, seems to be a good general rule in designing indicators; this point is elaborated below. In the second case, there is little justification for the assumption that fairness or equity means that every household should contrib-ute exactly the same share of its non-sub-sistence income to financing health. Two of the inequality indicators are also more com-plex mathematically than may be reason-able13, making comparisons difficult –
al-though WHO provides a justification for the
complexity, based on consulting preferences. Granting all those criticisms, the WHO exercise nonetheless illustrates some virtues in the construction of indicators. First, it was thoroughly thought out what each indicator was meant to measure; there is a great deal of conceptual clarity behind them. Second, where data corresponding to the concepts did not exist, they were estimated—not only by imputation, but sometimes by construc-tion from primary data sources for a limited number of countries. Simply using whatever numbers are already at hand is often the cheapest solution but not the best. Third, much thought went into the mathematical relations among variables or among the dif-ferent values of a given variable. Where they were combined linearly, as in the “overall attainment” indicator, WHO provided a rea-soned argument for not letting the marginal importance of one variable depend on the level of that variable, or any other. The weights or parameters applied to the differ-ent attainmdiffer-ents were also derived from a consultative process rather than being speci-fied arbitrarily. The technical failings of the resulting indicators, and the ethical failings of how they were produced and launched on the world, should not obscure these vir-tues. Fortunately, the resulting ranking of health systems had no consequence for what is spent, or done, in any system. Some ex-amples are taken up next, in which indica-tors do have such consequences.
Indicators for resource allocation:
sharing public money
formu-las rather than indicators for that reason, but some of the same problems arise as for de-scriptive indicators, and some of the same principles apply for their construction. They are particularly important in federal systems, where funds may be raised primarily by the central government but spent by sub-na-tional governments, which may also contrib-ute from their own revenues. The United States, Canada and Brazil provide examples of formulas for transferring federal funds for health to states or provinces14 for general
use or for specific programs of financing health care for part or all of the population or for investment in physical capacity.
Although the formulas were devised for somewhat different purposes, it is instructive to compare them. In the United States, the formula governs the federal share of financ-ing of the Medicaid program of health care for the poor. Federal or national expenditure in state s is CNs = CNs = CNs = CNs = CNs = φs*Qs*s*Qs*s*Qs*s*Qs*s*Qs*πsssss, while the state government’s expenditure is CSs = (1 - CSs = (1 - CSs = (1 - CSs = (1 - CSs = (1 - φs)s)s)s)s) *Qs*
*Qs* *Qs* *Qs*
*Qs*πs, s, s, where Cs, s, CCCC refers to cost or expendi-ture, QQQQQ is the total quantity of services pro-vided to the beneficiary population, and π is the price of those services. Both quantities and prices vary among states, which have some leeway in determining who can register as a beneficiary and in negotiating prices with private providers. The parameter φ, which also varies among states, is the federal share: it depends on a state’s per capita income, and ranges from one-half in the richer states to five-sixths in the poorest ones.
In Canada, under the previous federal/ provincial arrangement for financing health care from earmarked funds, public expendi-ture in a province was Cs = Q*Cs = Q*Cs = Q*Cs = Q*Cs = Q*π*Ps –*Ps –*Ps –*Ps –*Ps – Qas*
Qas* Qas* Qas*
Qas*π*As.*As.*As.*As.*As. QQQQQ are quantities per capita and π
are prices of the public program. PPPPP is the entire population of the province, while A A A A isA the population covered by private insurance. Qa
Qa Qa Qa
Qa is the quantity of services provided for those insured. The public expenditure was then the cost of the public coverage for eve-ryone, less the expense covered by insur-ance. Each province was required to spend on health, a fraction β of its revenues RsRsRsRsRs (own tax revenues plus non-tied federal transfers).
This way the provincial contribution was CSsCSsCSsCSsCSs =
= = =
= β*Rs*Rs*Rs*Rs*Rs, and that of the federal government was CNs = Cs – CSs.CNs = Cs – CSs.CNs = Cs – CSs.CNs = Cs – CSs.CNs = Cs – CSs.
Brazil is now starting a transition to a sys-tem like that of Canada in one respect, which is that states and municipalities are required by a constitutional amendment to dedicate, at a minimum, a specific fraction of their revenues to health, that fraction to grow as the change is implemented. In principle, that means federal funds can be re-directed to benefit poorer states and municipalities more than in the past. Before this amendment was adopted, another formula was employed to allocate federal resources (from a combined World Bank-IDB loan) for investment among the states, with the same aim of protecting the poorest ones. The states were not to be guaranteed any particular amount of invest-ment, since what they actually received would depend on the number and quality of proposals they could submit; but funds would be reserved for them and not simply be allocated on a first-come, first-served basis for the country as a whole. The for-mula chosen was Fs/F = Fs/F = Fs/F = Fs/F = Fs/F = α*(Ps/P) + (1 -*(Ps/P) + (1 -*(Ps/P) + (1 -*(Ps/P) + (1 -*(Ps/P) + (1
-α)*(Ds/D))*(Ds/D))*(Ds/D))*(Ds/D))*(Ds/D), where FFFFF is the investment fund, P
P P P
P is population, and DDDDD is the gap between what a state has received in federal recur-rent funding, and what it would get if every state got as much per capita as the state re-ceiving the largest transfers per head. The fraction of the total fund assigned as a ceil-ing to a state, Fs/FFs/FFs/FFs/FFs/F, depends on the state’s share of the country’s population and on its share of the total deficit or gap in recurrent federal health expenditure, compared to the best-off state. The parameter α determines the relative weights of these two shares. Bra-zilian law required α≥ 0.5; the value chosen was 0.7. (The U. S. and Canadian parameters
φ and β were not legally constrained to any particular range of values.)
pro-vided may all be estimated with error, but it is clear what they all mean, and the errors are likely to be small. The other variables – state or provincial revenues, prices paid to medical care providers, and past central government spend-ing – are even easier to measure precisely. Sec-ond, several of these variables can be changed by government action at either the central or the state level, but none of them can readily be manipulated to the advantage of the central government or that of the recipient state or province. Once the formula is determined, cheating is essentially impossible; and there are no perverse incentives to distort the distribu-tion of funds from what it is intended to achieve. Third, each indicator includes only one arbitrary parameter (φ, , , , , β and α, respectively). This makes the formula much easier to un-derstand than one with several arbitrary num-bers, which in turn contributes to its being politically acceptable. More sophisticated-seeming formulas, including variables such as standardized mortality rates, were pro-posed in the Brazilian case. While there might have been some gain in matching transfers to needs for health spending, such complica-tions would have put at risk the necessary understanding and acceptance15 and would
have led in the direction of the unintelligible “health needs index” discussed above. All three formulas had inescapably to include at least one parameter that could only be determined or negotiated politically, but there was no need for more than one.
In Conclusion
The conclusions from this comparison of five different kinds of indicators are few and simple. Three suggestions seem worth emphasizing. First, avoid overloading an in-dicator with variables, as occurred with the “index of health needs” and the imputed
“re-sponsiveness” indicator of WHO. The fact that a variable bears some relation to the concept one wants to measure is necessary but not sufficient for it to be included in a formula. As more and more variables are incorporated, the problems of how to relate them increase, and the intelligibility of the result suffers. Second, ensure that the math-ematical relations among the variables agree with any sound, applicable theory. In par-ticular, do not just add variables together learly if the real effects are non-linear or in-teractive. And if the phenomenon of interest actually occurs in a logical or temporal se-quence, as illustrated by the indicators of equity in health, it is preferable to develop an indicator for each stage and specify how they are related – rather than trying to col-lapse all the stages into a single indicator cor-responding to the final stage. Third, while it may be unavoidable to include one or more arbitrary parameters in the equation, keep their number to a minimum. When every-thing can be objectively measured or esti-mated, it may be possible to have no arbi-trary constants at all, as in the wind-chill in-dex. When there is a political decision to make which cannot be determined solely from the scientific evidence, it may still be possible to limit the formula to just one arbitrary number, as in the United States, Canadian and Brazilian rules for allocating federal gov-ernment resources to sub-national govern-ments. Simplicity is valuable for assuring that the indicator captures the main variables and effects of interest, and even more so for making the result comprehensible and ac-ceptable to non-experts. None of these rules of thumb guarantees the definition and esti-mation of a good indicator for a complex concept, but they may help prevent the con-struction of measures that do not make sense or are needlessly difficult to interpret.
1. 1. 1. 1.
1. “National Weather Service Implements a New Wind“National Weather Service Implements a New Wind“National Weather Service Implements a New Wind“National Weather Service Implements a New Wind“National Weather Service Implements a New Wind Chill Temperature Index, from
Chill Temperature Index, from Chill Temperature Index, from Chill Temperature Index, from
Chill Temperature Index, from www.noaa.gov.
2. Sadana R. Measuring Health: Concepts. In: Murray L, Frenk J (eds.). Health System Performance: Concepts, Measurement and Determinants. (chapter 5). Geneva: World Health Organization; January 2001.
3. Murray CJL, Salomon J, Mathers CD. Summary Measures of Population Health. In: Murray CJL, Frenk J (eds.). Health System Performance: Concepts, Measurement and Determinants. (chapter 4) Geneva: World Health Organization; January 2001.
4. Pan American Health Organization, Los Servicios de Salud en las Américas: Análisis de Indicadores Básicos. Cuaderno Técnico No. 14. Washington, DC: PAHO, 1988.
5. Musgrove P. a Ruggiero AL, The ‘Indice de
Necesidades de Salud’…. Washington, DC: internal PAHO memorandum; 5 May 1989.
6. World Health Organization. Macroeconomics and Health: Investing in Health for Economic Development. Report of the Commission on Macroeconomics and Health. Geneva: WHO; 20 December 2001.
7. World Health Organization. World Health Report 2000. Health Systems: Improving Performance. Geneva: WHO; 2000.
8. Musgrove P, Zeramdini R, Carrin G. Basic Patterns in National Health Expenditure, Bull World Health Organ 2002; 80(2). p. 134-142.
9. Musgrove P, Measurement of Equity in Health, World Health Stat Q 1986; 39(4).
10. Wagstaff A, van Doorslaer E. Catastrophe and Impoverishment in Paying for Health Care: With Applications go Vietnam 1993-98. Unpublished paper. Washington, DC: the World Bank; February 2002.
11. Musgrove P. Judging Health Systems: Reflections on WHO’s Methods. Unpublished article. 5 February 2002.
12. Murray CJL, Lopez AD. (eds.). The Global Burden of Disease. Cambridge: Harvard University Press; 1996.
13. Musgrove P. Measuring Health System Attainment: Reflections on WHO’s Indicators, Unpublished article. 5 February 2002.
14. Musgrove P. Compensatory Finance in Health: in search of Geographic Equity in a Federal System, translated and revised version of a paper presented to the Third International Seminar on Fiscal Federalism. La Plata, Argentina, 24 April 1998.