ABSTRACT:Objective: To verify the correlation between overweight and socioeconomic and demographic indicators among Brazilian adults, using data from the Brazilian Household Budget Survey from 2008/2009.
Methods: We analyzed the joint relationships between overweight and socioeconomic and demographic indicators in the Brazilian adult population (99,532,672 individuals), through the multiple correspondence analysis technique. Results: The featured proile of the Brazilian adult population with regard to overweight was correlated with ages from 30 years of the most developed and economically social geographic regions of Brazil; however between genders, the correlation was in the opposite direction in the variables income, education, and subjective issues about life conditions related to food and nutrition security. Conclusion: By the joint relationship between overweight and selected demographic and socioeconomic indicators, the urgency of the development of strategies and/or preventive public health programs of health problems with overweight in the Brazilian adult population is suggested.
Keywords: Adult. Cross-sectional studies. Epidemiology. Overweight. Socioeconomic factors. Food security.
Correspondence between overweight and
socioeconomic and demographic indicators in
the adult Brazilian population
Correspondência entre excesso de peso e indicadores socioeconômicos e
demográicos na população adulta brasileira
Vladimir Schuindt da SilvaI,IV, Israel SouzaI,II,IV, Diego Augusto Santos SilvaIII, Edio Luiz PetroskiIII, Maria de Jesus Mendes da FonsecaIV
ORIGINAL ARTICLE / ARTIGO ORIGINAL
IResearch Group in Kinanthropometry, Human Performance and Strength Training at Universidade Federal Rural do Rio de
Janeiro – Seropédica (RJ), Brazil.
IIInstituto Federal de Educação, Ciência e Tecnologia do Rio de Janeiro – Paracambi (RJ), Brazil.
IIIResearch Group in Kinanthropometry and Human Performance at Universidade Federal de Santa Catarina – Florianópolis (SC), Brazil. IVNational Public Health School Sergio Arouca, at Fundação Oswaldo Cruz – Rio de Janeiro (RJ), Brazil.
Corresponding author: Vladimir Schuindt da Silva. Universidade Federal Rural do Rio de Janeiro. Departamento de Educação Física e Desportos. Grupo de Pesquisa em Cineantropometria, Performance Humana e Treinamento de Força. BR-465, km 7, s/n, Campus Universitário, CEP: 23890-000, Seropédica, RJ, Brasil. E-mail: [email protected]
INTRODUCTION
The recente behavioral changes that took place in many societies around the world, especially regarding dietary patterns and physical activities, have been a signiicant contribution to the increasing rates of overweight1, which now afects 30% of the adults2, with 5 million
estimated deaths a year until 20203. Population-based surveys ratify the epidemic progress
of overweight rates in the world and in Brazil, in the adult population4-7. Other studies
show the association between socioeconomic and demographic indicators and the reported outcome7,8-10. However, most studies analyzing the prevalence of overweight rates and
associated factors used association analyses, by simple and multiple linear regressions10, as
well as logistic and Poisson regressions7-9.
In this context, few studies used the correspondence analysis. Even though this methodology is considered to be a descriptive and exploratory technique, which simplifies complex data and produces exhaustive analyses of information that supports conclusions about it11, in this case it allows identifying how the variables are related
and which the profile and cluster of specific variables are. Besides, the graphic illustration of the correspondence analysis enables the understanding of inter-related factors addressed to health administrators, who have little contact with the complex regression analyses.
Therefore, this study aimed at verifying the correspondence between overweight and socioeconomic and demographic indicators among adults aged from 20 to 59 years old, RESUMO:Objetivo: Verificar a correspondência entre excesso de peso e indicadores socioeconômicos e demográficos em adultos no Brasil, por meio dos dados da Pesquisa de Orçamentos Familiares do período de 2008/2009. Métodos: Foram investigadas as relações conjuntas entre excesso de peso e indicadores socioeconômicos e demográficos na população adulta brasileira (99.532.672 indivíduos), por meio da técnica de análise de correspondência múltipla. Resultados: O perfil caracterizado da população adulta brasileira no que se refere ao excesso de peso foi correlacionado com idades a partir de 30 anos, das regiões geográficas mais desenvolvidas social e economicamente do Brasil, mas entre os sexos a correlação foi em direção oposta nas variáveis renda, escolaridade e das questões subjetivas sobre as condições de vida referentes à segurança alimentar e nutricional. Conclusão: Por meio das relações conjuntas entre excesso de peso e indicadores socioeconômicos e demográficos selecionadas, sugere-se a urgência do desenvolvimento de estratégias e/ou programas preventivos de saúde pública dos agravos à saúde ao excesso de peso à população de adultos brasileiros.
of both genders in Brazil, by a global analysis with sampling design structured to provide results with external validity.
METHODS
This study was based on secondary and public domain data, coming from the Household Budget Survey (POF) from 2008/200912. Data regarding the sampling procedure of
the survey were previously described at a speciic publication12. However, shortly, it is
informed that the efective size of the sample in POF 2008/2009 was of 4,696 sectors, corresponding to 55,970 interviewed households. The number of interviewed households per sector was established according to the research area as 12 households in the urban sectors and 16 in rural ones12.
In this investigation, a population of adults aged 20 to 59 years old was selected, of both genders, in the ive regions of the Brazilian national territory. Individuals with incomplete data, pregnant women and infants were excluded from the analysis, comprising 99,532,672 individuals. Collections and records of the information were performed directly in each of the selected households, with the residentes, by assisted interview recurring to the memory of the informer, for a period of nine consecutive days.
Overweight was veriied by the body mass index [BMI = body mass (kg)/height (m²)] and classified as ≥ 25.00 kg/m213. Body mass and height were measured in a portable
electronic balance for adults (brand not speciied by the Brazilian Institute of Geography and Statistics – IBGE), with minimum sensitivity of 100 g, maximum capacity of 150 kg and portable stadiometer for adults, by KaWe PERSON-CHECK® (KaWe, Germany), accuracy
of 0.1 cm and extension of up to 200 cm, respectively, according to the recommendations in the Manual of the Research Agent12.
The demographic and socioeconomic information of this study, extracted from the questionnaires of POF 2008/2009 (POF 1; POF 5 and POF 6)12, were: age group (20
to 29; 30 to 39; 40 to 49 and 50 to 59 years old); sex (male and female); color/ethnicity (white and nonwhite); major regions (North, Northeast, Southeast, South and Center-West); schooling (0 to 5; 6 to 9; 10 to 12 and ≥ 13 schooling years); income (1/2 ≤ MW; 1/2 > MW < 2; ≥ 2 MW) referring to the federal minimum wage (MW) that was current at the time of POF 2008/2009 (R$ 415.00) and life conditions (amount of consumed food: it is usually not sufficient; sometimes it is not sufficient; it is always sufficient; type of consumed food: always the wanted type; not always the wanted type; rarely the wanted type).
The bivariate description of socioeconomic and demographic indicators in the studied population was conducted according to BMI ≥ 25.00 kg/m2, and proportions
were compared by the χ2 test, considering a 5% significance level. The analysis of joint
was conducted by the multiple correspondence analysis (MCA), which is a multivariate analysis to explore categorical data, similar to the analysis, but mainly used for the graphic verification of the relationships between variable categories. In this methodology, the studied variable categories are visually represented by perceptual maps, and their correspondence is assessed according to the proximity of these categories (the closer they are, the higher the chances of being associated)11. This study also used the symmetric
normalization method, applied to know the differences or similarities between the two variables14.
The MCA becomes an extension of the correspondence analysis, thus enabling to study the relationship of more than two nominal variables, representing them in a few dimensions, usually two or three. In this study, two dimensions were chosen by the principle of parsimony, since they explained most of the variance in each analysis11. MCA transforms
qualitative data by associating optinal quantities to them (scores), which allow not only their graphic representation, but also the separation between categories. The measures of discrimination inform about the variables that mostly contribute with the deinition of each one of the dimensions, being the most relevant ones in terms of graphic interpretation. However, theory can lead variables with poor discriminatory power to be interpreted in a speciic dimension, and it is also possible to consider another variable in a diferent dimension in comparison to the more discriminatory one. Therefore, variables which not only contribute more to the expected dimension, but that are also simultaneously away from the origin in the graph14, are privileged.
The MCA does not define a selection procedure for the variables to composse the final model of the multivariate analysis, such as the automatic selection procedures for multiple regression models. Selection is often conducted based on the subjectivity of the researcher, and also on the theoretical knowledge about the analyzed subject14.
Therefore, the idea was to identify a combination of variables and categories presenting more stability when represented in the multidimensional space (graph of factors), explaining the higher percentage of variability in the set of data. The closer two variables would be in the graph, the more common would be its joint occurrence. The graph representing two dimensions generates four quadrants. Both dimensions, together, separate the characteristics placed in the upper left quadrant from those in the lower right quadrant, and the ones in the upper right quadrant from those in the lower left quadrant, thus characterizing groups with extremely opposite profiles. The method does not establish the statistical significance of the associations nor assesses the independent effect of each characteristic; however, it combines the advantages of non-linear and multidimensional methods11.
RESULTS
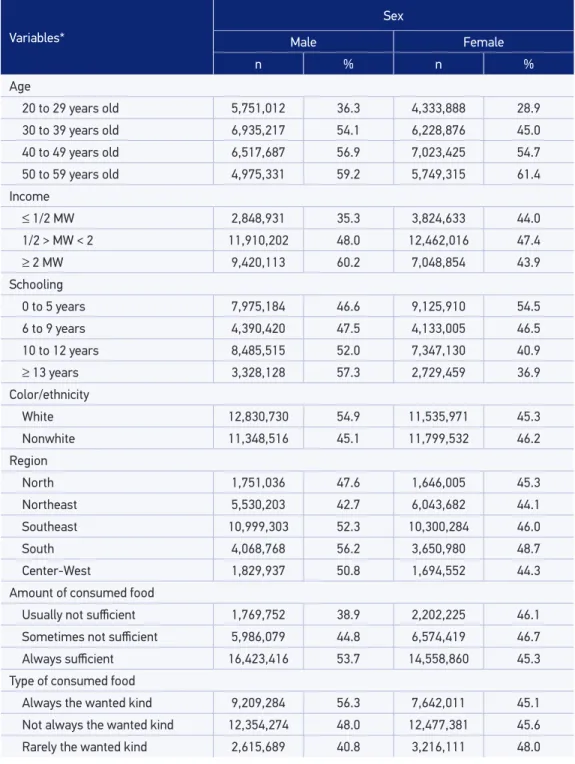
The distribution of socioeconomic and demographic conditions of individuals for both analyzed genders according to BMI ≥ 25.00 kg/m2 is presented in Table 1.
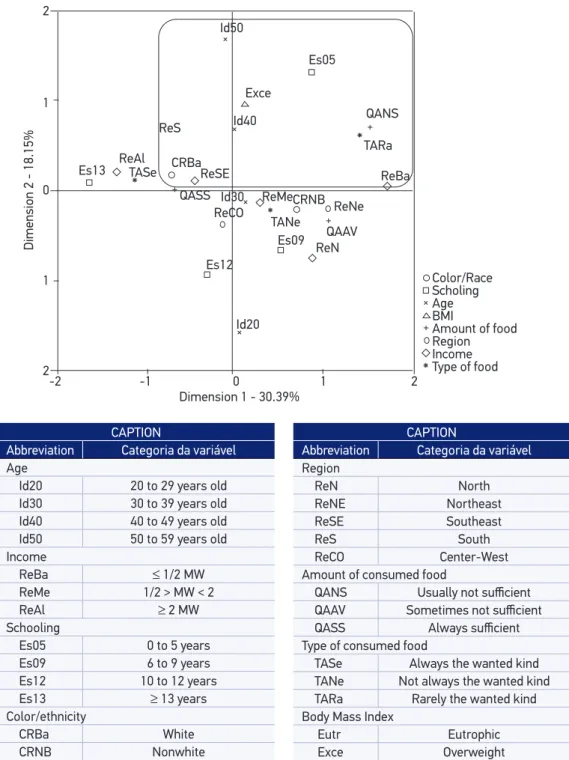
By the MCA, the two first dimensions with self-values higher than 1.3 and 1.4, explaining 48.4 and 48.5% of the variance, were used, being: 31.5 and 30.3% in the first and 16.8 and 18.1% in the second dimension, for male and female genders, respectively. The dimension values were stored for subsequent analyses. The choice of two dimensions was provided by the principle of parsimony, since they explained most of the variance in each analysis. The analyses showed there was a higher percentage in the contribution in each variable and in the composition of the first dimension, more influence regarding income, schooling, color/ethnicity and life conditions for both genders. In the second dimension, influence was more related to age, schooling (for both genders) and BMI (only for female participants).
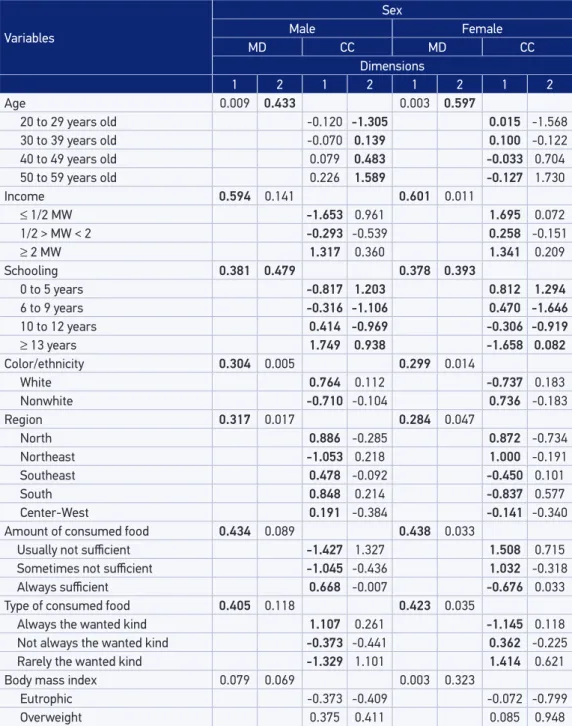
To build the odels, the measures of discrimination of the variables were used (Table 2). Therefore, the models only had the variables whose measures of discrimination were close to or higher than the values of inertia of the dimension. These refer to the variance explained by the dimension; therefore, there is 0.315 and 0.303 of inertia in the first and 0.168 and 0.181 of inertia in the second dimension, for male and female genders, respectively.
The quantiication of variable categories in the dimensions of the models occurred by the values of their centroid coordinates (Table 2), which allow the construction of tipologies organized by dimension and positive (signals) and negative loads of the centroid coordinates of each category.
The correlations between variable categories and the formation of clusters can be assessed by analyzing the proximity between points, as presented in Figures 1 and 2, or by the pattern of relationships between these characteristics. Overweight, being the object of this study, located in the upper right quadrant, in both genders, inluences the lower right quadrant, for men, and the upper left, for women. In the end, it provided a description with a general proile for individuals aged 30 years old or more, with self-declared white color, from the most socially and economically developed regions of the country. However, between genders, the correlation was in the opposite direction for the variables income, schooling and subjective issues of life conditions regarding food and nutritional safety (SAN).
DISCUSSION
Table 1. Frequency (%) of overweight (body mass index ≥ 25.00) according to socioeconomic and demographic characteristics in adults, by sex, Brazil (2008 to 2009).
Variables*
Sex
Male Female
n % n %
Age
20 to 29 years old 5,751,012 36.3 4,333,888 28.9
30 to 39 years old 6,935,217 54.1 6,228,876 45.0
40 to 49 years old 6,517,687 56.9 7,023,425 54.7
50 to 59 years old 4,975,331 59.2 5,749,315 61.4
Income
≤ 1/2 MW 2,848,931 35.3 3,824,633 44.0
1/2 > MW < 2 11,910,202 48.0 12,462,016 47.4
≥ 2 MW 9,420,113 60.2 7,048,854 43.9
Schooling
0 to 5 years 7,975,184 46.6 9,125,910 54.5
6 to 9 years 4,390,420 47.5 4,133,005 46.5
10 to 12 years 8,485,515 52.0 7,347,130 40.9
≥ 13 years 3,328,128 57.3 2,729,459 36.9
Color/ethnicity
White 12,830,730 54.9 11,535,971 45.3
Nonwhite 11,348,516 45.1 11,799,532 46.2
Region
North 1,751,036 47.6 1,646,005 45.3
Northeast 5,530,203 42.7 6,043,682 44.1
Southeast 10,999,303 52.3 10,300,284 46.0
South 4,068,768 56.2 3,650,980 48.7
Center-West 1,829,937 50.8 1,694,552 44.3
Amount of consumed food
Usually not suicient 1,769,752 38.9 2,202,225 46.1 Sometimes not suicient 5,986,079 44.8 6,574,419 46.7
Always suicient 16,423,416 53.7 14,558,860 45.3
Type of consumed food
Table 2. Measures of discrimination of variables and quantification of categories, centroid coordinates, in the dimensions (1 and 2) of the model, for adults, by sex, Brazil (2008 to 2009).
Variables
Sex
Male Female
MD CC MD CC
Dimensions
1 2 1 2 1 2 1 2
Age 0.009 0.433 0.003 0.597
20 to 29 years old -0.120 -1.305 0.015 -1.568
30 to 39 years old -0.070 0.139 0.100 -0.122
40 to 49 years old 0.079 0.483 -0.033 0.704
50 to 59 years old 0.226 1.589 -0.127 1.730
Income 0.594 0.141 0.601 0.011
≤ 1/2 MW -1.653 0.961 1.695 0.072
1/2 > MW < 2 -0.293 -0.539 0.258 -0.151
≥ 2 MW 1.317 0.360 1.341 0.209
Schooling 0.381 0.479 0.378 0.393
0 to 5 years -0.817 1.203 0.812 1.294
6 to 9 years -0.316 -1.106 0.470 -1.646
10 to 12 years 0.414 -0.969 -0.306 -0.919
≥ 13 years 1.749 0.938 -1.658 0.082
Color/ethnicity 0.304 0.005 0.299 0.014
White 0.764 0.112 -0.737 0.183
Nonwhite -0.710 -0.104 0.736 -0.183
Region 0.317 0.017 0.284 0.047
North 0.886 -0.285 0.872 -0.734
Northeast -1.053 0.218 1.000 -0.191
Southeast 0.478 -0.092 -0.450 0.101
South 0.848 0.214 -0.837 0.577
Center-West 0.191 -0.384 -0.141 -0.340
Amount of consumed food 0.434 0.089 0.438 0.033
Usually not suicient -1.427 1.327 1.508 0.715
Sometimes not suicient -1.045 -0.436 1.032 -0.318
Always suicient 0.668 -0.007 -0.676 0.033
Type of consumed food 0.405 0.118 0.423 0.035
Always the wanted kind 1.107 0.261 -1.145 0.118
Not always the wanted kind -0.373 -0.441 0.362 -0.225
Rarely the wanted kind -1.329 1.101 1.414 0.621
Body mass index 0.079 0.069 0.003 0.323
Eutrophic -0.373 -0.409 -0.072 -0.799
Overweight 0.375 0.411 0.085 0.948
MW: federal minimum wage. MD: measures of discrimination. CC: coordinates of centroids. Values in bold refer to the variables (and therefore the categories) whose measures of discrimination were close to or higher than the values of
Dimension 2 - 16.88%
Dimension 1 - 31.54% 2 Color/Race Id50 QANS Es05 TARa ReBa ReCO ReNe CRNB ReN QAAV Eutr TANe ReMe Es09 Id20 Id30 Id40 Exce CRBa ReS ReAl TASe QASS ReSE Es13 Es12
Type of food Income Region Amount of food BMI Age Scholing 1 0 1 2
-2 -1 0 1 2
CAPTION
Abbreviation Categoria da variável Age
Id20 20 to 29 years old Id30 30 to 39 years old Id40 40 to 49 years old Id50 50 to 59 years old Income
ReBa ≤ 1/2 MW
ReMe 1/2 > MW < 2
ReAl ≥ 2 MW
Schooling
Es05 0 to 5 years
Es09 6 to 9 years
Es12 10 to 12 years
Es13 ≥ 13 years
Color/ethnicity
CRBa White
CRNB Nonwhite
CAPTION
Abbreviation Categoria da variável Region ReN North ReNE Northeast ReSE Southeast ReS South ReCO Center-West
Amount of consumed food
QANS Usually not suicient QAAV Sometimes not suicient QASS Always suicient Type of consumed food
TASe Always the wanted kind TANe Not always the wanted kind TARa Rarely the wanted kind Body Mass Index
Eutr Eutrophic
Exce Overweight
BMI: body mass index.
CAPTION
Abbreviation Categoria da variável Age
Id20 20 to 29 years old Id30 30 to 39 years old Id40 40 to 49 years old Id50 50 to 59 years old Income
ReBa ≤ 1/2 MW
ReMe 1/2 > MW < 2
ReAl ≥ 2 MW
Schooling
Es05 0 to 5 years
Es09 6 to 9 years
Es12 10 to 12 years
Es13 ≥ 13 years
Color/ethnicity
CRBa White
CRNB Nonwhite
CAPTION
Abbreviation Categoria da variável Region ReN North ReNE Northeast ReSE Southeast ReS South ReCO Center-West
Amount of consumed food
QANS Usually not suicient QAAV Sometimes not suicient QASS Always suicient Type of consumed food
TASe Always the wanted kind TANe Not always the wanted kind TARa Rarely the wanted kind Body Mass Index
Eutr Eutrophic
Exce Overweight
Dimension 2 - 18.15%
Dimension 1 - 30.39% 2 Id50 QANS Es05 TARa ReBa
ReCO CRNB ReNe
ReN QAAV TANe ReMe Es09 Id20 Id30 Id40 Exce CRBa ReS ReAl TASe QASS ReSE Es13 Es12 1 0 1 2
-2 -1 0 1 2
Color/Race
Type of food Income Region Amount of food BMI
Age Scholing
BMI: body mass index.
the efectiveness of MCA for the standardized and similar distribution of these indicators, or reduced the possibility of selection bias, therefore improving the representativeness of the sample. The proposed method based on MCA distinguished the relationship of the groups placed in separated quadrants, with diferent characteristics.
This analysis revealed a worrisome scenario, mainly illustrated by the condition that, in practically all of the categories of the analyzed age groups, there was correspondence with overweight, thus implying potential over-risk of morbidity and mortality of the possible associations with overweight in a signiicant contingent of the Brazilian adult population. These results are consistent and in agreement with data from the Telephone-based Surveillance of Risk and Protective Factors for Chronic Diseases (VIGITEL)16, in
frequencies of overweight and obesity in Brazil. A possible justiication for such inding is related to the common aging process, which afects physiological aspects associated with the accumulation of body fat, like, for instance, the reduced metabolism and hormonal changes that can contribute with the increasing levels of body fat13.
In this sense, facing the epidemic progress of overweighr rates in these age groups in Brazil is a major challenge for administrators, professionals and researchers in the field of nutritional epidemiology, thus translating a process of intense changes in proximal factors, in the causal network of the several problems experienced in the past few years in Brazil, reported by changes in dietary habits and practice of physical activity, besides more distal factors regarding socioeconomic status. This implies the need for further investigations and understanding in this dynamic and current stage of the nutritional transition in the country, in order to amplify and integrate actions from several sectors in the national scenario to face overweight control, as well as to maintain the control over the nutritional status of the Brazilian adult population aged more than 20 years old.
In Brazil, the nutritional transition is taking place at the same time as the sequels of nutritional deiciencies. In general, the relationship between rates of overweight and social stratum is inverse: the poorest residents are characterized as the most vulnerable to such a process, due to low schooling, precarious purchasing power to buy healthy foods and less availability of places and time for physical activities17. This would lead to increasing
prevalence of chronic non-communicable diseases in the world1 and overweight, which,
in the country, is diferent between genders: it is more common among men from all income levels and among women with higher levels12.
The negative aspects of dietary habits, especially in Brazil, in the end of the first decade of the 21st century, indicate the need to prioritize public policies promoting a
healthy diet18, including efforts to solve problems of SAN, which can influence overweight
rates19. In this study, based on information referring to SAN, on subjective matters of
life conditions based on studies from the World Bank about this specific field20, which
are useful to establish limits and criteria to measure or establish poverty lines of populations21, a correlation between genders, in the opposite direction, was presented,
satisfaction (quality) — always the wanted type; and rarely the wanted type of consumed foods for men and women, respectively.
The aforementioned data, proposed as being good predictors of the real perception of individuals about essential factors for the quality of life of people22, may favor the increasing
approaches of studies regarding life conditions, which complemente other technical and scientiic evaluations addressed to analyzing nutritional patterns or other subjects. These can increase the possibilities of explanations related to health problems in adult populations referring to nutritional status12,16,21, especially concerning chronic diseases
in adult populations, thus helping to understand the qualitative aspects of the diet, inluenced by nutritional transition, thus implying the increasing prevalence of overweight, which is growing together with physical inactivity and morbimortality of chronic non-communicable diseases23-26.
The correspondence of overweight was demonstrated both in individuals with low and high schooling in thi study. Schooling is considered to be a proxy of economic status, and is constantly reported in studies about inequalities in health27. Besides, studies
indicate that people with low schooling are more prone to the relexes of overweight7,
and more vulnerable to dietary restrictions. Then, children coming from environments of food insecurity tend to present sequels of protein-energy malnutrition, with relexes in adulthood12. Because of that, it is assumed that measures related to providing access to all,
regardless of schooling and purchasing power, to information about the determinants and consequences of overweight, must be seen as possible strategies to prevent and control the disease28. These measures include public policies about the human right to adequate
food addressed to people who cannot access it easily.
By assessing the quadrants, the results of this investigation indicated the correlation of overweight with the geographic regions South, Southeast and Center-West, which are the most developed ones in the country in social and economic terms, thus corroborating indings in literature7,16. In mid-income countries, like Brazil, economic development is
associated with some characteristics considered to be obesigenic, such as sedentary lifestyle, in general, allied to the insuicient practice of physical exercises, daily stress, inadequate dietary habits and more access to food29.
Ethnic and racial disparities in health found in many countries, including Brazil, can be explained by socioeconomic issues that have been present for many generations30,31. These
disparities create groups that are especially exposed to risks, but their dynamics is complex, therefore, it is also necessary to promote debates in the Brazilian public health ield32.
In this contexto, it is relevant to analyze and interpret data regarding color/ethnicity, which are scarse in the national epidemiological literature; in other countries, like the USA and England, however, this variable has been important in the study of health matters33.
access to electronic devices, such as television and computer, which increases the chances of adopting sedentary lifestyles; therefore, the chances of overweight rates increase29.
One of the limitations of this study was the use of secondary data, which are prone to problems regarding the record of information. However, the team that performed data collection and record of information was trained by specialized technicians to decreased the chances of error.Besides, the cross-sectional design of the study does not allow establishing cause-and-efect relationships between independent and dependent variables. However, cross-sectional studies are relevant for estimating measures that are useful to assess the weight of the disease in the community. They are valuable for the planning of the health service35.
However, using the information in POF enables to subsidize public policies in the social ield to improve the conditions of the population, including thematic publc polices in the ields of nutrition, dietary guidance and public health nationally12.
CONCLUSION
The joint relationships between overweight and socioeconomic and demographic conditions, observed by the MCA technique — which was adequate to identify the overweight proile in the Brazilian adult population aged from 20 to 59 years old, of both genders —, suggest an alarming situation. Correlations were presented in almost all of the age groups, in the most socially and economically developed regions of the country, among white people, those with low income (women) and high income (men), and, inally, among the respondents to subjective questions regarding life conditions in terms of SAN. These questions were related to suiciency and satisfaction of the consumed foods in terms of quantity; suicient, as usual (men); and usually not suicient (women); and always the wanted type (men) and rarely the wanted type (women) regarding the quality of the food, respectively. In this sense, the development of public health strategies and/or programs to prevent health problems related to overweight among Brazilian adults is suggested.
1. Popkin MB, Adair LS, NQ SW. Global nutrition transition and the pandemic of obesity in developing countries. Nutr Rev 2012; 70(1): 3-21.
2. Stevens GA, Singh GM, Lu Y, Danaei G, Lin JK, Finucane MM, et al. National, regional, and global trends in adult overweight and obesity prevalence. Popul Health Metr 2012; 10(1): 22.
3. Wang H, Dwyer-Lindgren L, Lofgren KT, Rajaratnam JK, Marcus JR, Levin-Rector A, et al. Age-speciic and sex-speciic mortality in 187 countries, 1970-2010: a systematic analysis for the Global Burden of Disease Study 2010. Lancet 2012; 380(9859): 2071-94.
4. Doak CM, Wijnhoven TM, Schokker DF, Visscher TL, Seidell JC. Age standardization in mapping adult overweigth and obesity trends in the WHO European Region. Obes Rev 2012; 13(2): 174-91. 5. Wang H, Wang J, Liu MM, Wang D, Liu YQ, Zhao
Y, et al. Epidemiology of general obesity, abdominal obesity and related risk factors in urban adults from 33 communities of northeast china: the CHPSNE study. BMC Public Health (Online) 2012; 12: 967. 6. Schiller JS, Lucas JW, Peregoy JA. Summary health
statistics for U.S. adults: national health interview survey, 2011. Vital Health Stat 10 2012; (256): 1-218.
7. Silva VS, Petroski EL, Souza I, Silva DA. Prevalência e fatores associados ao excesso de peso em adultos no Brasil: um estudo de base populacional em todo território nacional. Rev Bras Cienc Esporte 2012; 34(3): 713-26.
8. Gigante DP, França GV, Sardinha LM, Iser BP, Meléndez GV. Variação temporal na prevalência de excesso de peso e obesidade em adultos: Brasil, 2006 a 2009. Rev Bras Epidemiol 2011; 14(Supl 1): 157-65. 9. Sá NN, Moura EC. Excesso de peso: determinantes sociodemográficos e comportamentais em adultos, Brasil, 2008. Cad Saúde Pública 2011; 27(7): 1380-92. 10. Rohrmann S, Steinbrecher A, Linseisen J, Hermann S, May A, Luan J, et al. The association of education with long-term weight change in the EPIC-PANACEA cohort. Eur J Clin Nutr 2012; 66(8): 957-63. 11. Greenacre MJ. Correspondence analysis. WIREs
Comp Stat 2010; 2(5): 613-9.
12. Instituto Brasileiro de Geograf ia e Estatística (IBGE). Pesquisa de orçamentos familiares 2008-2009: antropometria e estado nutricional de crianças, adolescentes e adultos no Brasil. Rio de Janeiro; 2010. 13. World Health Organization (WHO). Obesity:
preventing and managing the global epidemic. Report of a WHO Consultation on Obesity. Geneva; 1998 (WHO - Technical Report Series, 894). 14. Pestana MH, Gageiro JN. Análise de dados para
ciências sociais: a complementaridade do SPSS. 4 ed. Lisboa: Edições Silabo; 2005.
15. Statistical Package for the Social Sciences. IBM SPSS statistics 20 core system user’s guide. Chicago: SPSS; 2011.
16. Brasil. Ministério da Saúde. Secretaria de Vigilância em Saúde. Vigitel Brasil 2011: vigilância de fatores de risco e proteção para doenças crônicas por inquérito telefônico. Brasília: Ministério da Saúde; 2012. 132p. Disponível em: http://bvsms.saude.gov.br/bvs/publicacoes/ vigitel_brasil_2011_fatores_risco_doencas_cronicas. pdf (Acessado em 15 de fevereiro de 2014). 17. Jones-Smith JC, Gordon-Larsen P, Siddiqi A, Popkin
BM. Is the burden of overweight shifting to the poor across the globe? Time trends among women in 39 low- and middle-income countries (1991-2008). Int J Obes 2012; 36(8): 1114-20.
18. Levy RB, Claro RM, Mondini L, Sichieri R, Monteiro CA. Distribuição regional e socioeconômica da disponibilidade domiciliar de alimentos no Brasil em 2008-2009. Rev Saúde Pública 2012; 46(1): 6-15. 19. Santos JV, Gigante DP, Domingues MR. Prevalência de insegurança alimentar em Pelotas, Rio Grande do Sul, Brasil, e estado nutricional de indivíduos que vivem nessa condição. Cad Saúde Pública 2010; 26(1): 41-9.
20. Grosh ME, Glewwe P. The world bank’s living standars measurement study household surveys. J Econ Perspect 1998; 12(1): 187-96.
21. Maia GA. Relative income, inequality and subjective wellbeing: evidence for Brazil. Soc Indic Res 2013; 113: 1193-1204.
22. Attanasio OP. Expectations and perceptions in developing countries: their measurement and their use. Am Econ Rev 2009; 99(2): 87-92.
23. Mendonça CP, Anjos LA. Aspectos das práticas alimentares e da atividade física como determinantes do crescimento do sobrepeso-obesidade no Brasil. Cad Saúde Pública 2004; 20(3): 698-709.
24. Br asil. Ministério da Saúde. Secretaria de Vigilância em Saúde. Departamento de Análise de Situação de Saúde. Plano de ações estratégicas para o enfrentamento das doenças crônicas não tr ansmissíveis (DCNT) no Br asil 2011-2022. Brasília: Ministério da Saúde; 2011. 148p. ISBN 978-85-334-1831-8. Disponível em: http://www. fnde.gov.br/arquivos/category/116-alimentacao- escolar?download=7897:plano-de-acoes-estrategicas-para-o-enfrentamento-das-dcnt-no-brasil (Acessado em 15 de fevereiro de 2014).
25. Malta DC, Morais Neto OL, Silva Junior JB. Apresentação do plano de ações estratég icas para o enfrentamento das doenças crônicas não transmissíveis no Brasil, 2011 a 2022. Epidemiol Serv Saúde 2011; 20(4): 425-38.
26. Schmidt MI, Duncan BB, Silva GA, Menezes AM, Monteiro CA, Barreto SM, et al. Chronic non-communicable diseases in Brazil: burden and current challenges. Lancet 2011; 377(9781): 1949-61. 27. Silva DA, Peres KG, Boing AF, González-Chica
DA, Peres MA. Clustering of risk behaviors for chronic noncommunicable diseases: a population-based study in southern Brazil. Prev Med 2013; 56(1): 20-4.
28. Monteiro CA, Moura EC, Conde WL, Popk in BM. Socioeconomic status and obesity in adult populations of developing countries: a review. Bull World Health Organ 2004; 82(12): 940-6.
29. Wells JC, Mar phatia AA, Cole TJ, McCoy D. Associations of economic and gender inequality with global obesity prevalence: understanding the female excess. Soc Sci Med 2012; 75(3): 482-90. 30. Chor D, Faerstein E, Kaplan GA, Lynch JW, Lopes
31. Pearce N, Foliaki S, Sporle A, Cunningham C. Genetics, race, ethnicity, and health. BMJ 2004; 328(7447): 1070-2.
32. Chor D. Desigualdades em saúde no Brasil: é preciso rer raça. Cad Saúde Pública 2013; 29(7): 1272-5.
33. Nazroo JY. The structuring of ethnic inequalities in health: economic position, racial discrimination, and racism. Am J Public Health 2003; 93(2): 277-84.
34. Boing AC, Bertoldi AD, Peres KG. Socioeconomic inequalities in expenditures and income committed to the purchase of medicines in Southern Brazil. Rev Saúde Pública 2011; 45(5): 897-905.
35. Gordis L. Epidemiologia. 4 ed. Rio de Janeiro: Revinter; 2010.
Received on: 02/26/2014