Integrated model of the production of soluble microbial products
(SMP) and extracellular polymeric substances (EPS) in
anaerobic chemostats during transient conditions
S´ergio F. Aquino
a,∗, David C. Stuckey
baChemistry Department, Ouro Preto Federal University (UFOP), Campus Morro do Cruzeiro, Ouro Preto, MG 35.400.000, Brazil bDepartment of Chemical Engineering and Chemical Technology, Imperial College London, Prince Consort Road, London SW7 2BY, UK
Received 26 June 2006; received in revised form 10 April 2007; accepted 22 June 2007
Abstract
A model to predict the accumulation of soluble microbial products (SMP) in anaerobic chemostats during steady-state and transient conditions is presented in this paper. The model incorporates the concept of production and degradation of extracellular polymeric substances (EPS or ECP) as part of SMP, and was used to predict SMP production during hydraulic and organic shock load experiments in anaerobic continuously stirred tank reactors (CSTRs). For most variables the model predicted reasonably well the shock loads, and the best-fit values of the main parameters provided valuable information on the types of SMP that predominate under particular culture conditions. According to the model, during steady-state conditions∼58% of the SMP are utilization-associated products (UAP) whilst∼42% are biomass-associated products (BAP) of which∼7% are soluble EPS (sEPS). During the hydraulic and organic shock loads the importance of BAP and sEPS decreases and the UAP accounts for up to 95% of the SMP.
© 2007 Elsevier B.V. All rights reserved.
Keywords: Anaerobic digestion; Modelling; Shock loads; Soluble microbial products; Extracellular polymeric substances; Extracellular polymers
1. Introduction
It is well known that anaerobic reactors run under stressed (sub-optimal) conditions accumulate volatile fatty acids (VFA), and that VFAs mostly contribute to the residual soluble COD in the effluent under such conditions. On the other hand, under non-stressed conditions, there is no VFA accumulation and the effluent COD may be comprised of non-degraded feed material and soluble microbial products (SMP). Many researchers have shown that for anaerobic reactors fed on simple biodegradable feed like acetate or glucose, the SMP predominate in the effluent and dictate the soluble effluent COD. As a result, models that aim to predict the effluent COD in anaerobic and aerobic systems need to take into account the formation and degradation of SMP. Rittmann et al.[1]proposed a model to describe the impact of sludge retention time (SRT) and organic loading on effluent SMP. The model assumed that the kinetics of degradation of
∗Corresponding author. Tel.: +55 31 3559 1837; fax: +55 31 3559 1636.
E-mail addresses:[email protected](S.F. Aquino),
[email protected](D.C. Stuckey).
SMP originating from substrate utilization (UAP) and biomass decay (BAP) were the same, and Kuo et al.[2]used that model to predict the accumulation of SMP in anaerobic chemostats. Noguera et al.[3]used radiolabelled glucose and acetate to fol-low the production of UAP and BAP in anaerobic chemostats, and by fitting their proposed mathematical model to experi-mental data they showed the importance of SMP formation and degradation in anaerobic systems. This model showed that most of the SMP accumulation corresponded to BAP, which is related to endogenous decay and has slower degradation rates com-pared to UAP, and suggested that the decrease in acidogenic biomass was due to SMP formation rather than oxidation to carbon dioxide.
Barker and Stuckey [4] further developed the model of Noguera et al.[3]to account for the production of UAP and BAP from methanogenic microorganisms, as well as for the degrada-tion of UAP and BAP by acidogenic microorganisms. Barker and Stuckey[4]followed the degradation of different radiola-belled substrates in different reactors, and through the fitting of a mathematical model to radiolabelled data they obtained the best-fit for the parameters that represented the production (k1andk2)
and degradation (kuapandkbap) of UAP and BAP, respectively. 1369-703X/$ – see front matter © 2007 Elsevier B.V. All rights reserved.
From the experiments with different feed strengths, the best-fit suggested that the concentration of UAP increased with an increase inS0, whilst for BAP the opposite was observed. It was
also found that the first-order constant for BAP degradation was lower than that for UAP, indicating that BAPs are more difficult to degrade and that at steady-state they should form the bulk of the SMP. These authors also carried out experiments with different feed compositions in different systems (fill-and-draw reactor and CSTR), and showed that the production of SMP is a complex phenomenon, and that the type of SMP that dominates in any particular system depends not only on the strength of the feed, but also on the composition of the feed and the type of reactor.
In 2004 Laspidou and Rittmann[5,6]published a paper in which they propose a unified theory coupling the production and degradation of SMP with the formation of extracellular poly-meric substances (EPS or ECP) for aerobic systems. Amongst the many assumptions the authors had to make, the unified the-ory proposes that: (i) SMP and soluble EPS are identical in systems in which hydrolysis is not important; (ii) bound EPS are hydrolyzed to form BAP, and the authors consider this the only significant source of BAP; (iii) the formation of bound EPS is growth-associated, and is produced in direct proportion to substrate utilization.
One weakness of the unified theory is that it assumes that all soluble EPS is both UAP and BAP, in other words, soluble EPS and SMP are the same. Ramesh et al.[7]put the unified the-ory to test and compared the physicochemical characteristics of the SMP and soluble EPS harvested from different sludges, and concluded that the results obtained could not support the hypoth-esis that SMP is identical to the soluble EPS. Besides EPS and its hydrolysis products, other soluble intracellular components may end up in the bulk solution due to renewal and turnover of internal structures, cell lysis, or as a result of survival strategies adopted by microorganisms[8]. For instance, there is evidence in the literature that some SMP may be deliberately excreted to play a role in quorum sensing (cell-to-cell communication), to pump unwanted metals out of the cell and ensure homeostasis through efflux systems, and to scavenge scarce metal nutrients, as demonstrated in aerobic bacteria which excrete siderophores during an ‘iron crisis’[9–13].
The few available data on EPS modeling shows that different strategies have been adopted to model its accumulation and this is mainly due to a lack of data regarding the kinetics of EPS pro-duction and degradation. Kreft and Wimpenny[14]developed a model of biofilm growth and considered that EPS production was described by a growth rate dependent and an indepen-dent term, whose rates and yields were given by Robinson et al. [15]. Horn et al. [16] modeling aerobic biofilms consid-ered that the production of EPS was coupled to the growth of microorganisms. The authors adopted values of 1.4 gEPS/gXfor
YEPS and 0.34 d−1 forKD EPS, which are the yield coefficient
for EPS production and the rate of EPS degradation, respec-tively. In the model used by Kommedal et al.[17]to simulate EPS production in a chemostat, the authors did not consider the degradation of EPS, and growth and non-growth related specific formation rates of 0.18 gCEPS/gCcellh (∼4.3 d−1) and
0.03 h−1 (∼0.7 d−1) were estimated, respectively. In addition,
the authors found that the exogenous (production from glu-cose) and endogenous EPS yields were 0.77 gCEPS/gCgluand
0.79 gCEPS/gCcell, respectively. Laspidou and Rittmann [18]
also developed a model of biofilm density for aerobic sys-tems, building on their unified theory [5,6], and considered that EPS production was proportional to the substrate utiliza-tion rate (K= 0.18 mgCODEPS/mgCODsubstrate), and that EPS
degradation followed a first order decay (khyd= 0.17 d−1).
As SMP and EPS are microbially produced, and are not active cells, they represent a diversion of electrons and carbon that could otherwise be invested in cell yield and growth rate[5,6], hence ignoring SMP and EPS formation could lead to a general overestimation of true cellular growth rates. In addition, both SMP and the soluble component of EPS contribute to the residual soluble COD, and do, in many cases, set the lower limit for the effluent quality.
Therefore, the objective of this paper was to further develop the model proposed by Barker and Stuckey[4]by incorporating the concept of formation and degradation of EPS as suggested by Laspidou and Rittmann[5,6]in their unified theory. In this study the parameters obtained by Barker and Stuckey[4]for steady-state anaerobic chemostats fed on glucose (10 g/L) were used to predict both steady-state and the transient conditions under organic and hydraulic shock loads. The model output was then compared with experimental data to verify whether the model could satisfactorily predict the accumulation of SMP observed during both steady-state and shock loads.
1.1. Model development
The mathematical model proposed here differs from that pre-sented by Barker and Stuckey[4]in many ways. The proposed model incorporates the concept of formation and degradation of EPS, and allows for the quantification of the relationships between solid species (bacteria and bound EPS) and soluble components (UAP, BAP, soluble EPS, original substrate and intermediate products) during non-steady state conditions. In addition, it is assumed here that all electron donor utilization rates, i.e., the rate of utilization of glucose, acetate, UAP and BAP (rutsub,rutac,rutuapandrutbap) are based on Monod
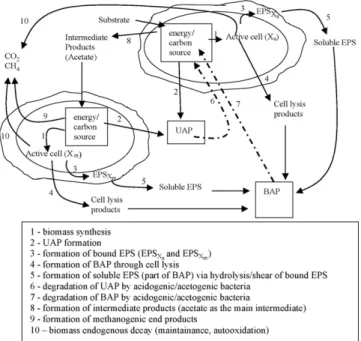
kinet-ics. The model is for a single completely mixed reactor in which concentrations of all species are uniform; hence mass transfer resistances are not included. The model concept and framework are presented inFigs. 1 and 2.
Fig. 1 shows that the substrate entering the acido-genic/acetogenic biomass (Xa) can take different paths. The
substrate is used for synthesis of biomass (path 1) which gen-erates VFAs (path 8) and UAP (path 2). The biomass in turn produces bound EPS (path 3), undergoes endogenous decay (path 10), and releases cell lysis products (path 4). Bound EPS may be stripped off the cell or hydrolysed contributing to BAP formation (path 5), and it is considered here that both soluble EPS and cell lysis products are the sources of BAP. This is the main conceptual difference between this model and the unified theory proposed by Laspidou and Rittmann
Fig. 1. Schematic of electron flow from original substrate.
theory, hydrolysis of EPS is considered the only source of BAP.
As far as methanogenesis is concerned, acetate is consid-ered the main intermediate formed and used by methanogenic biomass (Xm), which also produces UAP, bound EPS, cell lysis
products and the end products methane and carbon dioxide. Sim-ilarly to the models proposed by Laspidou and Rittmann[5,6],
Fig. 2. Structure of the model proposed in this study.
and by Barker and Stuckey[4], this model includes the recy-cling of UAP and BAP (path 6 and 7) through their utilization by acidogenic biomass. It has also been assumed that the degra-dation of UAP and BAP byXaproduces newXaand intermediate
products (IP), but does not lead to the production of new UAP or BAP, and this assumption was also employed by different research groups[4–6,19,20].
Fig. 2shows the structure of the model in terms of flow of electrons from the donor substrate (S). This structure is sim-ilar to that proposed by Barker and Stuckey [4] but it builds complexity since now the biomass (XaandXm) uses part of the
energy and carbon source to produce bound EPS which can be detached from the cell resulting in biomass loss and BAP for-mation. The model proposed is described by the following mass balance equations:
dS
dt = S0−S
θ −rutsubXa (1)
dIP
dt =[kacet(rutsub+rutuap+rutbap)]Xa−rutacetXm−
IP
θ (2)
dXa
dt =[rutsubYsub(1−k1−kacet)+rutuapYsmp(1−kacet)
+rutbapYsmp(1−kacet)]Xa−Xa
θ −bXa−k2Xa
−khydEPSXa (3)
dXm
dt =rutacYacet(1−k1)Xm− Xm
θ −bXm−k2Xm
−khydEPSXm (4)
dUAP
dt =(k1rutsubXa+k1rutacetXm)−
UAP
θ −rutuapXa (5)
dBAP
dt =k2Xa+k2Xm+khyd(EPSXa+EPSXb)−
BAP
θ
−rutbapXa (6)
dEPSXa
dt =kecpXa−
EPSXa
θ −khydEPSXa (7)
dEPSXm
dt =kecpXm−
EPSXm
θ −khydEPSXm (8)
Sol=S+IP+UAP+BAP (9)
XT=Xa+Xm (10)
solEPS=khyd(EPSXa+EPSXm) (11)
All rate utilization equations were formulated as a Monod type as shown by Eqs.(12)–(15).
rutsub= qsS
Ks+S (12)
rutacet= qIPIP
rutuap=
quapUAP
Kuap+UAP (14)
rutbap=
qbapBAP
Kbap+BAP (15)
It can be seen in Eqs. (3) and (4) that the yield (Ysub) of acidogenic/acetogenic biomass is decreased by a factor (1−k1−kacet) since part of the substrate electrons are diverted
to the production of UAP (k1) and intermediate products (kacet).
Similarly, the yield (Yacet) of methanogenic biomass is decreased
by a factor (1−k1) since part of substrate electrons are diverted
to UAP formation. For aerobic systems, Laspidou and Rittmann
[5,6]discounted the biomass yield by a factor (1−k1−kEPS)
because they considered EPS not to be a part of the ‘active biomass’, wherekEPS(MEPS/Mx) represents electron diversion
towards EPS production. In the model proposed here EPS is part of the biomass, and biomass loss occurs only when the EPS is sloughed off the cell, or hydrolysed to become soluble, and this factor is accounted for by adding the terms−kEPSEPSXa
and −kEPSEPSxm to Eqs. (3) and (4), respectively. Eqs. (7)
and (8) show that the formation of EPS was not considered to be proportional to the substrate utilization rate as proposed by the unified theory of Laspidou and Rittmann[5,6], instead EPS was considered to be a non-growth-associated product. If EPS production was proportional to the rate of substrate utiliza-tion, EPS concentration would be unrealistically high during the transient conditions of organic shock loads, and experimental data obtained in our laboratory shows that this was not the case
[21]. Since the kinetics of EPS hydrolysis are poorly character-ized, a simple but reasonably reliable approach which employs a first-order relationship with respect to EPS, where the first-order hydrolysis rate coefficient iskhyd(T−1), was used according to
the unified theory.
It was assumed here that the rate of intermediate products formation (kacet) from the degradation of UAP and BAP was the same as that from the degradation of the original substrate (Eq.(2)). In addition, it was assumed that the yield of acidogenic
biomass (Ysmp) from the utilization of UAP was the same as BAP, and thatYsmpwas different from the biomass yield resulting from
the utilization of the original substrate (Ysub). This assumption
was not employed by Barker and Stuckey [4]who considered the same acidogenic biomass yield for utilization of glucose, UAP and BAP, but was used by Laspidou and Rittmann[5,6].
To solve the model Eqs. (1)–(8) were discretized, and the solution marched forward in time with a small time stepδt. The discretization of the equations was accomplished based on the following scheme:
dA
dt =B (16)
and then
At =At−1+Bt−1δt (17)
whereAis a variable,Bthe time derivative ofA, andδt is the time step. The superscripttindicates the value of variableAat timet, andt−1 indicates the value of that variable at the previous time step, i.e.,t−δt.
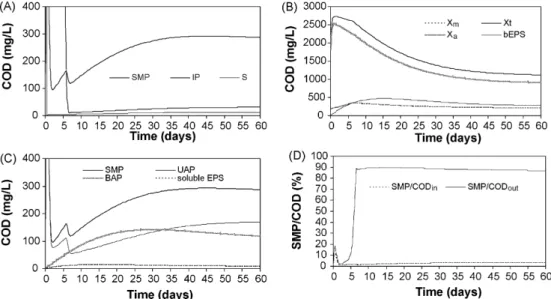
If the model is run for a long period of time with constant input, all species eventually achieve steady-state conditions (see
Fig. 3). For shorter times, or with changing input conditions, the model describes the system’s transient response. The discretized model equations were solved using a spreadsheet (Microsoft Excel) with a time step of 0.01 d. For the steady-state simulation the HRT was fixed at 15 d, the initial substrate concentration (S0) was 10 gCOD/L, and the model was run for 90 d (6 HRT’s).
For the organic shock load simulation the concentration ofS0
was suddenly changed so that an effluent concentration (S) of 4 gCOD/L was obtained, and during hydraulic shock simulation the HRT was made a variable and changed from 15 d to 7.5 d and then to 3 d. These conditions simulate the experiments with organic and hydraulic shock loads presented and discussed in Aquino and Stuckey[21].
Table 1
Parameter values for the mass-balance equations
Parameter Unit Value used Reported value/range Reference
qs mgCODsub/mgCODcelld 40 1.3–70.6 [27,3](anaerobic systems)
Ks mgCODsub/L 500 22.5–630
qIP mgCODIP/mgCODcelld 5.5 2.6–11.6
KIP mgCODIP/L 30 11–421
Ysub mgCODcell/mgCODsubstrate 0.2 0.14–0.22
Yacet mgCODcell/mgCODacetate 0.04 0.01–0.05
Ysmp mgCODcell/mgCODsmp 0.2 0.45 [5,6](aerobic systems)
quap mgCODuap/mgCODcelld 1.2 1.27
Kuap mgCODuap/L 500 100
qbap mgCODbap/mgCODcelld 0.03 0.07
Kbap mgCODbap/L 500 85
khyd d−1 0.03 0.17 [5,6](aerobic systems)
0.34 [16]
kEPS mgCODEPS/mgCODcelld 0.03 0.04 [15]
kacet mgCODacetate/mgCODglucose 0.5 0.55 [4](anaerobic systems)
b d−1 0.04 0.05
k2 d−1 0.0034 0.0034
k1 mgCODuap/mgCODsubstrate 0.2 0.29 [2](anaerobic systems)
0.097 [23](anaerobic systems)
2. Results and discussion
2.1. Steady-state condition
The model was first run using the parameter values reported in the literature as shown inTable 1. The parameter values were then adjusted slightly so that the model output during steady-state simulation (Fig. 3) fitted typical experimental data range, as presented inTable 2.
Data on the kinetics of SMP formation and degradation is scarce in the literature, especially for anaerobic systems. As a result, the values ofquap,qbap,Kuap andKbap used here were
based on those used by Laspidou and Rittmann[5,6]for aerobic systems.Table 1shows that the values ofKuap andKbap used here were higher than those used in the unified theory. However, the values used were the ones which better predicted the SMP concentration, and it is well known thatKsvalues for anaerobic
systems are much higher than for aerobic systems.
Table 2
Average concentration and range of main variables forS0= 10 gCOD/L in
anaer-obic chemostats operated at steady-state conditions Variable Average valuea
(mg/L)
Typical rangea (mg/L)
Estimated average valueb(mgCOD/L) Residual glucose N.D.c N.D.–20 12
SMP 300 200–400 290
VFA N.D. N.D.–50 30
VSS 1800 1500–2200 1150
Bound EPS 350 225–700 280
bEPS/VSS 0.3 0.2–0.4 0.33
aFrom experimental data reported elsewhere[8,21]. b According to simulation presented inFig. 3. cN.D.: not detected.
The value of kEPS was adopted so that the model yielded
at steady-state a ratio of bound EPS to biomass (bEPS/VSS) close to 0.3 which is the average ratio of protein-like EPS to biomass (bEPSp/VSS) obtained experimentally[21]. The value
ofkEPSthat best fitted the experimental data was 0.03 d−1, and
as can be seen in Table 1 this value was very close to that determined by Robinson et al.[15]. As far as the hydrolysis of EPS was concerned it was not possible to determine the value ofkhydexperimentally, and the value 0.17 used by
Laspi-dou and Rittmann[5,6]was first tried. This value proved to be too high since it resulted in highXmloss, and non-realistic IP
accumulation. The initial value was then reduced to 0.03 d−1
which yielded better fit for the variables presented inTable 2. The value of khyd used suggests that 3% of the bound EPS (or 1% of VSS) was daily hydrolysed or shorn off the cell matrix to produced soluble EPS, and this is consistent with the findings of Sheng et al. [22] who found that 1.38% of the VSS was released as soluble EPS after 180 min shear at
G= 800 s−1.
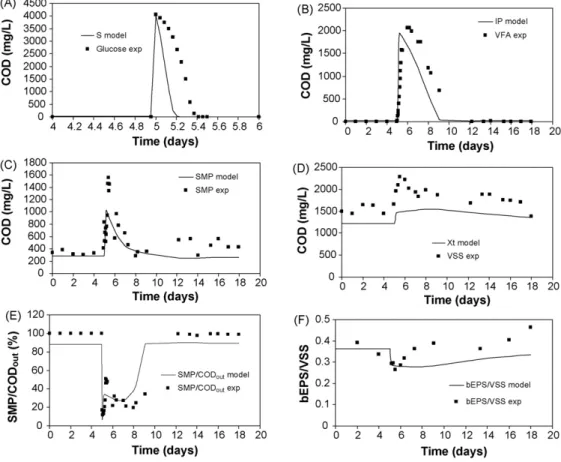
Fig. 4. Simulation of organic shock load by a sudden glucose spike on day 5 (continuous line) and experimental data (square dots).
According to the model, at steady steate, 58% of the SMP should be due to UAP and 42% to BAP, and this is also in agreement with other researchers[3,4]. The model suggests that bound EPS would constitute∼25% of the volatile suspended solids (VSS), and that∼3% of the bound EPS would lead to the formation of soluble EPS, and these are in agreement with experimental data[21]. According to the model, the soluble EPS would constitute ∼7% of the BAP and only 3% of the SMP since the main source of SMP would be products released into the bulk solution as a result of the metabolism of substrate (e.g. exoenzymes, siderophores, quorum sensing chemical), as well as from the renewal of cellular structures and cell aging (e.g. nucleic acids, structural proteins).
The model prediction for biomass concentration was not as good as for soluble components.Fig. 3 shows that at steady-state total biomass (as COD) should be ∼1200 mg/L, whilst
Table 2shows that the typical VSS concentration (as COD) is
∼25% higher. It should be emphasized that the model considers
Xt as the total amount of active biomass, and that the
param-eter VSS ‘catches’ everything that is suspended and volatile, i.e., active and inactive biomass as well as particulate matter (e.g. cell debris). Therefore, it is not surprising that the VSS concentration is actually higher than the concentration of Xt
predicted by the model. In addition, the model predicts a lower concentration of biomass at steady-state because the yield values (Ysub,YsmpandYacet) were decreased to account for the diver-sion of electrons for the formation of UAP and intermediate products.
2.2. Organic shock load
The organic shock load simulation was accomplished by suddenly increasing the initial concentration of substrate (S0)
so that an effluent substrate concentration (S) of∼4000 mg/L was obtained, hence reproducing the experimental conditions presented in Aquino and Stuckey [21]. Fig. 4 shows the model output and the experimental data presented in Aquino and Stuckey [21], for a glucose spike on day 5, and it can be seen that for most parameters the fitting was reasonably good. According to the model the concentration of glucose (S) should decrease rapidly and reach ∼8 mg/L just 5 h after the spike was made, and the experimental data shows that sub-strate degradation occurred at a slight slower rate (Fig. 4A). The concentration of acetate should increase to a maximum of ∼1900 mgCOD/L by 8 h after the spike, and then steadily
decrease to ∼9 mg/L after∼4 d, whilst the experimental data
shows that the VFAs reached its maximum (∼2000 mgCOD/L) 1 d after the spike, and took∼7 d to return to steady-state lev-els.
As far as SMP acumulation is concerned, the results pre-sented in Fig. 4C show that a very good fit was obtained for the model output and the experimental data, indicating that the adopted values for the parametersk1,k2,quapandqbap, which
are very sensitive, are in the right range. In a first simulation, the value ofk1(0.097 mgCODsmp/mgCODsubstrate) determined
by Barker [23]was used, however, this value underestimated the concentration of SMP during the shock loads, and the value that best fitted the model output to the experimental data was 0.20 mgCODsmp/mgCODsubstrate. This value is the same value
adopted by de Silva and Rittmann[19,20], Urbain et al.[24], Noguera et al.[3], Furumai and Rittmann[25], and Namkung and Rittmann[26]for aerobic systems, and is close to the value of 0.29 mgCODsmp/mgCODsubstrate adopted by Kuo et al.[2]
when modelling SMP formation in anaerobic systems.
Nevertheless, by adopting either k1 values, the increase in SMP over the glucose spike would be mainly due to the forma-tion of UAP, since its formaforma-tion was proporforma-tional to the rate of substrate utilization. This seems to agree with the experimental results presented in Aquino and Stuckey[21]which showed that the concentration of DNA was constant throughout the exper-iment, indicating that cell lysis was not enhanced during the organic shock load.
Since, in this model, the rate of EPS formation is more related to the biomass concentration than to substrate degradation, the amount of bound EPS did not increase significantly over the glucose spike. One simulation was made by assuming that EPS is a growth-associated product, hence considering the formation of EPS to be proportional to the rate of substrate utilization.
In such a scenario the concentration of bound EPS reached the staggering figure of 6200 mgEPSCOD/L in the first 3 h after the
glucose spike was made, and then decreased to normal levels after another 3 h. If bound EPS is modelled with a biomass-associated term, like in the model proposed here, EPS formation is equivalent to a ‘decay’ mechanism, which means that a very high rate of EPS formation would require a high concentration of biomass.
Laspidou and Rittmann[5,6]opted for modelling EPS as a growth-associated product because there was experimental evi-dence in the literature suggesting that a large accumulation of EPS was possible even when the biomass accumulation was low. However, this is a controversial issue since there are other researchers, also quoted by Laspidou and Rittmann[5,6], who showed that EPS did not increase in periods of higher substrate utilization.
The results presented in Aquino and Stuckey[21]and repro-duced inFig. 4show that EPS production before and after the glucose spike was not statistically different. Although we did not measure EPS production in the first 6 h after the glucose spike, the concentration of 6200 mgEPSCOD/L seems to be
unrealisti-cally high since it is three times the amount of biomass present in the system just before the spike was made.
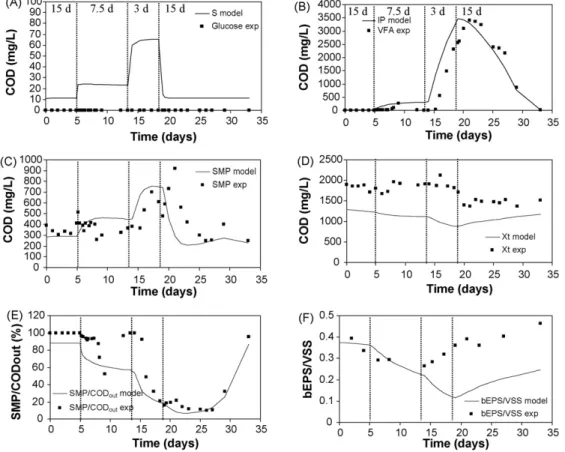
2.3. Hydraulic shock load
The hydraulic shock load was simulated by changing the hydraulic retention time (HRT) from 15 d to 7.5 d on day 5, and then to 3 d on day 14. An HRT of 3 d was held from day
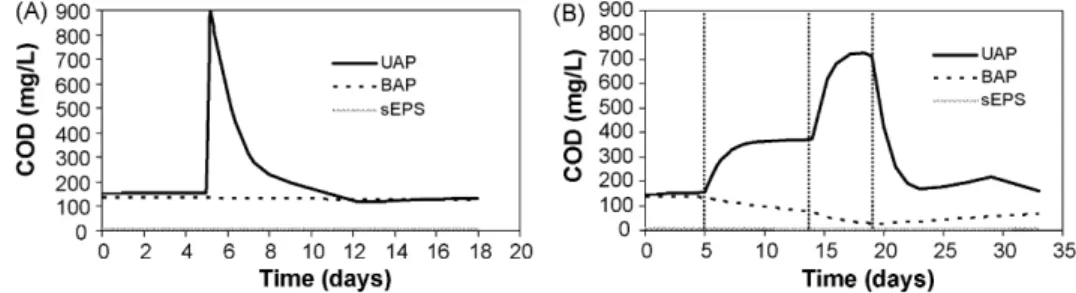
Fig. 6. Model output of the composition of SMP during the organic (A) and hydraulic (B) shock loads.
14 to day 20 and then set back to the original value, repro-ducing the experimental conditions presented in Aquino and Stuckey [21]. According to the model the reduction of HRT resulted in an increase in the concentration of original substrate (Fig. 5A), however, the experimental data shows that no glu-cose was detected in the effluent throughout the experiment. Although the model overestimated the glucose degradation dur-ing the glucose spike, the contrary was observed when the HRT was reduced. As discussed before, the model parameters were set so that the output could represent steady-state data, mainly for SMP accumulation. The discrepancies observed during the transient conditions may indicate metabolism shift or some kind of biomass limitation during the stressful conditions caused by the shock loads.
Fig. 5B shows that a relatively good fit was obtained for VFA accumulation. As discussed before, the model seemed to overes-timate the degradation of VFA after the glucose spike, however, during the hydraulic shock load simulation the predicted VFA concentration was actually higher than measured data, especially during the period the HRT was 3 h. As discussed in Aquino and Stuckey[21], during shock loads there is a shift in glucose metabolism leading to a significant accumulation of propionate and butyrate, and this is not accounted for in the model proposed here. More advanced models, that incorporate the concept of population dynamics and microbial diversity, need to be develop, and molecular biology techniques are, for sure, valuable tools that could be used regarding this issue.
According to the model the SMP concentration should increase from ∼290 mg/L to 470 mg/L after the HRT was changed from 15 d to 7.5 d, and such an increase would be mainly due to UAP formation because of the higher substrate utilization rates resulting from the increase in the feed flow. As discussed in Aquino and Stuckey[21], there was no statistically signifi-cant difference between the production of SMP at 15 d and 7.5 d HRT, butFig. 5C shows that a further decrease in the HRT to 3 d resulted in a significant increase in SMP production, and this correlated well with the experimental data. According to the model such an increase would be mainly due to the formation of UAP, since the concentration of BAP would actually decrease because of biomass washout.
As discussed in Aquino and Stuckey[21], the profile of total DNA in the bulk solution intriguingly suggested an increase in cell lysis during the period when the HRT was 3 d. If cell lysis did occur, then the accumulation of BAP might have been more important than the model suggests. It is important to point
out that the model proposed here is similar to that proposed by Laspidou and Rittmann[5,6]and by Barker and Stuckey[4]in the sense that it does not account for the enhanced accumula-tion of SMP observed during stressful condiaccumula-tions. The model proposed here assumes that the biomass has ideal conditions in terms of nutrients, pH and other growth conditions to metabolise the substrate, so that any SMP production resulting from stress-ful conditions (low pHs, nutrient deficiency or the presence of toxic compounds), would not be accounted for. It is not straight-forward to correlate an eventual induced production of SMP or EPS with non-ideal environmental conditions, or with the con-centration of stressing agents, and new models that address these issues need to be developed and tested accordingly.
As far as the biomass and bound EPS concentration are concerned, the model output was not well correlated with exper-imental data. According to the model the reduction of the HRT from 15 d to 3 d should lead to a great biomass loss due to washout, and this would obviously cause a steady decrease in bound EPS.Fig. 5(D and E) shows that biomass loss was actu-ally lower than predicted in this may indicate that biomass yield (Y) is actually higher than the value adopted in this model.
Fig. 6summarizes what was discussed in the previous sec-tions and shows the distribution of SMP during the shock loads. It can be seen that during both shock loads, most of SMP should be due to UAP resulting from the increased organic load and substrate metabolism. The amount of BAP should be impor-tant only at steady-state conditions, and the soluble EPS should account for no more than 5% of the SMP during all conditions simulated. In contrast to the unified theory proposed by Laspi-dou and Rittmann[5,6], the production and hydrolysis of EPS did not dictate SMP accumulation, and this agrees with chro-matographic results [7] which showed that EPS hydrolysates do not accumulate in well operated systems. Nevertheless, new experiments need to be devised in order to determine the rate of EPS hydrolysis, and to accurately determine the contribution of soluble EPS to SMP.
3. Conclusion
the complex anaerobic sequential process had to be ignored, and assumptions made, the model satisfactorily predicted typi-cal steady-state conditions, and for many variables it described well the transient conditions during organic and hydraulic shock loads.
In general the simulations resulted in a satisfactory repre-sentation of the data presented in Aquino and Stuckey[21], and predicted that at steady-state the majority of the residual COD is indeed due to SMP. Under such conditions UAP should comprise
∼58% of the SMP, whilst soluble EPS should represent∼7% of BAP. Because of their slow degradation rates, BAP should be important only at steady-state, while UAP should determine the SMP production when the rate of substrate degradation is high, as observed during the transient conditions under organic and hydraulic shock loads.
The mathematical model presented here was useful to quan-tify the relationships between different soluble species, i.e. original substrate, intermediate VFAs, SMP and soluble EPS during steady-state and transient conditions. In addition, it may serve as a basis for the further development of more complex models. For instance, it would be desirable to be able to develop mathematical models to account for the enhanced accumulation of SMP observed during both stressful conditions (nutrient defi-ciency, toxicity, osmotic shocks), and also in reactors with a high accumulation of biomass, such as membrane bioreactors (MBR s), blanket sludge reactors (UASB) and baffled reactors (ABR), where the SRT is much greater than the HRT.
References
[1] B.E. Rittmann, W. Bae, E. Namkung, C.-J. Lu, A critical evaluation of microbial product formation in biological processes., Water Sci. Technol. 19 (Rio) (1987) 517–528.
[2] W.C. Kuo, M.A. Sneve, G.P. Parkin, Formation of soluble microbial prod-ucts during anaerobic treatment, Water Environ. Res. 68 (1996) 279– 285.
[3] D.R. Noguera, N. Araki, B.E. Rittmann, Soluble microbial products (SMP) in anaerobic chemostats, Biotechnol. Bioeng. 44 (1994) 1040– 1047.
[4] D.J. Barker, D.C. Stuckey, Modelling of soluble microbial products in anaerobic digestion: the effect of feed strength and composition, Water Environ. Res. 73 (2) (2001) 173–184.
[5] C.S. Laspidou, B.E. Rittmann, A unified theory for extracellular polymeric substances, soluble microbial products, and active and inert biomass, Water Res. 36 (2002) 2711–2720.
[6] C.S. Laspidou, B.E. Rittmann, Non-steady state modeling of extracellu-lar polymeric substances, soluble microbial products and active and inert biomass, Water Res. 36 (2002) 1983–1992.
[7] A. Ramesh, L. Duu-Jong, S.G. Hong, Soluble microbial products (SMP) and soluble extracellular polymeric substances (EPS) from wastewater sludge, Environ. Biotechnol. 73 (2006) 219–225.
[8] S.F. Aquino, D.C. Stuckey, Soluble microbial product formation in anaer-obic chemostats in the presence of toxic compounds, Water Res. 38 (2) (2004) 255–266.
[9] G.P. Parkin, P.L. McCarty, Production of soluble organic nitrogen during activated sludge treatment, J. WPCF 53 (1) (1981) 99–112.
[10] D.H. Nies, Microbial heavy-metal resistance, Appl. Microbiol. Biotechnol. 51 (1999) 730–750.
[11] N. Mirimanoff, K.J. Wilkinson, Regulation of Zn accumulation by a freshwater gram-positive bacterium (Rhodococcus opacus), Environ. Sci. Technol. 34 (2000) 616–622.
[12] J.W. Hastings, E.P. Greenberg, Quorum Sensing: the explanation of a curi-ous phenomenon reveals a common characteristic of bacteria, J. Bacteriol. 181 (9) (1999) 2667–2668.
[13] C. Fuqua, E.P. Greenberg, Cell-to-cell communication inEscherichia coli
andSalmonella typhimurium: they may be taking, but who’s listening? Proc. Natl. Acad. Sci. 95 (1998) 6571–6572.
[14] J.U. Kreft, J.W.T. Wimpenny, Effect of EPS on biofilm structure and func-tion as revealed by an individual-based model of biofilm growth, Water Sci. Technol. 43 (6) (2001) 135–141.
[15] J.A. Robinson, M.G. Trulear, W.G. Characklis, Cellular reproduction and extracellular polymer formation byPseudomonas aeruginosain continuous culture, Biotechnol. Bioeng. 26 (1984) 1409–1417.
[16] H. Horn, T.R. Neu, M. Wulkow, Modelling the structure and function of extracellular polymeric substances in biofilms with new numerical tech-niques, Water Sci. Technol. 43 (6) (2001) 121–127.
[17] R. Kommedal, R. Bakke, J. Dockery, P. Stoodley, Modelling production of extracellular polymeric substances in aPseudomonas aeruginosa chemo-stat culture, Water Sci. Technol. 43 (6) (2001) 129–134.
[18] C.S. Laspidou, B.E. Rittmann, Modeling the development of biofilm den-sity includign active bacteria, inert biomass, and extracellular polymeric substances, Water Res. 38 (2004) 3349–3361.
[19] V. de Silva, B.E. Rittmann, Interpreting the response to loading changes in a mixed-culture completely stirred tank reactor, Water Environ. Res. 72 (5) (2000) 566–573.
[20] V. de Silva, B.E. Rittmann, Nonsteady-state modeling of multispecies activated-sludge processes, Water Environ. Res. 72 (5) (2000) 554–565. [21] S.F. Aquino, D.C. Stuckey, The effect of organic and hydraulic shock
loads on the production of soluble microbial products (SMP) in anaerobic digesters, Water Environ. Res. 76 (6) (2004) 2628–2636.
[22] G.-P. Sheng, H.-Q. Yu, X.-Y. Li, Stability of sludge flocs under shear conditions: roles of extracellular polymeric substances (EPS), Biotechnol. Bioeng. 93 (6) (2006) 1095–1102.
[23] Barker, D.J., 1999. Characterisation, production and removal of residual soluble chemical oxygen demand (COD) from anaerobic treatment efflu-ents. Ph.D. Thesis. Department of Chemical Engineering and Chemical Technology, Imperial College, London, pp. 244.
[24] V. Urbain, B. Mobarry, V. de Silva, D.A. Stahl, B.E. Rittmann, J. Manem, Integration of performance, molecular biology and modeling to describe the activated sludge process, Water Sci. Technol. 37 (4/5) (1998) 223–229. [25] H. Furumai, B.E. Rittmann, Advanced modeling of mixed populations of heterotrophs and nitrifiers considering the formation and exchange of soluble microbial products, Water Sci. Technol. 26 (3/4) (1992) 493–502. [26] E. Namkung, B.E. Rittmann, Soluble microbial products (SMP) formation
kinetics by biofilms, Water Res. 20 (6) (1986) 795–806.