INTRODUCTION
A growing interest in genotoxicity caused by environ-mental pollutants has led to the development of several bio-logical tests for detecting and identifying genotoxicants in the air, water and soil. Fish provide a suitable model for monitoring aquatic genotoxicity and wastewater quality be-cause of their ability to metabolize xenobiotics and accu-mulate pollutants. A micronucleus assay has been used suc-cessfully in several species (De Flora et al., 1993; Al-Sabti and Metcalfe, 1995; Minissi et al., 1996).
Development of a biomonitoring program in fish re-quires knowledge of the kinetics of the erythrocyte life cycle and of micronucleus induction. The frequency of spontaneous and induced micronucleus formation over time needs to be determined in order to confirm the use-fulness of the species for this assay. In bony fishes, the main hemopoietic site is the head kidney; however, eryth-rocyte micronuclei assays from peripheral blood have been elected by different authors as the main endpoint (Kligerman et al., 1975; Hooftman and De Raat, 1982).
We investigated the intra- and inter-specific sensi-tivities of three species of fish, Tilapia rendalli, Oreo-chromis niloticus and Cyprinus carpio, to micronucleus induction following exposure to the clastogens bleomycin (BLM), cyclophosphamide (CP), 5-fluorouracil (5-FU) and mitomycin C (MMC). The kinetics of the erythrocyte cell cycles were also studied in the presence of cytocha-lasin-B (Cyto-B).
MATERIAL AND METHODS
Fish treatments and micronucleus test
The quality of Lake Paranoá water is continuously monitored by the local water-treatment company, and in-cludes measurement of the levels of oxygen, nitrogen, phosphorus and chlorophyll-a, to evaluate the degree of eutrophication. There are no chemical industries or ag-ricultural fields around the lake, an artificial eutrophic tropical reservoir. Specimens of the three fish species were caught at the same sites and were acclimatized in the laboratory for 10 days in 500-l tanks of dechlori-nated tap water aerated continuously at 20 ± 2oC and pH = 7.0. Peripheral blood samples were obtained from the gills and immediately smeared. After drying for 24 h at room temperature, the smears were fixed in methanol for 15 min and stained with Giemsa. Three thousand erythrocytes were examined per fish in coded slides. Control blood samples were obtained before each treat-ment and 2, 7, 14 and 30 days after a single intra-abdomi-nal injection of the mutagen. The maximum tolerated dose for each species was determined in preliminary experi-ments. In another series of experiments, blood samples were collected from the same fish at 0, 2, 5, 8, 12 and 15 days after a single injection of cytochalasin B (50 µg/kg body weight, b.w.). For each treatment period, five thou-sand erythrocytes were scored to determine the binucle-ate/mononucleate ratio.
Variability in micronucleus induction with different mutagens
applied to several species of fish
Abstract
Fish are often used for screening genotoxicity of water. For such programs, a knowledge of the sensitivity to clastogens, spontaneous micronucleus frequency and cell cycle kinetics of the target tissue is necessary. To investigate the pattern of inter-specific sensitivity to micronucleus induction three species of fish, Tilapia rendalli, Oreochromis niloticus and Cyprinus carpio,were exposed to the clastogens bleomycin (BLM), cyclophosphamide (CP), 5-fluorouracil (5-FU), and mitomycin C (MMC). The binucleate/mononucleate ratio in peripheral erythrocytes exposed to cytochalasin B was also used to evaluate the time-dependent response of micronucleus formation during hematopoesis in the kidney and the micronucleus peak in peripheral erythrocytes. Micronucleus frequencies induced by CP were significantly greater than their respective controls for the three fish species throughout all treatment periods. During the whole evaluation period (30 days) CP was also the most effective clastogen. In general, until the 14th day of evaluation period T.
rendalii was the most sensitive species to clastogens. No difference in micronucleus frequencies among species was observed in the
4th evaluation (at the 30th day). A micronucleus peak was observed at the 7th day after treatment. After the 14th day the frequencies were stabilized. The cytochalasin B experiment was carried out to demonstrate that micronuclei induced in the young kidney erythro-cyte cells were detected in the circulating blood 2-4 days later.
Cesar Koppe Grisolia1 and Célia Maria Torres Cordeiro2
1Departamento de Genética e Morfologia, Instituto de Ciências Biológicas, Universidade de Brasília, 70910-900 Brasília,
DF, Brasil. Send correspondence to C.K.G. Fax: +55-61-273-4942. E-mail [email protected]
2Centro Nacional de Pesquisa de Recursos Genéticos e Biotecnologia, Embrapa/Cenargen. SAIN - Parque Rural,
Chemicals tested
BLM (12.5 mg/kg b.w.) are glycopeptide antibiotics isolated from Streptomyces verticillus and are routinely used in cancer chemotherapy. These compounds exert their genotoxic effect by causing oxidative damage to DNA, which in turn leads to gene mutations, chromosomal aber-rations and aneuploidy (Vig and Lewis, 1978; Povirk and Austin, 1991). CP (Enduxan, 20 mg/kg b.w.) has been wi-dely used as a positive control because of its alkylating activity. CP itself is not genotoxic but undergoes com-plex metabolic activation by mixed function oxidases which results in genotoxic metabolites (Colvin and Chabner, 1990). 5-FU (Roche, 2.5 mg/kg b.w.), an antine-oplastic drug which acts as a pyrimidine antagonist, inter-feres with pyrimidine-nucleotide synthesis and is incor-porated into RNA. 5-FU acts directly or indirectly on en-zymes in the early steps of DNA synthesis. At low doses, 5-FU increases the rate of mouse bone marrow micro-nucleus formation after 24 h, through a mechanism involv-ing metabolic inhibition (Maier and Schmid, 1976). MMC (Bristol, 1 mg/kg b.w.) has DNA cross-linking and alkylat-ing activity, and is water-soluble with a relatively short bio-logical half-life in rats (Kerpel-Fronius et al., 1988). Cyto-B (Sigma, 50 µg/kg b.w.) inhibits cytoplasmic cleavage with-out preventing mitosis, resulting in binucleated and multi-nucleated cells. All test compounds were dosed at maxi-mum tolerated dose (MTD), previously determined. At the MTD toxic signals were observed such as feed refuse, scale losses and alteration in the swim behavior and motility.
Statistical analysis
A multivariate ANOVA was used to compare the ef-fects of chemicals and species on micronucleus frequen-cies over four-treatment periods. Micronucleus frequency at each evaluation period, micronucleus frequency differ-ences between successive evaluation periods and micro-nucleus frequency differences between treatments and their controls were submitted to univariate analysis of vari-ance to test for the effects of chemicals, species and their interactions. These analyses were carried out using SAS/ PROC GLM. Multiple comparisons among means were obtained employing t-adjusted P values (SAS/PROC MULTTEST). A log transformation was applied to micro-nucleus frequencies before analysis, in order to stabilize the variance. The results were presented in the original scale after transforming them back to frequencies. The back transformed value obtained for differences between successive treatment periods was denominated “increase rate” (IR) - the mean ratio between micronucleus fre-quency of successive evaluation periods. For the differ-ences between treatments and controls the value obtained for back transformation to original scale was denominated “increase rate control” (IRC),the mean ratio between mi-cronucleus frequency of each treatment and its control.
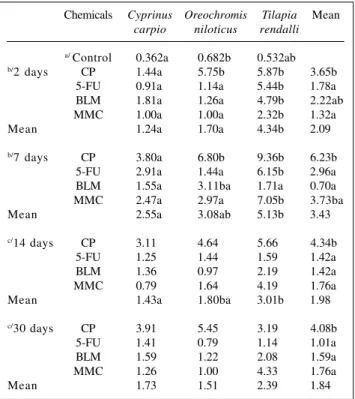
Table II - Means of micronuclei at 2, 7, 14 and 30 days after CP, 5-FU, BLM and MMC treatment.
Chemicals Cyprinus Oreochromis Tilapia Mean
carpio niloticus rendalli
a/ Control 0.362a 0.682b 0.532ab b/2 days CP 1.44a 5.75b 5.87b 3.65b
5-FU 0.91a 1.14a 5.44b 1.78a BLM 1.81a 1.26a 4.79b 2.22ab MMC 1.00a 1.00a 2.32b 1.32a
Mean 1.24a 1.70a 4.34b 2.09
b/7 days CP 3.80a 6.80b 9.36b 6.23b
5-FU 2.91a 1.44a 6.15b 2.96a BLM 1.55a 3.11ba 1.71a 0.70a MMC 2.47a 2.97a 7.05b 3.73ba
Mean 2.55a 3.08ab 5.13b 3.43
c/14 days CP 3.11 4.64 5.66 4.34b
5-FU 1.25 1.44 1.59 1.42a
BLM 1.36 0.97 2.19 1.42a
MMC 0.79 1.64 4.19 1.76a
Mean 1.43a 1.80ba 3.01b 1.98
c/30 days CP 3.91 5.45 3.19 4.08b
5-FU 1.41 0.79 1.14 1.01a
BLM 1.59 1.22 2.08 1.59a
MMC 1.26 1.00 4.33 1.76a
Mean 1.73 1.51 2.39 1.84
a/Means of species within control followed by the same letter are not
significantly different (adjusted t-test, α - set < 0.05). b/At 2 and 7 days:
means in the same column and treatment period time followed by the same letter are not significantly different (adjusted t-test, α - set < 0.05). Comparison between means of species (line) were considered in a previ-ous set. c/At 14 and 30 days comparisons between chemicals within
cies were not done because the interactions between chemicals and spe-cies were not significant. For abbreviations, see legend to Table I.
Table I - Increase rate of micronucleus frequencies in three fish especies (treatment/control), IRC.
Chemicals Cyprinus Oreochromis Tilapia
carpio niloticus rendalli
02 days CP 5.3133* 14.6880* 17.1707*
5-FU 2.4662 1.2599 11.7174*
BLM 4.9324* 1.5874 7.6059*
MMC 2.1554 1.2599 2.9240
07 days CP 14.0208* 17.3801* 27.3616* 5-FU 7.9105* 1.5874 13.2453*
BLM 4.2172 3.9149 2.7144
MMC 5.3133 3.7444 8.8875*
14 days CP 11.4471* 11.8563* 16.5554*
5-FU 3.4200 1.5874 3.4200
BLM 3.6840 1.2164 3.4760
MMC 1.7100 2.0606 5.2776
30 days CP 14.4225* 13.9391* 9.3313*
5-FU 3.1072 0.8736 2.4662
BLM 4.3089 1.5326 3.3019
MMC 2.7144 1.2599 5.4570
* IRCstatistically different 1 (α set < 0.10). CP = Cyclophosphamide, 5-FU
RESULTS
CP induced the highest IR
C values in all treatment periods (Table I). After the 14th day the IR
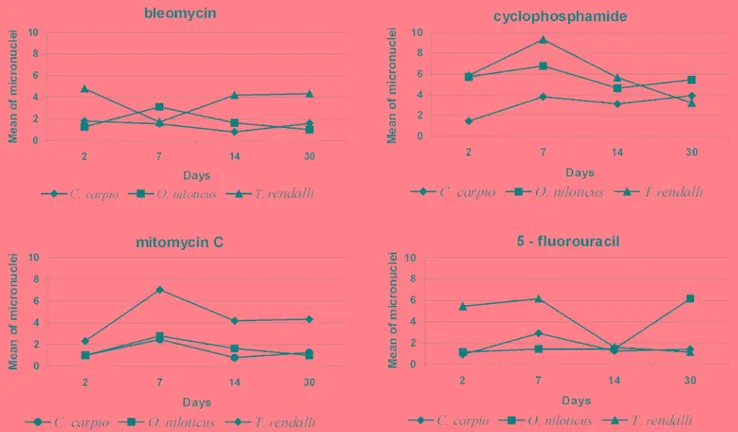
C of all clastogens was stabilized for all the species studied. Spon-taneous micronucleus frequencies (controls) among the three species were significantly different (P = 0.038, Table II). Different patterns of micronucleus frequencies were identified for the combinations of clastogens and species throughout the evaluation periods (Pillas’s trace criterion, P = 0.0463). There were significant differences among species and chemicals (P < 0.05), except at the 30th day when no significant difference among species was detected (Table II and Figure 1). The multiple comparisons for each evaluation period demonstrated significantly that, in gen-eral, CP was more effective as a clastogen than MMC, 5-FU and BLM. Comparing fish species, T. rendalli was the most sensitive, while C. carpio was the most resistant. At the 7th day (second evaluation time), when there was a micronucleus frequency peak, T. rendalli showed a sig-nificantly inferior sensitivity to BLM. The peak effect of this drug to T. rendalli occurred during the earlier evalua-tion period, at the 2nd day after treatment. Another way of analyzing the clastogen behavior for the three species is to examine the IR variation during the successive evalua-tion periods. The mean IR from 7 to 2 days was 1.64 ± 0.21. MMC had an IR significantly superior to 1 during
this interval while BLM remained stable (Table III). The overall IR from 14 to 7 was 0.58 (IC95%: 0.42-0.80), sig-nificantly inferior to 1 (P = 0.0005). This indicates a ten-dency towards decrease of micronucleus frequencies be-tween these later two evaluation periods while the earlier two showed a tendency towards increase. IR in the inter-val from 14 to 7 did not change significantly with species or clastogens. The overall IR from 30 to 14 days was 0.93, which is not significantly different from 1 (P = 0.6954), and this means that no tendency towards a decrease in mi-cronucleus frequency was detected during this interval.
The time required for the appearance of binucleated erythrocytes in peripheral blood was two days and the maxi-mum binucleate/mononucleate ratio was observed 5-12 days after treatment with Cyto-B. Comparing each period of treatment, the highest increase in binucleate/mono-nucleate ratio was observed from two up to five days post-treatment with Cyto-B. The time lag in the micronuclei in-duction and increasing binucleate/mononucleate ratio in peripheral erythrocytes were coincident (Figure 2).
DISCUSSION
Bahari et al. (1994) showed a linear, dose-depen-dent increase in erythrocyte micronuclei two to four days after γ-radiation and mitomycin-C treatment in the cat-fish Clarias gariepinus. Similarly, Hooftman and De Raat
(1982) reported a dose- and time-dependent increase in micronuclei in erythrocytes from the eastern mudminnow Umbra pygmaea treated with ethyl methanesulfonate. Time-dependent responses have also been observed in amphib-ians exposed to radiation (Siboulet et al., 1984; Fernandez et al., 1993). We demonstrated that related species, such as T. rendalli and O. niloticus, give different responses to genotoxic agents. According to clastogen and the species studied, the frequency of micronuclei may suffer impor-tant variations. If the kidney is the main hemopoietic tissue in fish, and if micronuclei are formed during hematopoesis, then the time required for the completion of the mitotic cycle in erythrocytes must previously be estimated. We found that the peak occurrence of micronuclei was corre-lated with the life cycle of these cells in the kidney. There was a period of latency between treatment and subsequent micronucleus peak in peripheral blood erythrocytes; the latter coincided with the maximum binucleate erythrocyte ratio (Figure 1). Al-Sabti and Metcalfe (1995) demonstrated that the maximal micronucleus induction normally occurred one to five days post-exposure, which agrees with our re-sults. An analysis of the rate of increase in micronuclei in-dicates the best time to obtain blood samples, a critical consideration when using fish for genotoxic biomonitoring.
Rates of cell proliferation probably vary widely, depending upon the fish species, the target tissue and environmental conditions. Treatment with Cyto-B produced a similar pat-tern of binucleate/mononucleate erythrocyte ratio to those seen in the micronuclei induced by the clastogens during the first 15 days post-treatment. The Cyto-B experiment demonstrated that micronuclei induced in young kidney erythrocyte cells will be detected in the circulating blood 2-4 days later and this time lag varies according to species and clastogens. The time-dependent response occurred with all clastogens in the three fish species and must be deter-mined before extensive use of a given species.
ACKNOWLEDGMENTS
The authors thank Ornil Claro Costa for technical assis-tance. This work was supported by the Fundação de Apoio à Pesquisa do Distrito Federal (FAP-DF).
RESUMO
Este estudo fez uma avaliação da indução de micronúcleos em eritrócitos de sangue periférico de peixes Tilapia rendalli,
Oreochromis niloticus e Cyprinus carpio após o tratamento com
mitomicina C, ciclofosfamida, 5-fluorouracil e bleomicina. Foram colhidas amostras periódicas de sangue com 2, 7, 14 e 30 dias após o tratamento único. Os tratamentos com citocalasina B tive-ram como objetivo analisar as proporções entre células binu-cleadas/mononucleadas nos diferentes períodos de tratamento, para a comparação com os picos de micronúcleos entre as dife-rentes espécies, uma vez que o orgão hematopoiético nos peixes é o rim cefálico e o sangue analisado é de origem periférica, o que nos dá uma noção do tempo do ciclo celular dos eritrócitos. A análise das taxas de aumento das freqüências de micronúcleos ao longo do tempo demonstrou que do 2° ao 7°dias elas foram crescentes, decresceram ao 14° dia e mantiveram-se estáveis até
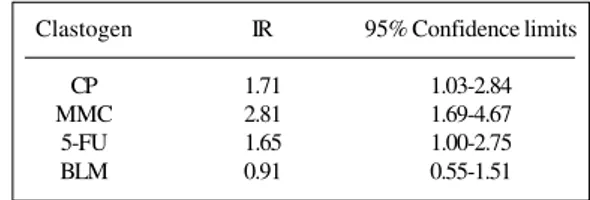
Table III - Increasing rates (IR) of micronucleus frequencies from 2-7 days after treatment with CP, MMC, 5-FU and BLM. Clastogen IR 95% Confidence limits
CP 1.71 1.03-2.84
MMC 2.81 1.69-4.67
5-FU 1.65 1.00-2.75
BLM 0.91 0.55-1.51
For abbreviations, see legend to Table I.
Figure 2 - Rate of binucleate to mononucleate erythrocytes 0-15 days after treatment with cytochalasin-B.
T. rendalli
O. niloticus
ao 30°. Os 4 compostos químicos aumentaram significativamente as freqüências de micronúcleos ao longo de todo o período de tratamento, sendo que a ciclofosfamida e a mitomicina C foram as mais efetivas. A T. rendalli foi a espécie mais sensível a todos os tratamentos, enquanto que C. carpio foi a mais resistente. Entre 2 e 7 dias pós-tratamento observaram-se as maiores induções de micronúcleos. A partir do 14° dia de tratamento as freqüências de micronúcleos tenderam a diminuir e as diferenças entre as espécies não foram significativas.
REFERENCES
Al-Sabti, K. and Metcalfe, C.D. (1995). Fish micronuclei for assessing genotoxicity in water. Mutat. Res. 323: 121-135.
Bahari, I.B., Noor, F.M. and Daud, N.M. (1994). Micronucleated erythro-cytes as an assay to assess actions by physical and chemical genotoxic agents in Clarias gariepinus.Mutat. Res. 313: 1-5.
Colvin, M. and Chabner, B.A. (1990). Alkylating agents. In: Cancer Che-motherapy: Principles and Practices (Chabner, B.A. and Collins, J.M., eds.). J.B. Lippencott, Philadelphia, pp. 276-313.
De Flora, S., Vigario, L., D’Agostini, F., Camoirano, A., Bagnasco, M., Bennicelli, C., Melodia, F. and Arillo, A. (1993). Multiple genotoxicity biomarkers in fish exposed in situ to polluted river water. Mutat. Res. 319: 167-177.
Fernandez, M., L’Haridon, J., Gauthier, L. and Zoll-Moreux, C. (1993). Amphibian micronucleus test(s): a simple and reliable method for
evalu-ating in vivo genotoxic effects of freshwater pollutants and radiation. Initial assessment. Mutat. Res. 292: 83-99.
Hooftman, N.R. and De Raat, W.K. (1982). Induction of nuclear abnor-malities (micronuclei) in the peripheral blood erythrocytes of the east-ern mudminnow Umbra pygmaea by ethyl methanesulphonate. Mutat. Res. 104: 147-152.
Kerpel-Fronius, S., Verwey, J., Stumman, M., Kanyar, B., Lelieveld, P. and Pinedo, H.M. (1988). Pharmacokinetics and toxicity of mitomycin in rodents, given alone, in combination, or after induction of microso-mal drug metabolism. Cancer Chemother. Pharmacol. 22: 104-108. Kligerman, A.D., Bloom, S.E. and Howell, W.M. (1975). Umbra limi, a
model for the study of chromosome aberrations in fishes. Mutat. Res.
31: 225-233.
Maier, P. and Schmid, W. (1976). Ten model mutagens evaluated by the micronucleus test. Mutat. Res. 40: 325-328.
Minissi, S., Ciccotti, E. and Rissoni, M. (1996). Micronucleus test in erythrocytes of Barbus plebejus (Teleostei, Pices) from two natural environments: a bioassay for the in situ detection of mutagens in freshwater. Mutat. Res. 343: 121-135.
Povirk, L.F. and Austin, M.J.F. (1991). Genotoxicity of bleomycin. Mutat. Res. 257: 127-143.
Siboulet, R., Grinfeld, P. and Jaylet, A. (1984). Micronuclei in red blood cells of the newt Pleurodeles watl Michah: induction with X-rays and chemicals. Mutat. Res. 125: 275-281.
Vig, B.K. and Lewis, R. (1978). Genetic toxicology of bleomycin. Mutat. Res.55: 121-145.