Inheritance and identification of molecular markers associated
with spot blotch (
Cochliobolus sativus
L.) resistance
through microsatellites analysis in barley
Tyagi Kuldeep
1, Rajiv Nandan
1, Uttam Kumar
1, Lal Chand Prasad
1, Ramesh Chand
2and Arun Kumar Joshi
11
Department of Genetics and Plant Breeding, Institute of Agricultural Sciences, Banaras
Hindu University, Varanasi, UP, India.
2Department of Mycology and Plant Pathology, Institute of Agricultural Sciences,
Banaras Hindu University, Varanasi, UP, India.
Abstract
Spot blotch resistant (IBON 18) and susceptible (RD 2508) lines were crossed to investigate inheritance of resis-tance and to identify simple sequence repeats (SSRs) associated with resisresis-tance. F1resistance was intermediate
and suggested additive nature of inheritance. Three additive genes was noted in the distribution of F3, F4and F5
gen-erations. In F6and F6-7, the quantitative and qualitative approaches also suggested the control of three resistance
genes. The parents and the RILs (F6/F6-7) were grown in four environments and spot blotch severity recorded. Forty
five SSR primers, specific for chromosomes 1 (7H) and 5 (1H), were applied. Of these, 12 were polymorphic between the parents, and between the resistant and susceptible bulks. Three markers BMS 32, BMS 90 and HVCMA showed association with resistance, which was further confirmed through selective genotyping. The co-segregation data on the molecular markers (BMS 32, BMS 90 and HVCMA) and spot blotch severity on 173 RILs was analyzed by single marker linear regression approach. Significant regression suggested linkage among BMS 32, BMS 90 and HVCMA and the three resistant genes (designated asRcs-qtl-5H-1, Rcs-qtl-5H-2 and Rcs-qtl-1H-1.) respectively. These markers explained 28%, 19% and 12% of variation respectively, for spot blotch resistance among the RILs.
Key words: microsatellite markers, molecular marker, spot blotch,Cochliobolus sativus, barley.
Received: September 12, 2007; Accepted: April 15, 2008.
Introduction
Spot blotch of barley caused byCochliobolus sativus
(Ito and kurib.) Drechsl. ex DasturBipolaris sorokiniana
(Sacc in sorok.) Shoem.Helminthosporium sativumPamm, King and Bakke is responsible for yield and quality reduc-tions in many parts of the world (Pieninget al., 1976; Nut-teret al., 1985). In susceptible barley cultivars, average yield losses of 16%-33% have been reported (Clark, 1979). In Syria, Van Leur (1991) reported a 40% yield loss in bar-ley due to infection byC. sativus.Low resistance to spot blotch in barley cultivars of south Asia causes significant recurring losses to small farmers and recently breeding for spot blotch resistance has assumed significant importance in south Asia.
Several attempts have been made to control spot blotch but no single control measure has been successful.
Hence similar to wheat, an integrated approach (Joshi and Chand, 2002) with host resistance as a major component is considered necessary. Inheritance studies on resistance to spot blotch of barley are available but the nature of inheri-tance still appears to be debatable. Reports indicate pres-ence of monogenic (Arny, 1951; Wilcoxsonet al., 1990) and polygenic (Griffee, 1925; Steffensonet al., 1996) types of resistance. Steffensonet al.(1996) reported that in bar-ley, different genes control spot blotch resistance at seed-ling and adult stage. Reports on inheritance of spot blotch resistance using South Asian barley lines is completely lacking. Barley lines with higher levels of resistance are difficult to achieve owing to the influence of environment on disease development (Wilcoxsonet al., 1990; Bailey and Wolf, 1994) and the quantitative nature of resistance (Cohenet al., 1969; Kutcheret al., 1994). A clear informa-tion regarding inheritance of spot blotch resistance is needed to design suitable strategies to enhance resistance of barley cultivars.
The conventional methods to select resistance geno-types by inoculating plants with spot blotch isolates are
Send correspondence to Arun K. Joshi. Department of Genetics and Plant Breeding, Institute of Agricultural Sciences, Banaras Hindu University, 221 005 Varanasi, UP, India. E-mail: joshi_vns@ yahoo.co.in.
time consuming, laborious, destructive and are not always reliable because of substantial environmental influence. The number of lines to phenotype can be substantially re-duced (and so the cost) by identifying markers that are closely linked to the gene of interest. However, in spot blotch of barley, it would be important to confirm that the progeny of a new cross between the resistant (linked to the marker) and the new susceptible genotype has (in addition to the marker) the resistance phenotype due to possible epistatic or modifying effects (Bilgicet al., 2005). Poly-merase chain reaction (PCR) based markers, such as micro-satellite (SSRs) (Condit and Hubble, 1991), can reduce the cost of identifying genetic markers and allow large scale genotyping of individuals at any location. The process of identification of molecular markers linked with traits of in-terest has become more efficient by the use of Bulk segregant analysis (BSA) (Michelmoreet al., 1991).
Development of genotype resistant to spot blotch poses serious challenge to the barley breeders. A clear in-formation regarding the inheritance of spot blotch resis-tance and availability of molecular markers linked to the resistance genes are needed to design suitable strategies to enhance resistance of barley cultivars. Reports on the inher-itance and molecular markers of spot blotch resistance in South Asian genotypes is almost non-existent. Therefore, the present study was initiated with two objectives: (i) in-vestigate the inheritance pattern of resistance in the barley accession IBON 18 to spot blotch, and (ii) identify SSR markers associated with spot blotch resistance in the F6
population of a cross between IBON 18 and RD 2508 to as-sist barley breeding in South Asia for greater reas-sistance against spot blotch.
Materials and Methods
Plant materials and development of segregating progenies
Single plant selections of resistant (IBON 18) and susceptible (RD 2508) genotypes were multiplied and used in the cross. Resistant parent IBON 18 (a germplasm line introduced form ICARDA/CIMMYT) was crossed with the susceptible RD 2508 (RD 2035/PG 90) which is otherwise higher yielding with good agronomic performance. Parents and F1 progenies were evaluated for resistance to spot
blotch under an induced epiphytotic obtained in the field at Varanasi (North Eastern Plains Zone, India, 25.2° N and 83.0° E) in the year 1999-00 and 2003-04. Plots (ca.60-70 plants) of F1generation consisted of two 2-m rows seeded
25 cm apart with 30 cm between plots. The susceptible bar-ley genotype RD 2503 was planted in albar-leys and borders, two weeks before sowing the experiment to enhance the spread of inoculums.
The progenies of the cross were advanced to the F3,
F4, F5and F6generations following the method described
by Singh and Rajaram (1991) and Joshiet al.(2002, 2004a)
where a random plant in each generation from each line was harvested for advancing the generation. F3lines were
ob-tained from around 200 randomly chosen space planted F2
plants grown in the summer crop season (2000) at the off-season nursery, Wellington, Tamil Nadu. Half of the seeds of the F2plants were advanced to obtain F3
genera-tion. The F3lines at the off-season nursery were harvested
to obtain F4families. The F3and F4lines were evaluated
un-der induced epiphytotic conditions during crop season 2001-02. In both generations, plots of each line consisted of a single 3 m row with 30 cm space between the plots and maintaining around 40-50 plants per row. Sowing was done in the second fortnight of November in order to allow the post anthesis stage to coincide with the relatively warm temperature occurring in March which favors disease de-velopment and spread.
In the next crop season (2002-03), 183 progeny lines of F5were evaluated under induced epiphytotic conditions
at Varanasi. In the F6generation, 173 progeny lines were
planted in two dates of sowings (third week of November and first week of December) in the year 2003-04. Other de-tails of planting were as described for F3, F4and F5
genera-tions. However, based on the number of days to maturity of the RILs observed in the F5generation, differential sowings
were carried out in the F6generation to synchronize the
growth stages between progeny rows, thereby attempting to nullify the growth stage x disease severity interaction. To further confirm the number of genes controlling resistance, the F6-7RILs were also evaluated in the year 2004-2005 in
two dates of sowings (third week of November and first week of December) following the approach described for previous generation.
Inoculation procedure and disease assessment
Spot blotch disease was induced by inoculating spreader rows and a pure culture of the locally most aggres-sive isolates of B. Sorokiniana (Isolates No. RCBHUBR1857) identified at this center. The isolate was multiplied on barley grains and spores were harvested in water (Misra, 1973). A spore suspension (approximately 104spores/mL) containing the surfactant Tween 20, was uniformly sprayed by using a hand held atomizer at three stages: tillering, flag leaf emergence and anthesis during the evening hours (Joshiet al., 2007b, c).
scoring date, growth stage was also recorded. Area Under Disease Progress Curve (AUDPC) estimates were based on the plot disease severities at different growth stages (van der Plank, 1963). The lines that showed AUDPC (< 500) were considered resistant and the lines that showed AUDPC (> 2000) were considered susceptible.
Following formula was used for calculating AUDPC.
AUDPC= ⎡ + × −
⎣⎢
⎤ ⎦⎥
+ + =
∑
Yi Yi ti tii n
1 1
1 2
( )
whereYi= disease level at timeti;t(i+ 1)-ti= time (days)
be-tween two disease scores;n = number of dates on which spot blotch was recorded.
Estimation of number of genes
To estimate the number of segregating genes in each cross, F3lines were grouped in to three classes, (i)
homozy-gous for the resistant parental response, (ii) homozyhomozy-gous for the susceptible parental response, and (iii) segregating or homozygous different than the parents. In the F4, F5and
F6/F6-7 generations, lines were grouped into three classes
(Singh and Rajaram, 1991, Joshiet al., 2007a) by merging the last two categories. The observed and expected distribu-tions of F3,F4,F5and F6/F6-7lines in disease severity
catego-ries were tested byχ2analysis. To confirm the number of genes obtained by χ2 analysis, a quantitative approach (Wright, 1968) was also followed in the F6/F6-7generations.
In this method the number of genes controlling spot blotch resistance was verified using the formula (Singh et al., 1995; Joshi et al., 2007a), n = (GR)2/R x σ2g, where
n = minimum number of genes, GR = genotypic range,
σ2
g= genetic variance of the segregating generation, and the factor R = 4.13 in case of F6generation. GR was
esti-mated by two different methods (Singh and Rajaram, 1995; Joshiet al., 2007a). In the first method GR was the range of segregating generation line means, while in the second method GR was the range of segregating generation line means multiplied by heritability. Heritability was used in the second method to eliminate the influence of environ-ment on the expression of the disease severity (Mulitze and Baker, 1995).
Analysis of variance was conducted following split plot analysis of the data of four environments of two years (2003-04 and 2004-05) using SAS software (SAS Institute, 1997) to determine the differences for spot blotch severities among the F6/F6-7lines. Narrow sense heritability was
esti-mated using the entry mean formula given by Fehr (1987):
h2 = genotypic variance/phenotypic variance; genotypic and phenotypic variances were estimated from the ANOVA table following Comstock and Moll (1963). Al-though the genetic variance used in the formula to calculate heritability was the total genetic variance of the segregating generation lines, the heritability estimate was considered to be the narrow-sense because dominance variance was
neg-ligible and the confounding effect of the additive-by-addi-tive genetic variance could be included in the heritability estimate at the level of inbreeding (Singh and Rajaram, 1995). Phenotypic correlation coefficients of spot blotch severity and AUDPC values among four environments (6 pair-wise combinations) were also calculated using SAS software (SAS, 1997).
DNA isolation and bulked segregant analysis
Leaves were harvested from 15 days old seedlings from the RILs (F6) in the icebox from the field. Genomic
DNA was isolated from the seedling leaves using CTAB method described by Saghai-Maroof et al.(1984). DNA concentration was determined through spectrometer and quality of DNA was checked by agarose gel electrophoresis (0.8%). After quantification, the DNA was diluted to a con-centration of 30 ng/µL using Tris-EDTA buffer (10 mM Tris, 0.1 mM EDTA, pH 8). DNA from the six to seven most resistant RILs which had disease severity lower than 25% and AUDPC > 500 was pooled at an equal amount to create the resistant DNA bulk. Care was taken to ensure that these RILs possessed similar days to maturity and plant height to avoid the effect of plant growth stages on proper phenotyping of the lines. Similarly, DNA from the six to seven most susceptible RILs, which has disease severity higher than 85% and AUDPC greater than 2000, was pooled to create the susceptible bulk.
SSR markers
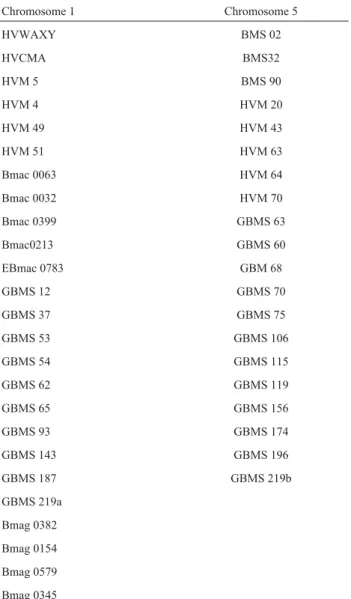
Forty five SSRs primers (Table 1), based on the map of Becker and Heun (1995), Liuet al.(1996), Ramsayet al.
(2000) and Liet al.(2003), specific for 1H and 5H were used to screen for polymorphism between IBON 18 and RD 2508. Then the polymorphic markers were screened against the two DNA bulks. When the markers were found poly-morphic between DNA bulks, they were screened with all 173 lines (F6generation) of the `IBON 18 x RD2508’.
PCR reactions were performed as described by Ram-sayet al.(2000) with minor modifications such that the re-action volume was reduced to 18µL. DNA amplification was carried out in a 20 well thermocycler (TECHNE, Eng-land) each containing 50-100 ng template DNA, 0.2µM of each primer, 200µM of each of the dNTPs, 2.5 mM MgCl2,
1X PCR buffer and 1U ofTaqDNA Polymerase (Banga-lore Genei, India; The composition for 10x buffer was = 100 mM Tris-HCl, pH 8.3 at 25 °C; 500 mM KCl; 15 mM MgCl2; 0.5% (vol) Tween 20). The temperature
re-gression was performed following the method of Nelson (1997). The marker allelesr(spot blotch resistant allele) was coded 1 and the alleless(spot blotch susceptible allele) were coded 0 for conducting regression analysis. Genetic linkage analysis for SSRs was performed using
MAP-MAKER ver. 3.0 (Landeret al., 1987), with a LOD score of 3.0. Recombination frequencies were transformed to centiMorgans (cM) using the formula of Kosambi (1944).
Results
Inheritance of spot blotch
Compared with parents, the spot blotch scores of the F1(Table 2) appeared to be intermediate, indicating the
ab-sence of dominance for the genes governing resistance. This was also suggested by the AUDPC distribution (Fig-ure 1), which has been suggested to be an appropriate pa-rameter to distinguish the resistance of genotypes (van der Plank, 1963). The F3-line distributions in cross (Figure 1,
Table 3) indicated that resistance genes interacted in an ad-ditive manner. Very few lines showed a response similar to the resistant or the susceptible parent. In the F3progeny
rows, the test of goodness of fit suggested segregation at three independent loci (Table 3). As with the F3generation,
lines having responses similar to the parental types were found to be at a low frequency in the F4, F5as well as the F6
generations (Table 3). For these generations, these test for goodness of fit also indicated the presence of three genes for resistance (Table 3).
The heritability for the spot blotch severity in the four environments (F6date I, F6date II, F6-7date I and F6-7date
II) was moderately high and ranged from 76-83%. The number of resistance genes obtained from the quantitative analysis (Table 4) showed that gene numbers in the resis-tant genotype were close to three as obtained in the test of goodness of fit. The distribution of F6lines (Figure 2) also
suggested the role of polygenes in controlling resistance.
ANOVA analysis
The mean disease severity (%) of RILs ranged from 5.0% (Environment I and IV) to 96.8% (Environment I) showing large phenotypic variation in the population. Analysis of variance showed significant variation among the RILs. RIL x environment interaction was also found significant. The six possible combinations of the ranks of RILs in four environments arranged in pairs displayed posi-tive and significant correlations (0.648-0.903) for both
dis-Table 1- List of primers for chromosome 1 and 5 of barley used for
find-ing SSR markers for spot blotch resistance.
Chromosome 1 Chromosome 5
HVWAXY BMS 02
HVCMA BMS32
HVM 5 BMS 90
HVM 4 HVM 20
HVM 49 HVM 43
HVM 51 HVM 63
Bmac 0063 HVM 64
Bmac 0032 HVM 70
Bmac 0399 GBMS 63
Bmac0213 GBMS 60
EBmac 0783 GBM 68
GBMS 12 GBMS 70
GBMS 37 GBMS 75
GBMS 53 GBMS 106
GBMS 54 GBMS 115
GBMS 62 GBMS 119
GBMS 65 GBMS 156
GBMS 93 GBMS 174
GBMS 143 GBMS 196
GBMS 187 GBMS 219b
GBMS 219a
Bmag 0382
Bmag 0154
Bmag 0579
Bmag 0345
Table 2- Mean percentage spot blotch scores and AUDPC with standard errors for resistant and susceptible parents, as well as F1used in the genetic
anal-ysis.
Parents and F1
Mean disease response to spot blotch
% Severitya AUDPC
2000-01 2004-05 2000-01 2004-05
IBON18 10.67±3.9 12.92±4.7 2520.51±83.5 2410.3±93.1
RD5208 89.16±4.2 92.58±4.2 463.75±83.7 418.7±88.8
IBON 18 (R) X RD 2508 (S) 45.67±2.9 49.17±3.0 1148.7±55.5 1212.5±63.7
a
ease severity (%) and AUDPC values. The most resistant and susceptible lines correlated more highly than the inter-mediate lines. For the two extremes,i.e., the six most resis-tant and six most susceptible RILs which were used to constitute the bulk, the correlation in the six environments ranged from 0.93 to 0.96.
SSR analysis
Out of a total of 45 SSRs primer pairs used, 12 (26.6%) primer pairs detected reproducible polymorphism
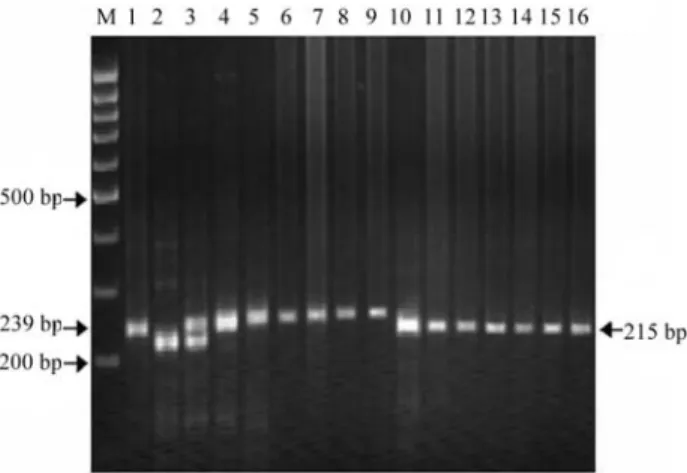
between the parental genotypes. Bulked segregant analysis (Michelmoreet al., 1991) using these 12 primers showed that three markers, BMS 32, BMS 90 and HVCMA dis-played an amplification profile characteristic of resistant and susceptible parent in the corresponding bulks. This suggested an association of these markers with spot blotch resistance. Selective genotyping (Lander and Botstein, 1989) of individual RI lines belonging to the two bulks sug-gested an association between the BMS 32, BMS 90 and HVCMA markers and spot blotch resistance (Figures 3 and 4). The three SSRs markers had the following primer se-quence: BMS 32: forward primer GGATCAAAGTCCG GCTAG, reverse primer TGCGGGCCTCATACTGAC, BMS 90: forward primer ACATCAACCCTCCTGCTC, reverse primer CCGCACATAGTGGTTACATC, and HVCMA: forward primer GCCTCGGTTTGGACATATA AAG, reverse primer GTAAAGCAAATGTTGAGCAA CG (Ramsayet al., 2000 and Liet al., 2003). Subsequently, all (173) F6RI lines were genotyped using the three
mark-ers and data on segregation of the marker were recorded for conducting QTL analysis.
The regression of spot blotch severity on the BMS 32, BMS 90 and HVCMA markers were highly significant in-dicating close association between molecular markers and resistance for spot blotch (designated as Rcs-qtl-5H-1,
Rcs-qtl-5H-2andRcs-qtl-1H-1). The two genes ( Rcs-qtl-5H-1, Rcs-qtl-5H-2) were located on chromosome 5H,
Figure 1- Distribution of AUDPC of F3lines of the cross resistant (IBON
18) x susceptible (RD 2508) for spot blotch severity in barley.
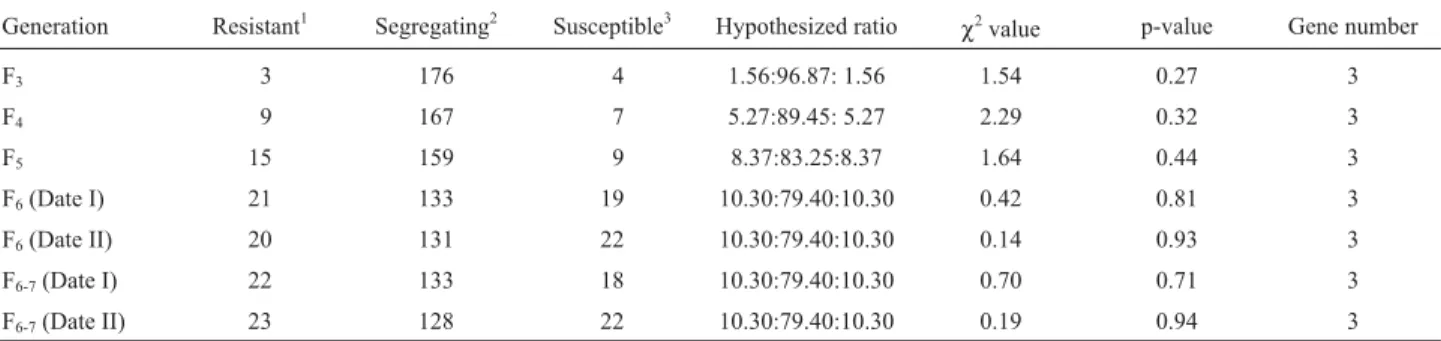
Table 3- Goodness of fit of ratios observed and hypothesized class frequencies for F3, F4, F5,F6and F6-7lines from the cross between resistant (IBON 18) and susceptible (RD 2508) parents.
Generation Resistant1 Segregating2 Susceptible3 Hypothesized ratio
χ2
value p-value Gene number
F3 3 176 4 1.56:96.87: 1.56 1.54 0.27 3
F4 9 167 7 5.27:89.45: 5.27 2.29 0.32 3
F5 15 159 9 8.37:83.25:8.37 1.64 0.44 3
F6(Date I) 21 133 19 10.30:79.40:10.30 0.42 0.81 3
F6(Date II) 20 131 22 10.30:79.40:10.30 0.14 0.93 3
F6-7(Date I) 22 133 18 10.30:79.40:10.30 0.70 0.71 3
F6-7(Date II) 23 128 22 10.30:79.40:10.30 0.19 0.94 3
1
Homozygous for resistant parental type (homozygous for all the resistant alleles.2Segregating or homozygous for disease levels different from parental level.3Homozygous for susceptible parental type (homozygous lacking all the resistant alleles).
Table 4- Estimate of maximum number of effective genes contributing to spot blotch resistance in crosses between IBON18 x RD 2508 using Wright’s
(1968) formula modified for F6generation (Singhet al., 1995) in four environments.
Generation Environment Number of genes
Disease severity (%) AUDPC
Method I Method II Method I Method II
F6(Date I) 2003-04 (I) 3.98 2.39 4.27 2.67
F6(Date II) 2003-04 (II) 3.74 2.27 4.14 2.79
F6-7(Date I) 2004-05 (I) 4.31 2.52 4.61 2.93
where as the third one (Rcs-qtl-1H-1)was on chromosome 1H (Table 5). The R2-value suggested that the SSRs mark-ers linked with BMS 32, BMS 90 and HVCMA contributed to 28%, 18% and 12% of the total variation present for spot blotch resistance among the RILs.
The SSRs marker BMS32, HVCMA and BMS 90 were found to be linked with a distance of 4.4 cM, 8.4 cM and 12.5 cM, respectively from the resistance locus with a LOD score of 18.49, 12.57 and 8.97 respectively (Table 5), suggesting a good linkage between molecular markers and spot blotch resistance gene.
Discussion
The chi square ratios in the four segregating genera-tions suggested that the spot blotch resistance in the barley line IBON 18 was under the control of probably three genes. In case of single gene control, the F3progeny lines
are expected to follow a ratio of 1 : 2 : 1. This ratio would be 3 : 2 : 3 and 7 : 2 : 7 in the F4and F5generations,
respec-tively. As the genes having additive effects will increase, the number of progeny rows similar to parental lines are ex-pected to decrease (Singh and Rajaram, 1995; Joshiet al., 2007a). In all the segregating generations (F3, F4, F5and F6)
of cross IBON 18 X RD 2508, lines with a disease response equivalent to the parental types were in very low frequen-cies, and the lines were clearly not distributed in a mono-genic (1 : 2 : 1) ratio. The test of goodness of fit suggested segregation at three independent loci.
The inheritance study suggested the role of three genes in controlling resistance to spot blotch in the line IBON 18. The distributions of RILs (F6and F6-7) for spot
blotch AUDPC also suggested polygenic control. Some of the previous studies concerning inheritance of resistance to spot blotch disease of barley also indicated the control by many genes (Griffee 1925; Cohenet al., 1969; Kutcheret al., 1994). However, the quantitative nature of resistance to spot blotch has not been reported in Indian barley cultivars and lines.
Figure 2- Distribution of AUDPC of F6lines of a cross between resistant
(IBON 18) and susceptible (RD 2508) for spot blotch during 2003-2004.
Figure 3- Selective genotyping of RILs (representing extreme groups) for
spot blotch resistance in barley using BMS 32 SSRs primer; Lane M = 100-bp ladder marker; 1 = Resistant parent (IBON18); 2 = Suscepti-ble parent (RD2508); 3-9 = RILs with low disease severity; 10-16 = RILs with high disease severity.
Figure 4- Selective genotyping of RILs (representing extreme groups) for
spot blotch resistance in barley using BMS 90 SSRs primer; Lane M = 100-bp ladder marker; 1 = Resistant parent (IBON18); 2 = Suscepti-ble parent (RD2508); 3 = Resistant bulk; 4 = SusceptiSuscepti-ble bulk; 5-9 = RILs with low disease severity; 10-16 = RILs with high disease severity.
Table 5- SSRs markers, alleles, chromosome locations and map distance.
Marker Map distance (cM) LOD Chromosome Annealing temp. (°C) Reference
BMS 32 4.4 18.89 5 (1H) 60 Steinet al., (2007)
HVCMA 8.4 12.57 1 (7H) 60 Steinet al., (2007)
The number of effective genes conferring resistance to spot blotch disease in the cross, calculated from the mod-ified formula of Wright (1968), using severity (%) as well as the AUDPC values, showed almost similar gene num-bers in the four environments. The gene numnum-bers were in-fluenced by the measure of the genotypic range used in the formula (Singh and Rajaram, 1995). However, the correc-tion of phenotypic range of the F6lines by multiplying with
heritability (method II) suggested a gene number close to three. In other words, the results were quite similar to that obtained by usingχ2analyses. Hence, it appeared that prob-ably three additive genes are responsible for spot blotch re-sistance in the barley IBON 18 investigated in the present study. An earlier report (Hosfordet al., 1975) suggested polygenic control for spot blotch resistance in which three and four genes were found to control virulence ofC. sativus
on barley genotypes NDB112 and Larker, respectively. In a study, Griffee (1925) also inferred that three unlinked genes control resistance to spot blotch at the adult plant stage. Baileyet al.(1988) reported a polygenic control for resistance to common root rot caused by Cochliobolus sativus.
The heritability estimates for the F6and F6-7
genera-tions of the cross were moderately high and ranged from 0.77 to 0.83 across four environments. In an earlier study (Kutcheret al., 1994), the estimate of heritability with re-spect to spot blotch resistance were reported to be moder-ate. The spot blotch severity increases with plant maturation (Joshiet al., 2002). Therefore, for best evalua-tion of resistance of a line or plant, comparison must be done when the disease has just reached maximum severity in the susceptible parent (Joshiet al., 2004b). The additive interactions of only a few (three) genes observed in this study suggested that spot blotch resistance in barley can be realized by growing fairly large segregating populations and selecting for low scoring genotypes at appropriate growth stages under high inoculum pressure. Further, since only a few additive genes were able to display substantially high level of resistance and heritability was moderately high, effective selection could be applied in the early segre-gation generations as well. For further gains, strong selec-tion pressure could be applied in advanced generaselec-tions when high homozygosity has been achieved, as also sug-gested in case of wheat by Joshiet al., (2004a) for spot blotch and Singh and Rajaram (1995) for resistance to scab.
SSR analysis
In barley, molecular mapping for different traits has been an area of active research, which led to the identifica-tion of many markers for several important traits (Stef-fensonet al., 1996; Tuberosa and Salvi, 2004; Bilgicet al., 2005; Steinet al., 2007). In this study we found that with a large population and precise phenotypic characterization it is possible to detect molecular markers for a trait such as spot blotch resistance that is under polygenic control, even
though some loci display large effects. The SSR markers had significant additive effects on spot blotch resistance and appear to display major effect consistently over four environments. These markers were named as QTLs Rcs-qtl-5H-1,Rcs-qtl-5H- 2andRcs-qtl-7H-1.The two QTLs,
Rcs-qtl-5H-1,Rcs-qtl-5H- 2contributed to around 28.40% and 18.97% variation respectively and were located on chromosome 5 (1H). The other QTLRcs-qtl-7H-1, contrib-uting 12.52% variation, was found to be located on chro-mosome 1(7H). Thus,Rcs-qtl-5H-1 contributing 28.40% variation and which was located on chromosome 5 (1H) ap-peared to be a major SSR marker. Steffensonet al.(1996) also reported the presence of the largest QTLs for spot blotch resistance in chromosome 5 (1H). A second QTL having lesser magnitude was also mapped in the chromo-some 1H. Using microsatellite markers, Mesfin et al.
(2003) identified three QTLs forFusariumhead blight on chromosome 2 (2H). We mapped microsatellite markers (BMS32, BMS 90 and HVCMA) linked to the spot blotch resistance genes at map distances of 4.4 cM, 12.5 cM and 8.4 cM, respectively. The two QTLs on chromosome 5 (1H) obtained in the present study contributed a total phenotypic variation of 47.37% (Rcs-qtl-5H-1 = 28.40% and Rcs-qtl-5H-2 = 18.97%) for spot blotch resistance. Since the association of HVCMA located on chromosome 1 (7H) (Rcs-qtl-1H-1) explained only 12.52% of pheno-typic variation, we conclude that the marker HVCMA may either be linked to a QTL with a small effect or is loosely linked to a QTL with a large effect (Melchinger, 1998). With moderately high heritability expressed for spot blotch resistance, the markers detected in this study explained around 59.89% of phenotypic variation.
The identification of three genes that probably control spot blotch resistance and the detection of closely linked markers, should now make marker assisted selection for spot blotch resistance a promising approach in barley. Map-ping of additional markers should even result in better ge-netic resolution and more tightly linked markers for spot blotch resistance genes. Successful MAS and cloning of the major resistance QTLs will crucially depend on the genera-tion of new flanking markers on chromosomes 5H and 1H.
Acknowledgments
The authors are grateful to the India Agricultural Re-search Institute Regional Station, Wellington, Tamil Nadu, for providing off-season facilities.
References
Arney DC (1951) Inheritance of resistance to spot blotch in barley seedling. Phytopathol 41:691-698.
Bailey KL and Wolf RI (1994) Genetic relationship between reac-tion to common root rot and yield in the progeny of a barley cross. Can J Plant Pathol 16:163-169.
sativus) in wheat (Triticum aestivum). Can J Plant Pathol 12:207-214.
Becker J and Heun M (1995) Mapping of digested and undigested random amplified microsatellite polymorphisms in barley. Genome 38:991-998.
Bilgic H, Steffenson BJ and Hayes PM (2005) Comprehensive ge-netic analyses reveal differential expression of seedling and adult plant resistance to spot blotch in populations of barley. Theor Appl Genet 111:1238-1250.
Clark RV (1979) Yield losses in barley cultivars caused by spot blotch. Canadian J Plant Pathol 1:113-117.
Cohen E, Helgason SB and McDonald WC (1969) A study of fac-tors influencing the genetics of reaction of barley to root rot caused byHelmenthosporium sativum. Can J Bot 47:429-443.
Comstock RE and Moll RH (1963) Genotype-environment inter-action. In: Hanson WD and Robinson HF (eds.) Statistical Genetics and Plant Breeding. Publ. 982. National Academy of Sciences and National Research Council, Washington DC, pp 164-194.
Condit R and Hubbell S (1991) Abundance and DNA sequence of two-base repeat regions in tropical tree genomes. Genome 34:66-71.
Fehr WR (1987) Principles of Cultivar Development. v. 1. Theory and Technique. Macmillan Publishing Company, New York, 536 pp.
Griffee F (1925) Correlated inheritance of botanical characters in barley and the manner of reaction to Helminthosporium sativum. J Agric Res 30:915-933.
Hosford RM, Jr Solangi GRM and Kiesting RL (1975) Inheri-tance inCochiliobolus sativus. Phytopathol 65:699-703. Joshi AK and Chand R (2002) Variation & inheritance of leaf
an-gle & its association with spot blotch (Bipolaris sorokiniana) severity in wheat (Triticum aestivum). Euphy-tica 124:283-291.
Joshi AK, Chand R and Arun B (2002) Relationship of plant height & days to maturity with resistance to spot blotch in wheat. Euphytica 123:221-228.
Joshi AK, Chand R, Kumar S and Singh RP (2004b) Leaf tip ne-crosis: A phenotypic marker associated with resistance to spot blotch disease in wheat. Crop Sci 44:792-796. Joshi AK, Kumari M, Singh VP, Reddy CM, Kumar S, Rane J and
Chand R (2007a) Stay green trait: Variation, inheritance and its association with spot blotch resistance in spring wheat (Triticum aestivumL.). Euphytica 153:59-71.
Joshi AK, Ortiz-Ferrara G, Crossa J, Singh G, Alvarado G, Bhatta MR, Duveiller E, Sharma RC, Pandit DB, Siddique AB,et al. (2007b) Associations of environments in South Asia based on spot blotch disease of wheat caused by Cochliobolus sativus. Crop Sci 47:1071-1084.
Joshi AK, Ferrara O, Crossa J, Singh G, Sharma R, Chand R and Parsad R (2007c) Combining superior agronomic perfor-mance and terminal heat tolerance with resistance to spot blotch (Bipolaris sorokiniana) in the warm humid Gangetic plains of south Asia. Field Crop Res 103:53-61.
Joshi AK, Kumar S, Chand R and Ortiz-Ferrara G (2004a) Inheri-tance of resisInheri-tance to spot blotch caused by Bipolaris sorokinianain spring wheat. Plant Breeding 123:213-219. Kosambi DD (1944) The estimation of map diatance from
recom-bination value. Ann Engen 12:172-175.
Kutcher HR, Bailey KL, Rossnagel BG and Legge WG (1994) Heritability of common root rot and spot blotch resistance in barley. Can J Plant Pathol 16:287-294.
Lander ES and Botstein D (1989) Mapping mendilian factors un-derling quantitative traits using RFLP linkage maps. Genet-ics 121:185-199.
Lander ES, Green P, Abrahamson J, Barlow A, Daly MJ, Lincoln SE and Newburg L (1987) MAPMAKER: An interactive computer package for constricting primary genetic linkage maps of experimental and natural populations. Genomics 1:174-181.
Li JZ, Sjakste TG, Roder MS and Ganal MW (2003) Development and genetic mapping of 127 new microsatellite markers in barley. Theor Appl Genet 107:1021-1027.
Liu YG, Biyashev RM and Saghai-Maroof MA (1996) Develop-ment of simple sequence repeat DNA markers and their inte-gration into a barley linkage map. Theor Appl Genet 93:869-876.
Melchinger AE (1998) Advances in analysis of data on quantita-tive trait loci. In: Chopra VL, Singh RB and Verma A (eds) Crop Productivity and Sustainability Shaping the Futurex. Oxford and IBH Publ, New Delhi, pp 773-791.
Mesfin A, Smit KP, Dill-Macky R, Evans CK, Waugh R, Gustus D and Muehlbauer GJ (2003) Quantitative trait loci for Fusarium head blight resistance in Barley detected in a two-rowed by six-rowed population. Crop Sci 43:307-318. Michelmore RW, Paran I and Kesseli RV (1991) Identification of
markers linked to disease-resistance genes by bulked segre-gant analysis: A rapid method to detect the markers in spe-cific genomic regions by using segregating populations. Proc Natl Acad Sci USA 88:9828-9832.
Misra AP (1973) HelminthosporiumSpecies Occurring on Ce-reals and Other Gramineae. Catholic Press, Ranchi, 289 pp. Mulitze DK and Baker RJ (1995) Genotype assay and method of
moments analyses of five quantitative traits in a spring wheat cross. Crop Sci 25:162-167.
Nelson J (1997) Qgene: Software for marker-based genomic anal-ysis and breeding. Mol Breed 3:239-245.
Nutter FW, Pederson VD and Foster AE (1985) Effect of inocula-tion withCochliobolus sativusat specific growth stages on grain yield and quality of malting barley. Crop Sci 25:933-938.
Piening LJ, Atkinson TG, Horricks JS, Ledingham RJ, Mills JT and Tinline RD (1976) Barley losses due to common root rot in the prairie provinces of Canada, 1970-1972. Can Plan Dis Surv 56:41-42.
Ramsay L, Macaulay M, Degli Ivanissevich S, Maclean K, Cardle L, Fuller J, Edwards KJ, Tuvesson S, Morgante M and Massari A (2000) A simple sequence repeat-based linkage map of barley. Genetics156:1997-2005.
Saghai-Maroof MA, Soliman KM, Jorgensen RA and RW Allard (1984) Ribosomal DNA spacer length polymorphisms in barley: Mendelian inheritance, chromosomal location, and population dynamics. Proc Natl Acad Sci USA 81:8014-8018.
SAS (1997) SAS Institute Inc., Cary, NC.
Singh RP and Rajaram S (1995) Genetic analysis of resistance to scab in spring wheat cultivar Frontana. Plant Dis 79:138-240.
Steffenson BJ, Hayes PM and Kleinhofs (1996) Genetics of seed-ing and adult plant resistance to net blotch (Pyrenophora teres f. teres) and spot blotch (Cochliobolus sativus) in bar-ley. Theor Appl Genet 92:552-558.
Stein N, Prasad M, Scholz U, Thiel T, Zhang H, Wolf M, Kota R, Varshney RK, Perovic D, Grosse I,et al.(2007) A 1,000-loci transcript map of the barley genome: New anchoring points for integrative grass genomics. Theor Appl Genet 114:823-839.
Tuberosa R and Salvi S (2004) QTLs and genes for disease resis-tance in barley and wheat. In: Gupta PK and Varshney RK (eds) Cereal Genomics. Kluwer, The Netherlands, pp 199-251.
van Der Plank JE (1963) Plant Diseases: Epidemics and Control. Academic Press, New York, pp 349.
Van Leur JG (1991) Testing barley for resistance toCochliobolus sativusat ICARDA, Syria. In: Tinline RD (ed) Proceedings of 1stInternational Workshop on Common Root Rot of Ce-reals, Saskatoon, pp 128-134.
Wilcoxson RD, Rasmusson DC and Miles MR (1990) Develop-ment of barley resistant to spot blotch and genetics of resis-tance. Plant Dis 74:207-210.
Wright S (1968) Evolution and Genetics of Population. v. I. Ge-netics and Biometric. University of Chicago Press, Chicago, 469 pp.
Zadoks JC, Chang TT and Konzak CF (1974) A decimal code the growth stages of cereals. Weed Res 14:415-421.
Associate Editor: Everaldo Gonçalves de Barros