ii By
Supervised by
! " # $ % & '(
Departamento de Lenguajes y Sistemas Informaticos, Universitat Jaume I, Castellón, Spain.
Cosupervised by ) * & '(
Institute for Geoinformatics, Westfälische Wilhelms%Universität, Münster,Germany.
and
. & '(
Instituto Superior de Estatística e Gestão de Informação, Universidade Nova de Lisboa, Lisbon, Portugal.
iii
+,$ )- (. / ) ,0 1
I hereby declare that this thesis has been written independently by me, solely based on the specified literature and resources which have been cited appropriately. The thesis has never been submitted for any other examination purposes. It is submitted exclusively to Universities participating in the Erasmus Mundus Master program in Geospatial Technologies.
Castellon de la Plana, 28 February 2011
ii
21
/.(
.1,
I would like to thank my supervisor Dr. Joaquin Huerta, for the interest and appreciation in
my work, and co%supervisors Dr. Albert Remke, and Dr. Marco Painho for their support and
guidance throughout the process of writing this thesis. Besides, I appreciate the help received
by Dr. Carlos Granell and Dr. Laura Diaz, of the Universitat Jaume I, including their advice,
and ideas to improve my work. And a special thanks to Dolores Apanewicz, the Master
Administrator, for her assistance during this time, and for her revision of my thesis, to
improve its writing.
I would like to thank the European Commission and the Erasmus Mundus Master in
Geospatial Technologies staff for having been selected and granted the scholarship.
Finally, I would like to thank my family, and, I wish to express my special gratitude to my
wife for her loving support, continuous encouragement and for never stopping believing in
iii
3 ,)
,
In the last decade the publication of geographic information has increased in Internet, especially with the emergence of new technologies to share information. This information requires the use of technologies of geoprocessing online that use new platforms such as Cloud Computing. This thesis work evaluates the parallelization of geoprocesses on the Cloud platform Amazon Web Service (AWS), through OGC Web Processing Services (WPS) using the 52North WPS framework. This evaluation is performed using a new implementation of a Geostatistical library in Java with parallelization capabilities. The geoprocessing is tested by incrementing the number of micro instances on the Cloud through GridGain technology.
The Geostatistical library obtains similar interpolated values compared with the software ArcGIS. In the Inverse Distance Weight (IDW) and Radial Basis Functions (RBF) methods were not found differences. In the Ordinary and Universal Kriging methods differences have been found of 0.01% regarding the Root Mean Square (RMS) error.
v
4
+
#
). +
.1
En la última década la publicación de la información geográfica se ha incrementado en Internet, especialmente con la aparición de nuevas tecnologías para compartir información. Esta información requiere el uso de tecnologías de geoprocesamiento en línea que utilizan nuevas plataformas como Cloud Computing. Esta tesis evalúa la paralelización de geoprocesos en la plataforma Cloud de Amazon Web Service (AWS), mediante OGC Web Processing Services (WPS) usando la aplicación de 52North. Esta evaluación se realiza mediante la implementación de una nueva biblioteca geoestadística en Java con capacidades de paralelización. El geoprocesamiento es probado incrementando el número de nodos (micro instancias) en la plataforma Cloud a través de la tecnología GridGain.
La biblioteca geoestadística obtiene similares valores interpolados en comparación con el software ArcGIS. En los métodos de Ponderación del Inverso de la Distancia (IDW) y Función de Base Radial (RBF) no se encontraron diferencias. En los métodos Kriging Ordinario y Kriging Universal se encontraron diferencia de 0.01% con respecto al error medio cuadrático.
vi Finalmente, los experimentos muestran que el geoprocesamiento en Cloud Computing es factible a través de la interface WPS. El rendimiento de los métodos geostadísticos desplegados mediante los servicios WPS puede mejorar con la técnica de paralelización en el Cloud. Esta tesis prueba que la paralelización de geoprocesos en Cloud Computing para propósitos académicos no es costosa usando la plataforma Amazon AWS. Todavía
vii
2.5
)(
Web Processing Services Parallelization Algorithms Interpolation
Geostatistics Cloud Computing
/ 3)
/ 6.
Web Processing Services Algoritmos de paralelización Interpolación
Geoestadística
viii
) 15
Amazon RDS Amazon Relational Database Service Amazon S3 Amazon Simple Storage Service
AMI Amazon Machine Image
API Application Programming Interface
AWS Amazon Web Services
BPEL Business Process Execution Language
DEM Digital Elevation Model
EBS Elastic Block Store
EC2 Amazon Elastic Compute Cloud
GAE Google App Engine
GI Geographic Information
GIS Geographic Information Systems
GML Geographic Markup Language
GPW The Geo Processing Workflow
GRAM Globus Resource Allocation Manager GSI Grid Security Infrastructure
HaaS Hardware as a Service
HDFS Hadoop Distributed File System IaaS Infrastructure as a Service
IDW Inverse Distance Weight
KML Keyhole Markup Language
KVP Key Value Pairs
OGC Open Geospatial Consortium
PaaS Platform as a Service
ix
SaaS Software as a Service
SDI Spatial Data Infrastructures SOA Service%oriented architecture
SOAP SOAP
SPI Service Provider Interface
UNICORE Uniform Interface to computing Resources
UTM Universal Traversal Mercator
WCS Web Coverage Service
WFS Web Feature Service
WMS Web Map Service
WPS Web Processing Service
WSDL Web Services Description Language
x
01(.7 8 ,$. ,.7,
ACKNOWLEDGMENTS ... ii
ABSTRACT ... iii
RESUMEN ... v
KEYWORDS ... vii
ACRONYMS ... viii
INDEX OF THE TEXT ... x
INDEX OF TABLES ... xii
INDEX OF FIGURES ... xiii
1. Introduction ... 1
1.1 Problem statement ... 2
1.2 Objectives ... 3
1.3 Thesis structure ... 3
2. Background ... 3
2.1 Web Processing Service (WPS) ... 3
2.1.2 Others OGC Web Services ... 8
2.2 Geostatistics ... 9
2.2.1 Geostatistical Methods ... 10
2.2.2 Cross Validation ... 14
2.3 Cloud Computing ... 14
2.3.1 Overview ... 15
2.3.2 Types of Cloud Computing ... 16
2.3.3 Cloud Computing providers... 17
2.3.4 GIS in Cloud Computing ... 19
2.3.5 Relationship between Grid computing and Cloud Computing ... 20
3. Resources used ... 22
3.1 Description of software and hardware used ... 22
xi
3.2.1 The maximum daily temperature dataset ... 23
3.2.2 Elevation dataset ... 24
4. Geostatistical methods library ... 26
4.1 Interpolator requirements ... 27
4.2 Design Geostatistical library ... 27
4.3 Determining the best parameter for each method ... 29
4.4 Implementation of Geostatistical library ... 30
5. Geostatistical library on the WPS framework ... 31
5.1 Designing the parallelization profile of interpolation methods ... 32
5.2 Adding parallel characteristics in the Geostatistical library ... 34
5.3 Configuration of parallelization environment on the framework ... 35
5.4 Defining processes in the framework ... 38
5.5 WPS client ... 39
6. Implementing the WPS on the Cloud ... 39
6.1 Cloud environment configuration in the AWS platform ... 40
6.2 Addition of WPS on the Cloud ... 41
6.3 Creation of a Grid on the Cloud ... 42
6.4 Evaluating of WPS on the Cloud ... 43
7. Results and discussion ... 44
7.1 Evaluation of the Geostatistical Library ... 44
7.1.1 Testing the services on the WPS Client ... 46
7.1.2 Evaluation of parallelization of WPS in an intranet ... 49
7.1.3 Evaluation of parallelization of WPS on Amazon AWS ... 50
7.1.4 Experiment on the Cloud ... 55
7.2 Cost evaluation ... 58
8. Conclusion and future work ... 58
xii
01(.7 8 , 3/.
Table 1 Characteristics of local interpolation methods ... 10
Table 2. Obstacles of Cloud Computing ... 15
Table 3. Comparison between Cloud and Grid computing ... 21
Table 4. Similar aspects between each method ... 27
Table 5. List parameters used by ArcGIS ... 29
Table 6. Validation of Geostatistical library ... 44
Table 7. Statistics of the differences between duration requests and processing ... 49
Table 8 Significance between duration means of each configuration ... 53
Table 9 Comparison of the differences in means between nodes. (a) indicates significance > 95% ... 54
xiii
01(.7 8 80 +).
Figure 1. Empirical and theoretical semivariogram ... 11
Figure 2. Response WPS on Cloud Computing (Schäffer et al., 2010) ... 20
Figure 3. Integration between Grid and Cloud Computing ... 21
Figure 4. Distribution of weather stations ... 23
Figure 5. Statistical distribution of the maximum temperature dataset ... 24
Figure 6. Distribution elevation samples in the dataset. ... 25
Figure 7. Distribution and statistics about DEM used ... 25
Figure 8. Statistics of samples used ... 26
Figure 9. Geostatistical classes diagram ... 28
Figure 10. Pseudo%code Generic interpolation procedure ... 30
Figure 11. Pseudo%code GetWeight Ordinary Kriging. ... 31
Figure 12. Addition a new algorithm in the 52North WPS framework ... 32
Figure 13. Techniques used to divide task in the interpolation. ... 33
Figure 14. Geostatistical classes diagram with parallel capabilities. ... 34
Figure 15. Geostatistical library in the 52North WPS framework ... 35
Figure 16. WPS with GridGain approach ... 35
Figure 17. Extension of GridGain in the 52North WPS framework ... 36
Figure 18. New GridGain approach in the 52North WPS framework ... 37
Figure 19. Starting a GridGain node in Tomcat ... 38
Figure 20. Console of the platform AWS ... 40
Figure 21. Configuration AWS API ... 41
Figure 22. Diagram of nodes used in AWS platform ... 42
Figure 23. Nodes running in the AWS console ... 43
Figure 24. Comparison of the Interpolation Methods between ArcGIS and the Geostatistical library ... 45
Figure 25. Differences between RBF and Ordinary Kriging ... 46
Figure 26. Finding the best parameters ... 47
Figure 27. Graphics of cross validation and semivariogram generated by the Geostatistical library ... 47
xiv Figure 29. Distribution duration of interpolation in Grid per number of nodes and
resolution spatial ... 50
Figure 30. Evaluation WPS general cross validation on the Cloud ... 51
Figure 31. Evaluation parallelization on Amazon AWS ... 52
1
1.
0
In the last years Internet has changed the face of applications and the environment in which they are executed. Everyday there are more online applications that offer the same tools that were offered by desktop applications. The mechanisms used to manipulate, share and generate geographic information (GI) are also changing. Nowadays, Spatial Data Infrastructure (SDI) technology is contributing to the implementation of new methodologies for improving the manipulation of GI at different levels in our society. One of the most important points in building SDI is the adoption of standards for sharing GI. Thus, the Open Geospatial Consortium (OGC) is becoming an important part of SDI with standards such as Web Map Services (WMS), Web Feature Services (WFS), Web Coverage Services (WCS), Web Processing Services (WPS) and others.
The WPS standard increases the potential of geoprocessing online through publication of tools already developed in Geographic Information Systems (GIS) software or procedures that incorporate complex processes (Ladra et al., 2008). The performance improvement of WPS services is an important theme in the development of the OGC interface (Brauner et al., 2009). Technologies such as Grid computing are being evaluated to improve the specification (Baranski, 2008). This technique uses the parallelization of processes to execute a complex task. Using the features of Grid computing in geospatial data it is possible to improve the performance of WPS services on Internet. This thesis combines the parallelization technique that is generally used in Grid computing to interpolate GI through OGC services.
2 Cloud Computing combines some features such as virtualization, high potential, low cost and service oriented (Zhang et al., 2010a) that incentives the development of a new model for processing, storing and sharing information. The GI is also included in the type of information suitable for the Cloud Computing environment. The best known geographic application on Cloud Computing is Google maps (Velte et al., 2010) which is used by thousands of people every day. The OGC standard Keyhole Markup Language (KML) is being used to share geographic information, and its expansion requires the implementation of applications that support it; but, the amount of data generated is a problem for geoprocessing. The development of technologies that process information in Internet is needed to avoid the data problems. There are several types of generators of GI such as GPS, sensors, weather stations, and others that require geoprocessing on line. Usually, GI is related with continuous variables that require specialized software applications or techniques like Geostatistics.
Geostatistics is used to determine the best spatial distribution of a variable. This technique uses interpolation for predicting and evaluating the behavior of a variable. It is used in different areas like agriculture, climatology, business, topography and others. This project implements some Geostatistical methods through a Java library. This library has been designed to be executed in parallel with WPS services, which are deployed on Cloud Computing with some capabilities of Grid computing. This project evaluates the performance of execution of interpolations on Cloud Computing.
1.1
Problem statement
3
1.2
Objectives
The major goal of this work is the evaluation of the parallelization of geoprocessing on the Cloud Computing through the WPS interface.
• Implement a Geostatistical library with parallelization features in order to reduce the duration of calculations.
• Generate WPS services with the parallel capabilities to process information on Grid.
• To evaluate the feasibility of geospatial analysis on the Cloud through parallelization of geoprocessing
1.3
Thesis structure
The first chapter introduces the general information and the objectives of this research. The second chapter provides the theoretical background about the main topic of the thesis: WPS, Geostatistics and Cloud Computing. The third chapter describes the dataset, software and hardware used in the project. The Geostatistical methods library is presented in the fourth chapter, which indicates all aspects involved in the design and implementation of the Geostatistical library in Java. The implementation of the Geostatistical library in the WPS is described in the fifth chapter. The sixth chapter shows the steps followed in the implementation on the WPS on the Cloud. Chapter seven describes and discusses the results obtained in the project. Finally, chapter eight provides the conclusions and future work.
2.
3
*
2.1
Web Processing Service (WPS)
4 services are based on an open non%proprietary Internet Standard specification (OGC Reference Mode, 2008), in order to support geodata, geo%processes, sensors, location services and other services related to geographic information. The OGC WPS was accepted as a standard interface that allows wrapping a process, algorithm or operation on Web in a defined structure, which can be discovered and used by others processes or clients (OGC Web Processing Service, 2007). The WPS describes the inputs and outputs of the processes and mechanisms that should be used by a request to obtain a result. This allows integrating and binding any type of format and procedure. Each WPS service has an identifier in order to facilitate its discovery.
The WPS has been used in projects related with disaster management in urban areas (Stollberg & Zipf, 2009), that allows combining several data sources and process chaining to determine risk areas. In others fields like precision agriculture, it has been used to support decision making of farmers (Nash et al., 2007). Some hydrological projects have incorporated the WPS specification to model watersheds (Fitch & Bai, 2009; Díaz et al., 2008). These projects have demonstrated the usefulness of the specification on complex geoprocessing workflows. However, they suggest working in problems related to the support of different Geographic Markup Language (GML) versions and huge datasets management.
2.1.1.1 WPS operations
The WPS establishes three mandatory operations that can be managed by a XML% based protocol with a POST method and Key Value Pairs (KVP) with GET method. The WPS specification version 1.0.0 supports the Simple Object Access Protocol (SOAP) to exchange structured information. This new feature allows integrating WPS with Service%oriented architecture (SOA) in order to improve the interoperability with others systems.
•GetCapabilities: This operation retrieves the relevant information about the service provider, and describes all the processes available by the service.
5 to obtain information about inputs and outputs identifiers, and all needed schemas to be recognized by a server and a user understandable description. This operation also provides the supported formats and optional values that each input can have.
•Execute: This operation requires the process identifier and the value of each parameter in the supported format. The output of the operation is a XML%Document with a description of the process and the outputs. The outputs can be literal data e.g., String, Double, Integer and etc., and complex data as GML document, compressed Shapefile, GeoTiff and so on.
2.1.1.2 WPS Implementations
The OGC WPS standards have had several versions from 0.4.0 to the current version 1.0.0 which was released in 2007 (OGC Web Processing Service, 2007). During the development of this standard some projects have worked on supporting new versions, including modifications and improvements to obtain a final complete version. Some projects that support the WPS version 1.0.0 specification are:
•Deegree1: This project supports the complete implementation of WPS 1.0.0 specification and KVP, XML and SOAP requests. The application is deployed through a ServletContainer on TOMCAT or Jetty.
•PyWPS: This project is based on Python and provides native support for GRASS GIS using the WPS 1.0.0 specification. This server is designed to deploy processes of other software, like R statistic, GDAL or PROJ (PyWPS, n.d.).
•52 North WPS2: The implementation of 52North supports the WPS specification version 1.0.0 through the use of Java technology. This framework uses Geotools libraries to manage geographical geometries and complex data. It also includes some extensions to support several types of processes providers e.g., GRASS, Sextante, and connection with ArcGIS Server. This work tests new features such as extensions
1
www.deegree.org
2
6 in the implementation, for example, transactional profile and process parallelization using UNICORE or GridGain.
2.1.1.3 WPS on Grid computing
The concept of Grid computing is related with two problems, the addition of processing power and the distribution of resources (Zhang et al., 2010b). Usually, Grid computing implies the division of a procedure for getting better performance in the execution of a process. Brauner et al. (2009) has argued that efficiency of geoprocessing services is an important topic in which the community should work to improve the WPS standard. In this way, technologies as parallel processing, distributed algorithms and agent%based modeling (Yuan, 2007) can improve the performance of geoprocesses. Although at this moment, the specification does not fully support geoprocesses on Grid as shown by Baranski (2008), the Grid profile is being studied by OGC.
In a Grid environment the geoprocesses should use the technique of parallelization of algorithms, which can be classified in two types: simple parallelization and data parallelization (Pautasso & Alonso, 2006). The simple parallelization technique divides the problem by using threads of controls, in which there is a dependency during the execution. Otherwise, the data parallelism is often used over large datasets. This method splits the dataset into subsets and executes an operation independently for each one (Pautasso & Alonso, 2006). The data parallelism is divided into:
• Static: nodes' number is known before execution
• Dynamic: nodes' number is obtained at runtime
• Adaptive: the tasks' number is calculated based on number of nodes. The adaptive approach also depends on data homogeneity and its relation with task duration in each node (Mahanti & Eager, 2004).
7
•GridGain: This framework is based on Java technology, and it improves the performance of an application dividing and parallelizing tasks. It also allows managing the Grid topology through the Service Provider Interface (SPI). This SPI helps to distribute all processes adequately on the nodes, and manages failures on transactions among nodes (Resende, 2010 . This technology has been evaluated on the implementation of WPS 52North, in which the essential libraries of GridGain has been added. The last version 3.0 supports the auto scaling of a Cloud and other characteristics such as: Cache distributed data in data grid, auto%discover all grid resources and scale up or down based on demand (GridGain, 2010).
•Globus Toolkit: This is a set of open tools to build grids. It has some principal modules: Globus Resource Allocation Manager (GRAM) which allows for controlling, executing and supervising jobs and Grid Security Infrastructure (GSI) to improve the security on all levels of the grid. Also, it includes tools for resources management, fault detection, communication, and portability. This project is adopted by several institutions such as the University of Chicago, NASA, DARPA, IBM and Microsoft3.
•Uniform Interface to computing Resources (UNICORE): “Make distributed computing and data resources available in a seamless and secure way in intranets and the Internet4”, this project has been used in the WPS framework of 52North to demonstrate the capabilities of parallelization of processes using the interface.
•Hadoop: This framework allows for the management of a large amount of data in parallel, this technology uses the principles of a MapReduce technique. This programming technique divides the process in two sections, Map and Reduce. In the Map, a central node splits and distributes the input into small parts, each part is worked independently. The Reduce section is in charge of obtaining the responses of all the nodes. The input and worked part is stored in the Hadoop Distributed File
3
http://www.globus.org/toolkit/about.html
4
8 System (HDFS)5. The MapReduce technique is implemented on multiple projects of Google (Dean & Ghemawat, 2004). According with Ku et al. (2010), it is possible to use this technology with massive geodata, and through WPS, the operations built up in this system can be accessed.
The WPS on Grid computing has been evaluated by Pascoe et al. (2009) in the calculation of global and regional climate models, designed to support 1000 simultaneous request over WPS layers. Other projects have used parallelization techniques to improve the management of images and interpolations (Alonso%Calvo et al., 2010; Hawick et al., 2003; Pesquer%Mayos, 2008).
2.1.1.4 Orchestration of WPS
According to Brauner et al. (2009) the orchestration or workflow of WPS is an essential topic to improve the WPS specification. The OGC is also investigating a new specification to manage workflows. The Geo Processing Workflow (GPW) is a new approach that works with Business Process Execution Language (BPEL) and Web Services Description Language (WSDL) to orchestrate OGC WPS (OWS%4 Geo Processing Workflow (GPW)). It is not possible to include directly WPS on orchestration model with BPEL. Its description should be converted to a WSDL document (Stollberg & Zipf, 2008). The combination of WPS and WSDL improves the reusability. When the WPS binds complex processes it can lack reusability and flexibility (Wehrmann et al., 2010).
2.1.2 Others OGC Web Services
The OGC classified Web Services depending on their functionalities to manage geospatial data, process information, sensor management, and mass services. The OGC Web Services projects that focused on geodata are:
•Web Map Service (WMS): This service provides some mechanisms to share geodata visually using three operations; GetCapabilities, GetMap and GetFeatureInfo. With these operations it is possible to obtain and overlay data of
5
9 diverse platforms and sources. The GetCapabilities is a common denominator in the OGC Web Services that manage geodata.
•Web Feature Service (WFS): The OGC represents the geodata using Geographic Markup Language (GML), which allows modeling any geographic element. The WFS is a service that provide mechanisms to manage geographical features using GML formats through transactional operations such as insert, update and delete.
•Web Coverage Service (WCS): The grid structure represents information usually provided by satellite images, Digital Elevation Models (DEM), and other kinds of geographical information sources. The OGC have developed the WCS standard to facilitate the manipulation of raster information in a Web environment.
2.2
Geostatistics
The Geostatistics term describes some statistical methods applied in a geographic context. Usually they use continuous variables that can be measured anywhere. These methods are also associated with some interpolation techniques as Kriging, Inverse Distance Weight, Spline, etc. These methods share a similar objective, to obtain an unknown location value from known values of other locations. The methods suppose that the unknown value is a combination of weights and known values. The general equation (1) describes the combination of weights λ, and known values to obtain the unknown The distance plays an important role in the determination of each weight and each technique has its own form to obtain the weights.
The interpolation methods can be classified by assessment of error in deterministic or stochastic methods; by points used in global or local; or by exactitude in exact or inexact. In the table 1 the characteristics of the methods used in this project are described.
10 Local interpolation methods
Deterministic Stochastic
Inverse Distance Weight (Exact) Spline (Radial basis functions) (Exact)
Ordinary Kriging (Exact) Universal Kriging (Exact)
Table 1 Characteristics of local interpolation methods
2.2.1 Geostatistical Methods
2.2.1.1 Inverse Distance Weight (IDW)
This is a local, deterministic, and exact spatial interpolation method which is frequently applied on geosciences (Chang, 2004). IDW method suggests that the attribute values of two points are related by the inverse of their distance. Lu & Wong (2008) states that it is usual to modify the distance weight to predict the value of an unknown attribute of a location. The unknown value is calculated by the equation (1).
∑ 1
∑ 1 (2)
Where, is the value to be estimated at point 0, is the value at a known point i, is the distance between a known point i and point 0, s is the number of points used and k is the power used. The equation can be represented by the general equation (1) where, each weight λ is calculated by the equation (3).
2.2.1.2 Kriging
This method is related with the definition of spatial correlation. Its principal assumption is a stationary approach, in which the relationship between values of whatever pairs of points is independent of their position and the covariance is similar in all the points that are at the same distance (Johnston et al., 2001). This relation is managed through an empirical semivariance. This method searches for the best theoretical semivariogram model (Appendix A) to fit the empirical semivariogram
1
11 data. In this way, it is possible to obtain the error estimation. Kriging has some variations that depend on the type of data, some presumptions as normality, knowledge of the mean or the tendency of data. This research works with two types: Ordinary and Universal Kriging.
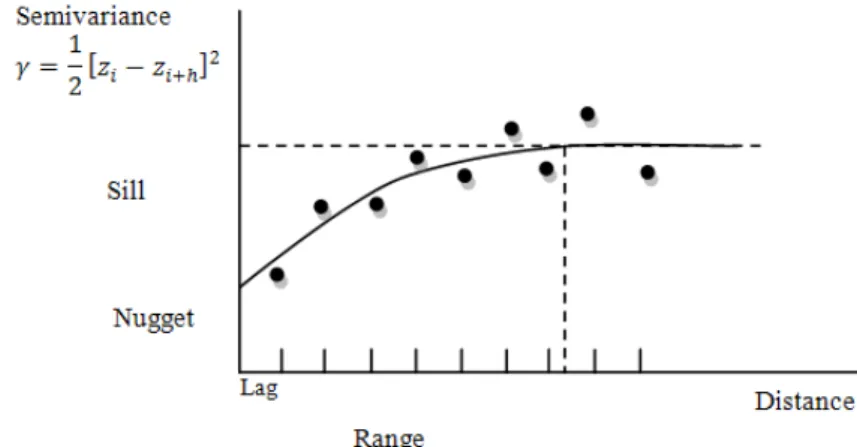
The Kriging methods use the empirical semivariance to model the behavior of data. Some predefined theoretical models are used to fit the characteristics of empirical semivariance. These mathematical models can be defined by three parameters: range, sill and nugget (figure 1). The variability of the semivariogram is defined by the range. After this value the semivariance is constant. The sill defines the semivariance threshold. When the variability in the semivariogram is not explained by just the sill, the evaluation of a nugget effect it is needed. Finally, the empirical semivariogram is evaluated on intervals called lags. The number of lags and the length of lags can influence the behavior of the theoretical semivariogram.
Figure 1. Empirical and theoretical semivariogram
Ordinary Kriging assumes that autocorrelation among all points range is the average semivariance (Chang, 2004) show by equation (4)
The unbiased condition in Kriging defines that the expectation of errors should be zero; it is showed in the equation (5).
1
12 The λ values are obtained minimizing the least square of the equation (6).
In the equation (6) (Johnston et al., 2001) the sum of all values should be equal to 1. In this case, it is needed to use the Lagrange multiplier Σz represents the theoretical semivariance matrix (equation 7), and the values of the unknown semivariance calculated through theoretical model. The values are replaced in the equation (1) to get the unknown value z0.
Universal Kriging assumes that autocorrelation among all points range is affected by a tendency (Chang, 2004) shown by equation (8), where β represent the trend.
The unbiased condition in Kriging defines that expectation of errors should be zero; it is showed in the equation (9).
The λ values are obtained minimizing by least square the equation (10).
0 ; (5)
! ; (6)
"Σ$ 1
1% 0& " & "'1& (7)
( (8)
( 0 ; (9)
( ! ; (10)
"Σ$ )
13 In the equation (10) (Johnston et al., 2001) the sum of all values should be equal to 1. In this case, Lagrange multiplier should be used. X represents the order of the trend function. In the first order, X adds x,y coordinates to matrix (equation 11). In a second order trend would be needed to use all polynomial coefficient of the second order. Σz represents the theoretical semivariance matrix. represents the values of unknown semivariance calculated through theoretical model. xo defines the coordinates of the unknown point. Finally, the values are replaced in the equation (1) to get the unknown value .
2.2.1.3 Radial Basis functions
This method works in a similar way as the Kriging interpolator, but without semivariograms. The basis of this method is centralized in the equation (12).
Where, φ(ri) is the radial basis function, ri is the distance from point p0 to the ith, the weights wi and m which is the Lagrange multiplier. That information is organized on the matrix equation (13). Where Φz is the evaluation of all points in the function used6”
This method can be implemented with several functions such as Multiquadric, Inverse Multiquadric, Multilog, Thin Plate Spline, Natural Cubic Spline, Spline with Tension and Completely Regularized Spline Function7(Appendix B).
6
http://www.spatialanalysisonline.com/output/html/Radialbasisandsplinefunctions.html 7
http://www.spatialanalysisonline.com/output/html/Radialbasisandsplinefunctions.html
+ , - (12)
".$ 1
14 2.2.2 Cross Validation
The selection of a method of interpolation should be analyzed using the quality of the estimation through root mean square (RMS) equation (14) and the standardized RMS equation (15) for Kriging methods. The cross validation is executed at all the points in the dataset following the next steps (Chang, 2004):
a) A point is removed
b) The interpolation in the position of the eliminated point is calculated in order to estimate it.
c) The error is obtained by comparing the known value and the estimated value.
2.3
Cloud Computing
The Cloud Computing is not yet defined perfectly (Liu & Liu, 2010; Zhang et al., 2010a; Armbrust et al., 2009). According to Boss et al. (2007), it can be defined as a platform and an application. It is related with the quantity and configuration of the involved servers. Generally, it combines data storage, network infrastructure and security. Applications on the Cloud can be accessed using web services from anywhere. Grossman (2009) says that “Clouds or cluster of distributed computers provide on%demand resources and services over a network, usually the Internet, with the scale and reliability of a data center”, indicating that some typical applications like e%mail and social networks can be considered as Cloud applications. The fundamental idea of Cloud Computing is not new (Vouk, 2008; Grossman, 2009; Zhang et al, 2010b; Foster et al. 2008); it combines some grid computing attributes as scale, application oriented and services oriented. Xu (2010); Mikkilineni & Sarathy (2009) argued that current Cloud technology also shares similar
/01 213 4 5 6 78659 : (14)
1;< <- = /01 213 4 5 6 78659
>
15 characteristics with the evolution of the telecommunications infrastructure such as supporting new services and data sharing at large scales. Vaquero et al. (2009) presented more than 20 definitions of Cloud Computing which shows that a real definition is needed to evaluate its real benefits.
2.3.1 Overview
Cloud Computing is a complex combination of technologies, hardware, software, businesses, customers with some characteristics such as: user friendliness, virtualization, Internet centric, variety of resources, automatic adaptation, scalability, resource optimization, pay per use, ultra large%scale (thousands of servers), high reliability (fault tolerance), versatility (support different applications at the same time); high extendibility (grow dynamically); extremely inexpensive (Zhang et al., 2010a; Gong et al., 2010; Vaquero et al., 2009).
On the other hand, the adoption of Cloud Computing is limited by some obstacles, defined by Armbrust et al. (2009) as availability of a service, data Lock%in, data confidentiality, data transfer, scalable storage, scaling time, and software license. Table 2 describes each obstacle.
Obstacle Effect Who would be
concerned? Availability of a Service Companies need to be sure about Quality of
Service
Banks, Governments, large companies. Data Lock%In Difficulties to get data in distributed
environments
All users.
Data Confidentiality and Audit ability
It is not possible to control where the information is stored and who manage the servers where information is located.
Governments, Large Companies
Data Transfer Bottlenecks Accessibility problems when there are simultaneous user
Large companies, Governments Scalable Storage Problems in the definition of the database
model (Relational Database or Blob schemas)
All Users
Bugs in Large%Scale Distributed Systems
Difficulties to model the environment of Cloud Computing
All Users
Scaling Quickly Improving time of scaling without violating service level agreements
Companies, Governments
Software Licensing Reduction of cost licenses All Users
16 Cloud Computing combines technologies for storing and distributing information using virtualization tools (Liu & Liu, 2010). The virtualization technology used in Cloud Computing is based on VMware, Xen and KVM. Although, there is not a specific programming model in Cloud Computing, the model MapReduce is increasing its adoption to process large datasets. Google, Amazon and Yahoo are using it to support huge datasets. Also, the BigTable technology is being used to manage huge datasets through redundancy mechanisms. On the other hand, security is an important concern on Cloud Computing. Both, government and companies require protocols of high security to put their information on the Cloud. The improvement of all security aspects involved on the Cloud to promote the adoption of this technology it is needed (Velte et al., 2010).
2.3.2 Types of Cloud Computing
Cloud Computing works based on the principles of a service%oriented architecture, that allows integrating and providing services. The term service is the common denominator between all types of Cloud Computing and it is related with the component used by vendor’s network (Velte et al., 2010). Nowadays, there are different types of models of Cloud Computing that use the term XaaS to refer (Software, Platform, Hardware, etc.) to a Service. Although, it is possible to find other model such as: (Development, Database, and Desktop) as Service, Infrastructure as a Service, Business as a Service, Framework as a Service, Storage as Service, Organization as a Service (Rimal et al., 2010; Wu et al., 2010). These models share similar characteristics.
2.3.2.1 Infrastructure as a Service (IaaS)
17 2.3.2.2 Platform as a Service (PaaS)
The PaaS model provides the resources to deploy applications on Cloud Computing. This environment includes tools for designing, development, testing and hosting (Zhang et al., 2010a; Velte et al., 2010; Xu, 2010). With this model it is not necessary for client software to create new applications. For example, Google App Engine is configured to support applications of users that can be deployed automatically on the Cloud (Rimal et al., 2010). This platform provides all the resources that the application needs. On the other hand, the PaaS can be used to customize other type of software on the Cloud, but the developments created on a PaaS suffer problems to be moved between PaaSs.
2.3.2.3 Software as a Service (SaaS)
This model of Cloud Computing provides applications which do not require customer support. The updating of SaaS applications are done by providers. Usually, the customer should only pay for the time that the application is used. The SaaS applications are based on web applications and save cost licenses (Zhang et al., 2010a). They can be accessed from wherever, and they can support several customers at the same time (Rimal et al., 2010). This model saves money and provides better reliable applications. Volte et al., (2010) describes other benefits such as: more bandwidth, the applications can be customized easily, the applications will have better marketing, companies will need less IT staff, and the providers can configure security environments for each company.
2.3.3 Cloud Computing providers 2.3.3.1 Amazon Web Services (AWS)
18
•Amazon Elastic Compute Cloud (EC2): This service provides an environment to create and manage instances, which refers to virtual servers with a variety of operating systems; they are called Amazon Machine Image (AMI). EC2 environment can be controlled by the web console or the web service API. This product is elastic due to its capacity of increasing or decreasing the number of instances8. The price of each instance depends on the running time, its location and its processing capacity; it can vary between $0.02 and $2.1 per hour.
•Elastic Block Store (EBS): store data independently of instances.
•Multiple Locations: It is possible to launch an instance in several locations.
•Elastic IP Address: The static IP is associated with the user account instead of a specific instance.
•Auto Scaling: This function allows increasing or reducing the number of instances depending on some predefined rules.
•Elastic Load Balancing: This tool distributes the requests among instances.
•VM Import: It is possible to import new virtual machine images to convert it on an AMI.
•Amazon Simple Storage Service (Amazon S3): (Amazon, 2010) argued that this product is designed to store information with a 99.999999% durability and 99.99% of availability. The redundancy is used to provide this level of service.
•Amazon CloudFront: This tool optimizes the transfer speeds among instances and end users.
•Amazon Simple Queue service: This service manages the messages between components in queues to prevent lost messages and improve the process of scalability.
•Amazon Relational Database Service (Amazon RDS): This service allows creating relational databases that support scalability and flexibility.
2.3.3.2 Google App Engine GAE
The configuration of GAE allows users to create web applications using languages as Python and Java. The infrastructure of GAE dynamically supplies the resources that the application needs; if an application increases its traffic, GAE scales the resources
8
19 automatically to support it. In this way, the efficiency of the developers improves because they should not spend time solving infrastructure problems. GAE is designed to support Google products such as Google Docs, Calendar, Reader, etc. The GAE platform manages quotas and limits to publish applications. This limit allows for the conservation of the performance of the entire system. Quotas are related with the resources that can be used by users. The GAE has a limit of 30 seconds for over all requests. If a request has a longer duration, it is cancelled9
2.3.3.3 Windows Azure
The Windows Azure platform is focused on running and storing applications. It is a kind of PaaS, in which developers can deploy their application without thinking about infrastructure issues. The parts of Windows Azure are:
•Compute: The applications should be created using .NET Framework using languages as C#, Visual Basic, C++, Java, etc. The operating system is Window server.
•Storage: This platform support large objects, and traditional relational databases.
•Fabric controller: This part controls the jobs operation in the entire system.
•Content delivery network: Using the caching technique the Windows Azure increase the speed of data access.
•Connect: Windows Azure allows companies to interact with Cloud applications through independent applications, web applications and the SaaS implementations with the Microsoft technology (Chappell, 2009).
2.3.4 GIS in Cloud Computing
The GIS technology manages large datasets and requires high computational resources. Jinnan & Sheng (2010) argued that GIS on Cloud can improve the capacity of GI storage and processing. Cloud Computing can supply these needs and adds other useful features such as: better GI distribution, high computational power, accessibility anywhere, etc. Singh & Wen (2010) argued that it is possible to process terabytes of information harmonizing the price of services and the capacity
9
20 of processing on Cloud Computing. At this moment, applications that provide GI such as Google maps work with Cloud technology to support thousands of users (Velte et al., 2010), and GIS applications as Mapinfo and ArcGIS Server provides capabilities to process and manage GI on Cloud Computing environment. Also, other projects have demonstrated to be useful for the distribution of GI on Cloud Computing e.g., Blower (2010) evaluated the feasibility of WMSs on GAE, although there were some limitations due to restrictions of GAE. The results demonstrated that it was possible to include geographical characteristics on GAE. On the other hand, the management of large GI datasets in Internet requires new types of indexing; Cary et al. (2010) implemented a new index through Hadoop technology over a dataset of 110%million property parcels in a private Cloud.
Figure 2. Response WPS on Cloud Computing (Schäffer et al., 2010)
The Cloud Computing can improve the performance of a SDI application when the number of users increment. (Schäffer et al., 2010) showed that a WPS service can be scaled on AWS infrastructure without damaging its performance. Figure 2, shows that the WPS performance on AWS is almost constant although the number of requests increases.
2.3.5 Relationship between Grid computing and Cloud Computing
21 architecture, programming model, resource management, and service negotiation are common in both systems.
The differences between both systems do not imply that they can work together. Platforms as GAE and AWS are using parallel paradigms like MapReduce that previously were exclusive to Grid computing. Zhang et al. (2010b) stated that “
”. The integration of Cloud and grid computing nowadays is evident, some databases are using grid paradigms to improve the management of large dataset on Cloud, and several middleware from Grid computing are being using on Cloud Computing to provide more computational power. Figure 3 shows the integration between Cloud and grid computing.
Characteristic Grids Clouds
Node operating system Dominated by Unix Virtual Machines Service negotiation Service Level Agreement (SLA) SLA
Resource management Distributed Centralized, Distributed Allocation Decentralized Centralized, Decentralized
Value%added Limited High Potential
Users Few Many
Cost High – fix Cheap % Variable
Architecture Application and Service Oriented Service Oriented Programming model Parallelization Paradigms,
MapReduce MapReduce
Security Complex model Simple model
Table 3. Comparison between Cloud and Grid computing
22
3.
)
3.1
Description of software and hardware used
The software and hardware used in this project can be divided on two stages:
• Programming phase
• Testing phase
The list of software products used in the programming phase is:
Java SDK 1.6.0.20, Eclipse Galileo 3.5.2, Operating System Ubuntu – Linux 10.04 LTS Lucid Lynx, GridGain 2.1.1, 52North WPS Framework RC6, Tomcat 6 and Geoserver 2.2. Some WPS clients as: 52North WPS OpenLayer client, and OpenJump 1.4.0.
The hardware used:
1 laptop AMD Athlon™ X2 Dual%Core QL%64, memory 3.0 GiB, hardisk 250 GiB.
In this phase, the configuration of a second computer is required with the software: Java SDK 1.6.0.22, Operating System Windows XP, and GridGain 2.1.1. The specification of the computer is: Intel® core™ 2 Duo, memory 3.0 GiB. The connection was through ad hoc network. The GIS program used is ArcGIS 9.3.
In the testing phase the software products used are referred as AMI micro instances in AWS. A master node contains the following software products: Operating system fedora, Tomcat 6, Java SDK 1.6.0.17, GridGain 2.1.1, Geoserver 2.2, 52North WPS Framework RC6 and 52North WPS OpenLayer client. In addition, 9 nodes with the following software: Operating system Fedora, Java SDK 1.6.0.17 and GridGain 2.1.1. All instances have been created in paravirtualization mode and their hardware simulates: one core with 613 MB.
3.2
Description of data used
23 3.2.1 The maximum daily temperature dataset
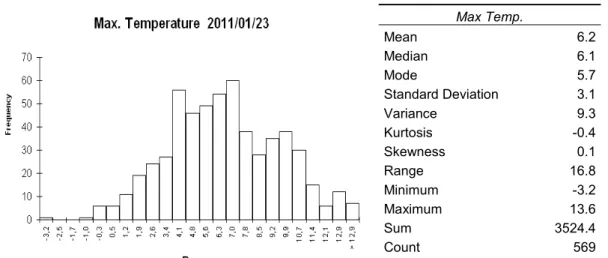
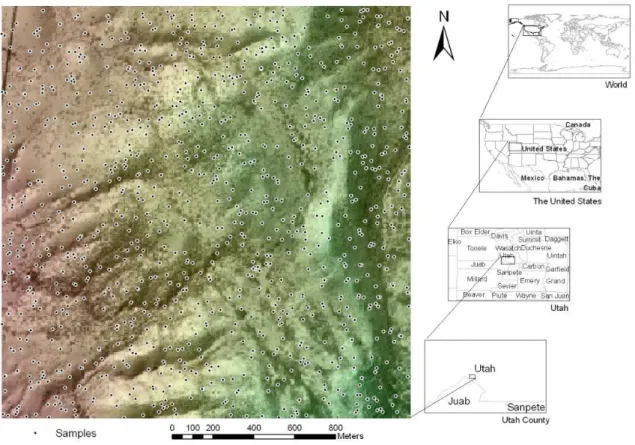
The maximum daily temperature is a meteorological variable that is captured by the weather stations. This variable is essential for calculating some agricultural parameters such as growing degree days or heating degree days10. The dataset used in this project is published by The Meteorological Agency of Spain11 (AEMET). The dataset contains the information of 569 stations without including stations located on Canarias and Africa (Figure 4). The dataset date is January 23, 2011.
Figure 4. Distribution of weather stations
The dataset describes a Gaussian distribution with a small positive skewness that indicates a concentration toward high values (Figure 5).
10
http://www.gov.ns.ca/agri/ci/weather/reports/definitions.asp
11
24 ! "
# $ !
% & '
( ( ) ( (
( " "
Figure 5. Statistical distribution of the maximum temperature dataset
3.2.2 Elevation dataset
The elevation samples are commonly used to generate digital surfaces or Digital Elevation Models DEMs. Nevertheless, this work uses a DEM to create two datasets of 1000 and 10.000 samples. The DEM is published by OpenTopo12 and created in 2008, with a resolution of 0.5 meters, covers an area of 400 hectares and it is based on LIDAR technology (Figure 6). The coordinate system is Universal Traversal Mercator (UTM) region 12 North, with datum WGS84.
The statistical distribution of the DEM describes a bimodal shape (Figure 7), and it is non%normal. The dataset collected describes a non%normal distribution (Figure 8) similar to the distribution of DEM. The mean between DEM and samples differs in 1.21 units, and standard deviation in 0.26 units.
12
25
Figure 6. Distribution elevation samples in the dataset.
DEM features
Mean 1741.41
Std. Dev 104.36
Sum 27x109
Minimum 1528.53
Maximum 1976.02
Count pixel 16x106
Resolution 0.5
26 "!
'! ' !" !'
!
# $ !
% & ""!
( ( ) ( (
( "! '
!!!
Figure 8. Statistics of samples used
4.
This chapter presents the key issues used to create a Geostatistical library that implements four interpolator methods such as Ordinary Kriging, Universal Kriging, IDW and RBF. Also, the chapter describes the mechanism used to determine the best parameters of each method.
This Geostatistical library will be used to evaluate the performance of WPS on the Cloud. Although, some Open Sources applications and libraries e.g., Sextante13, Gslib14, Gstat15, R16, etc., have geostatistical capabilities, only the Sextante library works with Java technology which it is the technology used by the WPS framework. Besides, the 52North Framework includes the Sextante Java libraries by default. The Sextante library supports several geographic functions including some interpolator methods, but it is not focused on Geostatistical problems; otherwise, other libraries to work are needed. In the process of parallelization these libraries should be also sent to each node. This thesis work prefers to develop a new simple library with parallelization capabilities to evaluate the parallelization of WPS services on the Cloud. This option, avoid sending libraries that will not be used in the nodes and allows for the control of all parameters of the Geostatistical methods.
13
http://forge.osor.eu/projects/sextante/
14
http://www.gslib.com/
15
http://www.gstat.org/whatsnew.html
16
27
4.1
Interpolator requirements
For the creation of a Geostatistical library the similarity between each method of interpolation needs to be determined; these similarities allow for defining some especial requirement that the library need (Table 4).
Although, the Ordinary and Universal Kriging methods can work as global interpolators, in this research they are managed as local interpolators to avoid inverting huge matrices in the process of interpolation. All methods use the points around to execute the interpolation. However, the methods Ordinary Kriging, Universal Kriging and RBF manage matrices in the process to determine the weights to interpolate. The Kriging methods use standardized RMS to define the best parameters.
Method Matrix
management
Sub models
Selection of points around
Fitting sub model
Selection best parameters
Kriging x x x x RMS, Std RMS
Kriging Univ. x x x x RMS, Std RMS
IDW - - x - RMS
RBF x x x - RMS
Table 4. Similar aspects between each method
4.2
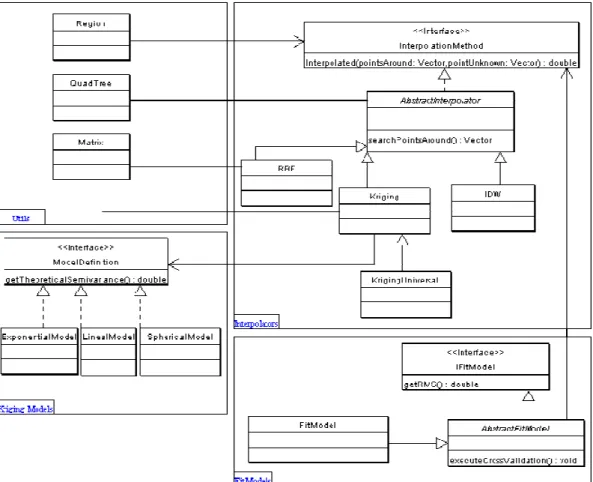
Design Geostatistical library
28
Figure 9. Geostatistical classes diagram
29
4.3
Determining the best parameter for each method
Each interpolator method needs certain initial parameters to execute the interpolation e.g., IDW needs the power value to run or Kriging needs to use a specific model to interpolate.
The evaluation of an interpolation can be done by cross validation and validation methodology (Chang, 2004). This project uses the cross validation method to determine the best interpolator method through the use of RMS and standardized RMS in the case of Kriging. Usually, all parameters can be changed by the user, but there are some parameters that are pre%defined by the application e.g., parameters in ArcGIS (Table 5).
The Geostatistical library evaluates a range of values for each parameter and calculate the cross validation for obtaining the best option. The application returns the parameters with the lowest RMS for methods IDW and RBF, and in the case of Kriging it returns the parameters based on two criteria, the lower RMS and closest standardized RMS to 1. The parameters used in this implementation vary according with a pre%defined range that the user can change.
The IDW method uses the following ranges: Number of neighborhoods from 5 to 12, and the power value change from 0.1 to 10 at steps of size 0.1.
The Kriging methods use the following ranges: N Number of neighborhoods from 5 to 12, number of lags (7%15), lag’s length (dividing the maximum length in four
Method by user by default by software
Kriging
Number of points around to search, distance of searching, theoretical model,
anisotropy (angle), trend lag=12 Range, sill, nugget
IDW
Number of points around to search,
distance of searching, theoretical model Power=2
RBF
Number of points around to search,
distance of searching model Smooth factor
30 parts) and the models: Lineal, Spherical and Exponential. The RBF method uses the following ranges: Number of neighborhoods from 5 to 12, the smooth factor from 0.1 to 0.5 at steps of size 0.1 and seven models (Appendix B).
4.4
Implementation of Geostatistical library
The Geostatistical library is developed in Java using the Eclipse platform following the UML diagram (Figure 9). This library has added two generic classes: QuadTree17 and Matrix18 (Sedgewick & Wayne, 2010) which are needed to execute some functions in the process of interpolation. A general approach about the interpolation process is presented in the figure 10. This function receives an array with the points that have an influence over the unknown location. Both parameters are used to get the weights. Finally, each weight is related with a point, and then the interpolated value is the addition of multiplication between each weight and its Z value.
9 : Generic Interpolation procedure
Function Interpolate ( ) as Double
! = GetWeight ( )
" = 0
For to
" # $ ! % & '% %
Next Return " End Function
Figure 10. Pseudo%code Generic interpolation procedure
The function GetWeight is particular for each interpolator method. The Ordinary Kriging uses the equation (7), the Universal Kriging equation (11), the RFB equation
17
http://www.cs.princeton.edu/algs4/92search/QuadTree.java
18
31 (13) and IDW the equation (3). Figure 11 illustrates the GetWeight function of the Ordinary Kriging. The evaluation of this library is presented in the results section.
9 : GetWeight Ordinary Kriging Model =Theoretical Model (range, sill, nugget)
Function GetWeight ( ) as Matrix
( ) =Matrix*num points around + 1, num points around + 1+
" = Matrix* # , ,+
DefineMatrixStructure (( ) ) // Add multiplier Lagrange values For
For -to
( ) * -+$Model.GetValue( Distance point ( Next
-" * + $
Model.GetValue( Distance point ( Next
( ) $Matrix.Inverse(( )
Return ( ) . " End Function
Figure 11. Pseudo%code GetWeight Ordinary Kriging.
The function DefineMatrixStructure fills the last row and column in the matrix with values 1. The Model.GetValue returns the semivariance according to the theoretical model selected. The procedure returns a vector with the number of points + 1.
5.
:
*
In the creation of a AbstractObsevableAlgorit association with the WPS
Figure 12.
Each service has a descrip the repository through the the new algorithms rela Geotools20 and OpenGis result of the interpolation WPS framework sends t Geoserver.
5.1
Designing the
The parallelization proc implementation and the le parallelize the matrix in methods. However, this nodes involved in the proc
19
wpsConfig: This the configu
20
http://www.geotools.org/
21
http://www.geoapi.org/
of a new service e.g., Interpolation, it lgorithm Class (Figure 12), this abstract class WPS description.
. Addition a new algorithm in the 52North WPS framework
description file with the WPS features, and it shou the configuration file called wpsConfig19. On s related with this Geostatistical library uses th
nGis API21 to support the output in the GeoTif ation is a surface which is stored in Geoserver ends the information through a REST service pr
the parallelization profile of interpolation m
process depends on the type of infrastructure the level of parallelization needed. For example, i trix inverse process which is included in some , this could require high bandwidth and low la
e process. The nodes allow data managing and pro
onfiguration file of the 52North WPS Framework
32 it extends the t class manages the
it should be added to . On the other hand, ses the libraries of iff format . The server. The 52North provided by the
tion methods
ructure used in the ple, it is possible to some interpolation ow latency between
33 This profile describes where the interpolation process executes the parallelization and how the jobs are distributed. Several parallel interpolation algorithms have been suggested by Strzelczyk & Porzycka (2010); Pesquer%Mayos (2008). Figure 13 some techniques to divide the process of interpolation are illustrated.
Figure 13. Techniques used to divide task in the interpolation.
The interest area is divided into cells or pixels that depend on the resolution or the selected number of columns and rows. The process of interpolation is executed in the location of each cell. In this step, the process can be distributed and executed among nodes in parallel. In the figure 13a, each row is assigned to a node that should execute the interpolation in each cell. The second option is to divide the area in sub regions (Figure 13b) to be sent to each node. Another option is to group the cells depending on density of points around. Figure 13c illustrates how some pixels with the same density are sent to each node.
34 external region are added. The buffer size is based on mean distance between points are used. Figure 13f shows how the density of each pixel is calculated.
5.2
Adding parallel characteristics in the Geostatistical library
Using the parallelization profile of the previous section, some operations need to be added to the model in order to parallelize the library (Figure 14).
Figure 14. Geostatistical classes diagram with parallel capabilities.
35
Figure 15. Geostatistical library in the 52North WPS framework
5.3
Configuration of parallelization environment on the framework
The 52North WPS framework has two extensions to manage processes on Grid: GridGain and UNICORE. This project works with the extension GridGain to distribute processes and data on parallel (figure 16).
Figure 16. WPS with GridGain approach
GridGainInterpolator shou the wpsConfig.
Figure 17
The WPS service configu 1. The service receiv 2. One GridGain mas 3. The master node e 4. The number of par 5. The data are split 6. The algorithms an 7. Each node receive 8. Each node return a 9. The master node m 10. The merged data i 11. The GridGain mas 12. The WPS return th In this configuration, eac activation. This project su in the 52North Framework
or should be added to the repository of algorithms
17. Extension of GridGain in the 52North WPS framework
nfigured with GridGain follows these steps: receives the data
in master node is started
node establishes a communication with other nodes of parts in which the data will be divided is defined
split
ms and the data are sent to each node
eceives the algorithm and uses it to process the data eturn a result to the master node
node merges the processed data data is returned to the WPS service in master node is stopped.
turn the processed information
n, each request generates a new node and takes ject suggests a new approach in the implementatio
ework (Figure 18).
36 ithms of GridGain in
nodes defined
data
Figure 18
The implementation of th 1. The service receiv 2. A master node is 3. The master node e 4. The number of par 5. The data are split 6. The algorithms an 7. Each node receive 8. Each node return a 9. The master node m 10. The merged data i 11. The WPS return th
This approach uses an e services. This node is init (Figure 19).
18. New GridGain approach in the 52North WPS framework
of this new approach follows these steps: receives the data
is searched
node establishes a communication with other nodes of parts in which the data will be divided is defined
split
ms and the data are sent to each node
eceives the algorithm and uses it to process the data eturn a result to the master node
node merges the processed data data is returned to the WPS service
turn the processed information
s an external master node to support the request is initialized adding some parameters in the Tomc
37 nodes
defined
data
38
Figure 19. Starting a GridGain node in Tomcat
5.4
Defining processes in the framework
The functions of the Geostatistical library are published as WPS services, in which the parameters and type of data supported by each function are defined. The WPS services with parallel functionalities should be configured with the GridGain capabilities. The lists of implemented services are:
6
This service allows for estimating the best parameters needed for a specific method of interpolation. The description of the service is found in the Appendix C.
• Inputs:
1. Data: WFS with GML and SHP%ZIP format 2. Field: Contain the attribute to do the interpolation
3. Method: Ordinary Kriging, Universal Kriging, IDW, RBF
• Outputs:
1. RMS: Error of the best method in the cross validation 2. StdRMS: Standardized Error
3. Correlation coefficient
4. Parameters: Parameters found.
5. Cross Validation Graph: URL with cross validation graph
39 0
This method executes the interpolation according to the method selected. The description of the service is found (Appendix D):
• Inputs:
1. Data: WFS with GML and SHP%ZIP format 2. Field: Contain the attribute to do interpolation
3. Method: This input receives a string with the method and parameters for executing the interpolation
• Outputs:
1. Result: WMS with reference to coverage on Geoserver 2. Duration: process duration
5.5
WPS client
The 52North OpenLayer WPS client is used to test the processes created, although some modification have been included into the Javascript client to support the GML 2.0 schema and the reference to one WMS service. The services created are not running correctly in this software due to problems in the WFS layer processing. When a WFS layer is loaded in the OpenJump and then used by the WPS extension, the extension does not recognize the attributes of the WFS Layer.
6.
0
The type of Cloud Computing platform needed for deployment of the WPS framework requires the support of Java libraries. The GAE platform does not support some libraries needed for deploying the parallel WPS.
40 instance for one year without any cost. This work uses this account to evaluate the performance of the WPS in the platform.
6.1
Cloud environment configuration in the AWS platform
The AWS requires creating a new account for accessing its resources. All resources used are administrated by this account, and its principal component is the console (Figure 20). In the process of creating of an account the security credentials have to be defined which allows it to be accessed through secure REST or using AWS service API.
This research work uses the credentials to control the servers created in the platform through Secure Shell (SSH), Secure copy (SCP) and the AWS API. The instances can be accessed through the following command lines:
• ssh %i credential.pem ec2%user@ amazon.server
• scp %i credential.pem file ec2%user@amazon.server:/home/ec2%user/
Figure 20. Console of the platform AWS