Treball de Final de Grau/Màster / Trabajo de Final de Grado/Màster
TÍTOL / TÍTULO / TITLE
WEB PROCESSING SERVICES FOR FORESTRY AND ENVIRONMENTAL APPLICATIONS
Autor/a / Autor/a/ Author: CONSTANCIO AMURRIO GARCÍA
Director/a / Director/a/ Supervisor: ÓSCAR BELMONTE FERNÁNDEZ Tutor/a o supervisor/a / Tutor/a o supervisor/a/ Co-supervisors: CHRISTOPH STASCH, MÁRIO CAETANO
Data de lectura / Fecha de lectura/ Date of Thesis Defense:
MARCH, 6th 2014
Resum / Resumen/ Abstract:
Nowadays spatial processing on the web is becoming a requirement for more and more web applications. The use of processes helps to find solutions to a wide range of spatial problems and extends the common functionality of Web GIS. There are many open source technologies that can be implemented in each component of a Web GIS application. Forestry and environmental problems, with their strong territorial implications, are especially suitable to be analysed applying these technologies.
In order to create an application with spatial processes, we propose a framework with a layered service-based architecture. It is layered because its structure is divided in a set of functional layers: the user layer (geoportal or client), the service layer (inside the server) and the data layer (spatial database). The access and processing of spatial data is accomplished through adequate service standards of OGC (Open Geospatial Consortium): Web Map Services (WMS), Web Feature Services (WFS), Web Coverage Services (WCS) and Web Processing Services (WPS).
We implement a complete forestry – related application from scratch that offers access, visualization, querying and processing of spatial data and an active user interaction. The key of the application is WPS. Additionally, other processing solutions (like making queries with the spatial database) are discussed.
In brief, this work presents an overview of the current technology and possible solutions for integrating spatial processes on the web and proposes some guidelines to implement them in a fully working system.
Paraules clau / Palabras clave/ Key words: Web GIS Applications, Forestry
W
EB
P
ROCESSING
S
ERVICES FOR
F
ORESTRY AND
E
NVIRONMENTAL
A
PPLICATIONS
W
EB
P
ROCESSING
S
ERVICES FOR FORESTRY AND
ENVIRONMENTAL APPLICATIONS
Dissertation supervised by
PhD Óscar Belmonte Fernández
PhD Christoph Stasch
PhD Mário Caetano
ACKNOWLEDGMENTS
I would like to express my gratitude to PhD Óscar Belmonte, PhD Christoph Stasch and
PhD Mário Caetano for the time dedicated to helping me and to reviewing this
document.
Special thanks to all my colleagues for making me spend this great time during last year
and a half. Thanks to all our teachers in Spain, Germany and Portugal. Of course thanks
also to Dori Apanewicz for the continuous support.
Finally, thanks to all the family for the personal and economical support during this
W
EB
P
ROCESSING
S
ERVICES FOR FORESTRY AND
ENVIRONMENTAL APPLICATIONS
ABSTRACT
Nowadays spatial processing on the web is becoming a requirement for more and more
web applications. The use of processes helps to find solutions to a wide range of spatial
problems and extends the common functionality of Web GIS. There are many open
source technologies that can be implemented in each component of a Web GIS
application. Forestry and environmental problems, with their strong territorial
implications, are especially suitable to be analyzed applying these technologies.
In order to create an application with spatial processes, we propose a framework with a
layered service-based architecture. It is layered because its structure is divided in a set
of functional layers: the user layer (geoportal or client), the service layer (inside the
server) and the data layer (spatial database). The access and processing of spatial data is
accomplished through adequate service standards of OGC (Open Geospatial
Consortium): Web Map Services (WMS), Web Feature Services (WFS), Web Coverage
Services (WCS) and Web Processing Services (WPS).
We implement a complete forestry – related application from scratch that offers access,
visualization, querying and processing of spatial data and an active user interaction. The
key of the application is WPS. Additionally, other processing solutions (like making
queries with the spatial database) are discussed.
In brief, this work presents an overview of the current technology and possible solutions
for integrating spatial processes on the web and proposes some guidelines to implement
KEYWORDS
Web GIS Applications
Forestry Applications
Environmental Applications
Spatial Process
Geographical Information System
Web Services
Web Processing Service
Web Map Service
Web Feature Service
Web Coverage Service
LiDAR
GeoServer
Postgresql
Postgis
OpenLayers
HTML
CSS
Ext JS
GeoExt
JavaScript
ACRONYMS
AJAX – Asynchronous JavaScript and XML
API – Application Programming Interface
AVP – Attribute Value Pairs
BBOX – Bounding Box
CGI – Common Gateway Interface
CRS – Coordinate Reference System
CRUD – Create, Read, Update and Delete.
C/S – Client / Server
CSS – Cascading Style Sheets
CSV – Comma-Separated Values
CSW – Catalogue Services for the Web
DEM – Digital Elevation Model
DOM – Document Object Model
ECMA – European Computer Manufacturers Association
EFDAC – European Forest Data Centre
EFFIS – European Forest Fire Information System
EPSG – European Petroleum Survey Group
GEO – Group on Earth Observations
GEOSS – Global Earth Observation System of Systems
GIS – Geographic Information System
GML – Geography Markup Language
GUI – Graphical User Interface
HTML – HyperText Markup Language
IGN – National Geographic Institute
IIS – Internet Information System
IP – Internet Protocol
JAI – Java Advanced Imaging
JSON – JavaScript Object Notation
JSP – JavaServer Pages
JSPTL – JavaServer Pages Template Library
JVM – Java Virtual Machine
LiDAR – Light Detection and Ranging
MIME – Multipurpose Internet Mail Extension
OGC – Open Geospatial Consortium
OSM – OpenStreetMap
POM – Project Object Model
REST – Representational State Transfer Protocol
SDI – Spatial Data Infrastructure
SLD – Styled Layer Descriptor
SOA – Service Oriented Architecture
SQL – Spatial Query Language
TCP – Transmission Control Protocol
UOM – Units of Measure
URI – Uniform Resource Identifier
URL – Uniform Resource Locator
WCS – Web Coverage Service
WFS – Web Feature Service
WFS-T – Web Feature Service Transactional
WPS – Web Processing Service
XHR– XMLHttpRequest
XML – Extensible Markup Language
INDEX
Acknowledgements………...II
Abstract………..………...III
Keywords………..……….……….…IV
Acronyms……….…V
1. Introduction ... 1
Overview ... 1
1.1. Thesis objectives ... 7
1.2. Dissertation organization ... 8
1.3. 2. State of the Art ... 9
3. Literature review ... 14
4. Application design ... 18
Basics of Web GIS technology ... 18
4.1. 4.1.1. Introduction ... 18
4.1.2. HTTP protocol ... 18
4.1.3. HTML, CSS and JavaScript ... 21
4.1.4. Server and Client technologies ... 21
4.1.5. Data exchange formats ... 22
4.1.6. Web Services ... 23
4.1.6.1. Web Map Service (WMS) ... 23
4.1.6.1.1. Introduction ... 24
4.1.6.1.2. HTTP request rules... 24
4.1.6.1.3. HTTP response rules ... 25
4.1.6.1.4. WMS Operations ... 25
4.1.6.2. Web Feature Service (WFS) ... 28
4.1.6.2.1. Introduction ... 28
4.1.6.2.2. WFS Operations ... 29
4.1.6.3. Web Coverage Service (WCS) ... 30
4.1.6.3.1. Introduction ... 30
4.1.6.3.2. WCS operations ... 30
Architecture ... 32
4.2. 4.2.1. Introduction ... 32
4.2.2. Architecture Principles ... 32
4.2.3. Components ... 34
4.2.4. Server – Client Workload distribution ... 36
4.2.5. Architecture summary ... 37
Scenario description ... 37
4.3. 4.3.1. Introduction ... 37
4.3.2. Study area ... 38
4.3.3. Features ... 39
Implementation of the application ... 41
4.4. 4.4.1. Technologies ... 41
4.4.1.1. Server technology: GeoServer ... 42
4.4.1.1.1. Introduction ... 42
4.4.1.1.2. GUI and Functionality ... 42
4.4.1.1.3. Performance and caching ... 44
4.4.1.1.4. Security considerations ... 45
4.4.1.2. Database technology: Postgresql / Postgis ... 46
4.4.1.3. Client technology: OpenLayers ... 48
4.4.1.3.1. Introduction ... 48
4.4.1.3.2. Procedure to set the application up ... 49
4.4.1.3.3. Coordinate Reference System ... 50
4.4.1.3.4. Third party mapping APIs ... 51
4.4.1.4. Other technologies ... 52
4.4.1.4.1. Ext JS ... 52
4.4.1.4.2. GeoExt ... 54
4.4.1.4.3. DualMaps ... 55
4.4.1.4.4. OpenWeatherMap ... 56
4.4.2. General organization of the application ... 56
4.4.3. Data... 57
4.4.3.1. Data directory structure ... 57
4.4.3.2. List of layers ... 58
4.4.3.2.1. Base layers ... 58
4.4.3.2.2. Operational Layers ... 59
4.4.3.3. Data CRS ... 59
4.4.4. Web Services implementation ... 60
4.4.4.1. Web Map Service implementation ... 60
4.4.5. Implementation of the functionality ... 61
4.4.5.1. Layers Panel ... 62
4.4.5.1.1. Layers Panel description ... 62
4.4.5.1.2. Layers Panel implementation ... 62
4.4.5.2. Map Display Panel ... 63
4.4.5.2.1. Map Display Panel description ... 63
4.4.5.2.2. Map Display Panel implementation ... 64
4.4.5.3. Toolbar ... 65
4.4.5.3.1. Toolbar description ... 65
4.4.5.3.2. Toolbar implementation ... 67
4.4.5.4. Geo-Processes Panel ... 69
4.4.5.4.1. Geo-Processes Panel description ... 69
4.4.5.4.2. Geo-Processes Panel implementation... 70
5. Web Processing Services ... 74
Introduction ... 74
5.1. Basics about WPS. The standard ... 75
5.2. 5.2.1. WPS operations ... 75
5.2.1.1. GetCapabilities WPS operation ... 75
5.2.1.1.1. WPS operation request ... 75
5.2.1.1.2. WPS GetCapabilities response ... 76
5.2.1.2. WPS DescribeProcess ... 77
5.2.1.2.1. WPS DescribeProcess operation request ... 77
5.2.1.2.2. WPS DescribeProcess response ... 79
5.2.1.2.3. Types of data inputs and process outputs ... 80
5.2.1.3. WPS Execute ... 81
5.2.1.3.1. Execute request parameters ... 81
5.2.1.3.2. WPS exceptions ... 82
Implementation of the processes. Results ... 82
5.3. 5.3.1. Introduction ... 82
5.3.2. WPS clients implementations ... 83
5.3.3. Guide for creating and using WPS ... 85
5.3.4. GeoServer WPS ... 86
5.3.4.1. Using existing processes: Request Builder ... 86
5.3.4.2. Creating new Processes ... 87
5.3.4.2.1. Java-based Processes ... 87
5.3.4.2.2. Scripting-based Processes ... 89
5.3.5. Developed WPS Processes ... 89
5.3.5.2. Process 2: Buffers ... 92
5.3.5.3. Process 3: Vegetation description ... 95
5.3.5.4. Process 4: Road description ... 99
6. Discussion and conclusions ... 106
Discussion ... 106
6.1. Main conclusions ... 107
6.2. 7. Further work ... 110
8. References ... 113
Appendix A. Data.
INDEX OF FIGURES
Fig. 1.- INSPIRE technical architectural overview (INSPIRE, 2007) ... 3
Fig. 2.- Viewshed calculation in Terrasit. Comunidad Valenciana SDI. ... 10
Fig. 3.- Buffer tool in Cartoweb (Comunidad Valenciana) ... 10
Fig. 4.- View of OTALEX WPS Client ... 11
Fig. 5.- Route calculation using WPS in CartoCiudad ... 12
Fig. 6.- Spatial Analysis tool of IGN ... 13
Fig. 7.- European Forest Data Centre Viewer ... 17
Fig. 8.- Example of a GET HTTP request header information ... 20
Fig. 9.- GetCapabilities request response example ... 27
Fig. 10.- GetMap request response example ... 28
Fig. 11.- GetFeatureInfo request response ... 28
Fig. 12.- WFS POST request ... 29
Fig. 13.- WFS Server response ... 30
Fig. 14.- Architecture of the application. Source: Author. ... 34
Fig. 15.- Study area. Source: Author. ... 39
Fig. 16.- GeoServer Administrative Interface ... 42
Fig. 17.- PostGIS geometry hierarchy (OGC, 2010) ... 46
Fig. 18.- Processing with PostGIS. Source: Author. ... 48
Fig. 19.- Definition of EPSG: 3857 ... 51
Fig. 20.- Structure of the GUI using Ext JS BorderLayout. Source: Author. ... 53
Fig. 21.- DualMaps example ... 55
Fig. 22.- OpenWeatherMap example ... 56
Fig. 23.- View of layers panel ... 63
Fig. 24.- Some images of the editing process ... 64
Fig. 25.- Transparency slider ... 71
Fig. 26.- LiDAR data integration in OpenLayers ... 72
Fig. 28.- Response of a GetCapabilities document ... 76
Fig. 29.- Simple process description in the capabilities document ... 77
Fig. 30.- Example of DescribeProcess response ... 78
Fig. 31.- Decision tree for creating and using WPS. Source: Author. ... 86
Fig. 32.- WPS Request Builder ... 87
Fig. 33.- Polygon to calculate statistics ... 92
Fig. 34.- Tools and Results panel ... 92
Fig. 35.- Buffer tool configuration ... 95
Fig. 36.- Buffer around a polygon geometry ... 95
Fig. 37.- National Forest Map ... 98
Fig. 38.- Vegetation description result table ... 99
Fig. 39.- Structure of the road description process. Source: Author. ... 100
Fig. 40.- Roads and polygon to calculate the statistics ... 105
Fig. 41.- Road statistics result ... 105
INDEX OF TABLES
Table 1.- WMS GetCapabilities request parameters (OGC, 2006) ... 25
Table 2.- WMS GetMap request parameters (OGC, 2006) ... 26
Table 3.- WMS GetFeatureInfo request parameters (OGC, 2006) ... 27
Table 4.- WCS GetCoverage request parameters (OGC, 2006) ... 31
Table 5.- WPS GetCapabilities request parameters (OGC, 2007) ... 76
Table 6.- WPS DescribeProcess request parameters (OGC, 2007) ... 78
Table 7.- WPS response (OGC, 2007) ... 79
Table 8.- WPS types of data (OGC, 2007) ... 80
Table 9.- WPS Execute parameters (OGC, 2007) ... 82
1.
I
NTRODUCTION
O
VERVIEW1.1.
Since the normalization of the Internet use in the early 1990s, fundamental changes
have happened in the way businesses are done. In this regard, Geographic Information
Systems (GIS) are not an exception. The article “What is Web 2.0” (O’Reilly, 2005)
explains three main characteristics that define the recent evolution of the web, what
the author calls Web 2.0. First of all, the user-generated content. Nowadays, the
workflow starts at the bottom (users) and comes up to construct the web. Second,
the consideration of the web as a platform in which actions are performed using web
services. Finally, in the Web 2.0 there is a rich user experience: the look of the new
web applications helps to an easy understanding of their use and calls to the
interaction. All these characteristics can be applied to GIS, opening up a world of
possibilities. In this document Web GIS is understood basically as the use of GIS on
the web.
In parallel to web development, users have also evolved. As they make use of the
web, they also request more advanced services, demand higher quality information
and become more exigent. In the GIS field, this process has gone together with the
publication of web cartography, which increases every year. Nowadays we have a
variety of data available for the user in the national and regional Spatial Data
Infrastructures (SDIs). The publication usually follows the standards for web services
of Open Geospatial Consortium (OGC).
Visualization of geospatial data on the web is accomplished and supported efficiently
thanks to the use of Web Map Services (WMS). But what happens when the user
wants to go further, and perform analysis? In this case the situation changes
drastically. The development of Web Processing Services (WPS), services that allow
processing on the web, is not so widely spread. The data published by the Spanish
SDI illustrates this situation: at this moment (January 2014), 1754 WMS are available
Due to its territorial and geographical connections, forestry and environmental sectors
have used GIS techniques from the origin of this technology. The use and analysis of
geospatial data is a basic step that is implemented in every project within these fields.
The triple function of forestry / environmental sector, that includes natural, economic
and social perspectives, normally with an important geographical component, is very
suitable to be studied using GIS. In terms of availability of information, the effort
made by the Public Administrations in last years has been decisive. But again there is
a lack of high quality processing services that allow the user to go a step further and
perform some advanced analysis on the existing data.
Bringing processing capacity to the user has some implications if we want to obtain a
good user experience. First of all, the processes should be easy to use. The audience
can be very broad, including those users that want information about forestry /
environment but may not know about GIS. The Graphical User Interface (GUI)
should hide the system complexity and present only the necessary options to set the
tools up. Next, users should interact with the underlying system. That means the
user is qualified to get different results depending on his or her own inputs. Finally,
the system has to adapt to the user: a citizen (i.e. a forest land owner) that needs an
answer to a simple question or a scientist that wants to implement a complex model,
etc.
Web GIS technologies are an engaging option, with many benefits: they do not
require installation, the administrators do the updates (the user does not have to worry
about that), users can enjoy the potential of the web (as, for example, in sharing
contents or user interaction) and the usability is equivalent to desktop-based
applications.
The technical basic structure for Web GIS applications is based in a communication
process between a web client and a web server. Typically a client starts the
communication sending a request to a server, the server processes the information and
returns an answer back to the client. This is accomplished through the Hypertext
Transfer Protocol (HTTP) and this architecture is called client / server (C/S). In this
desktop-based systems: discovery of data, access and visualization, transformation
and processing. In order to achieve interoperability, these different services (like map
services, data services or analytical services) are implemented using OGC standards.
This project focuses in developing a Web GIS application totally based in standard
OGC services. The application is used as a client to perform analysis on the web,
using Web Processing Services. Its architecture is based on INSPIRE SDI directive
(INSPIRE EU Directive, 2007), specifically the INSPIRE Technical Architecture
Overview Document (INSPIRE EU Technical Architecture Document, 2007). This
document defines a layered architecture for Web GIS applications: the presentation
layer, with the GUI; the service layer, that includes these types of web services:
registry, discovery, view, download, transference and invoke spatial data services and
finally the data layer, that manages the spatial datasets, service metadata and
registers (Fig. 1).
Fig. 1.-INSPIRE technical architectural overview (INSPIRE, 2007)
In our implementation, the presentation layer consists in the creation of a complete
GUI. The entire client – server logics is managed using OpenLayers1, a powerful mapping library. Services included in the service layer are stored in a geographical
server (GeoServer2). Finally, the data is stored in a spatial database (PostGIS3). As these technologies illustrate, this project develops a Web GIS application through
open-source software.
The application uses the necessary OGC standards to accomplish the expected GIS
tasks. WMS for map display, visualization and query; Web Feature Services
Transactional (WFS-T) to send and retrieve vector data to the spatial database; Web
Coverage Services (WCS) to receive raster data from the server, and of course WPS
for processing. WPS is the core of the application and sometimes it needs other
standards to supply the input data the process needs, or to store the results. In this
document, we refer to processing (or geo-processing) as synonymous of analysis (or
spatial analysis), like the tasks applied in order to ask questions and derive insight
from spatial data.
It is worth to note that pure WPS use is a good choice to execute geo-processes on the
web, but other options are also available. One example is Spatial Query Language
views (SQL views). PostGIS, the spatial database, has powerful spatial query
capabilities through SQL. Based on this, we can create a result (an operation, a new
layer, etc.) coming from a query execution. These queries support a wide variety of
processing tasks as raster processing, topological analysis, spatial analysis, data
transformation, reference system management, etc. Other option is the use of
rendering transformations. Basically this technology applies a filter function to the
geometry (on the server side) before rendering it. That allows some kind of processes
“on the fly” thanks to the Styled Layer Descriptor language (SLD). This language is
intended to modify the symbology of layers. The use of a transformation function
allows passing arguments to it, getting as result a change in the final rendering. An
example of a rendering transformation could be contour extraction of a vector layer.
1
http://openlayers.org [accessed January 15th 2014]
2
http://geoserver.org [accessed January 15th 2014]
3
We can change the contour style (and thus we can show up only a selection of
contours) using a SLD transformation function.
Last option for processing is through scripting. Thanks to an extension, the server
technology manages many different scripting languages like Python, JavaScript or
Groovy. It provides a number of extension points, called “hooks”, that are different
ways to plug in functionality via a script. For example, there is a hook that provides a
way to make scripts runnable as a WPS process.
These different processing options are taken into account in some Sections of this
document, including also some examples of them, although pure WPS processes with
Java are the ones that are widely studied. WPS standard defines a framework for
executing almost any kind of computation. Some useful computations come “built-in”
with the server extension functionality. Others have to be programmed. In fact, in
GeoServer a WPS process is a Java class with an execute method. This method’s
parameters correspond to the WPS parameters, and it returns the output of the process.
In order to help the programming process, there is a GIS library called GeoTools4 that is used by the server to build the processing classes with few lines of code. The
application develops 4 different processes, including chaining of existing processes.
LiDAR (Light Detection and Ranging) data defines a point cloud with pulses of the
terrain representing not only the surface but also the elements that are on it (like
buildings, vegetation, infrastructures, etc.). Every pulse collects the coordinates
(including Z), the RGB components of the reflection, the reflection order (first return,
second return, etc.), the time and angle, etc. It is a very interesting technology to get
complete information about the vegetation (like bush height, tree height, density,
coverage, etc.). Thus, the technology has many different uses in forestry. LiDAR data
management and processing using WPS is still in development. The nature of these
data hinders an easy implementation (like the high data volume), but some works are
in progress (Lanig et al., 2009). Nevertheless, to study how to integrate this
technology in Web GIS applications, we propose a pilot project that uses SQL
queries to process LiDAR data. This project is not integrated in the final application
implementation, but this document presents a procedure to work with this kind of data
using the spatial database.
The different parts of the application are described with full detail in this document.
As result, we have a complete explanation of its architecture and implementation,
adequate for a wide range of forestry / environmental purposes, which develops from
T
HESIS OBJECTIVES1.2.
The main objective of this work is to define the architecture and to describe and
to realize the implementation of a Web GIS application with spatial processes
whose intended use is forestry / environmental related.
This main objective can be divided into these narrower sub-objectives:
1. To define an architecture for Web GIS applications considering as
reference the layered structure of INSPIRE Technical Architecture Overview
Document (INSPIRE EU Technical Architecture Document, 2007).
2. To make a study of the current state-of-art of processing on the Web: what
technologies are used, how they are combined together, what are the
bottlenecks in processing, what are the guidelines for further works, etc. In
general, to have a detailed description of what is the actual situation and what
is the presumable future evolution.
3. To define the architecture for WPS adapted to forestry / environmental
purposes and following the principles of interoperability, modularity and
reusability for the different components that participate in the spatial
processes.
4. To implement a Web GIS application according to the architecture defined
in (1) and using open source software.
5. To implement a set of WPS according to the architecture defined in (3),
using open source software.
D
ISSERTATION ORGANIZATION1.3.
The structure of this document consists of eight chapters: Introduction, State of the
Art, Literature Review, Application Design, Web Processing Services, Conclusions,
Further Work and References. There are also two appendices: Appendix A: Data and
Appendix B: JavaScript code.
State of the Art chapter makes a revision of a selection of works and applications that
are widely used today in Spain and that implement some kind of spatial processing. In
most of the cases these works refer to the development of SDIs. Literature Review
chapter summarizes the most important points of a selection of literature references
that have inspired this work.
Application design chapter brings together all the aspects related with both the
architecture and the implementation of the application. It defines the basics about web
technology (necessary to understand the whole), the scenario description and the
architecture definition. Then it moves to the implementation through the description
of the technologies, the organization of the application, the data, the coordinate
reference systems (CRS) management and the functionality of each component.
Web Processing Services chapter describes the WPS standard through the description
of its operations and the detailed study of every implemented process.
Conclusions chapter describes the problems and achievements of this work (including
a discussion) and Further work chapter makes some comments on things that have not
been developed due to time restrictions and that will be interesting to consider in other
future works.
Appendix A describes the datasets used in the application and Appendix B contains the
JavaScript code included in the main HTML file and that performs the main
2.
S
TATE OF THE
A
RT
During last years, there has been an important increment in the number of Web GIS
applications. This situation has evolved jointly with the development of national,
regional and local SDIs. Each one normally provides some kind of viewer, where the
user can look for the available information, display the data and perform some easy
tasks (like measuring or querying the coordinates). This Section presents a brief
description of some forestry /environmental applications on the regional (Comunidad
Valenciana mainly, where this project takes place) and national (Spain) levels. The
reason of this selection is that our project takes place in an area inside Comunidad
Valenciana and it is a way to narrow the long list of available applications. The ones
presented here are well known by the users because they belong to important
institutions and national organizations. The list is not exhaustive. Nevertheless, since
WPS and processing on the web is still barely spread as technology, it is difficult to
find examples of spatial processing capabilities. What we normally find is an
application that has some isolated processing implementation. For each application we
make a brief description about what it is, what technology it uses and how spatial
processing is implemented.
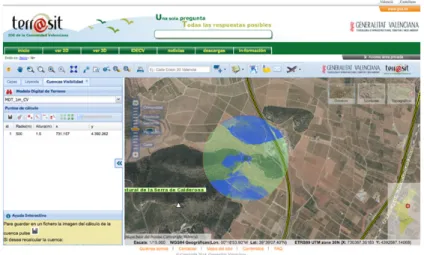
Terrasit (Comunidad Valenciana)
Terrasit5 application is the front-end of the regional SDI of Comunidad Valenciana
region. It allows loading official cartography published by different regional public
administrations. It can load also external WMS and WFS services. It has a complete
set of tools for viewing and querying information. The implementation uses open
source software: OpenLayers as mapping library and ExtJS and JQuery for the GUI. It
has a unique spatial process implementation: viewshed calculation. The user
introduces a point somewhere on the map and the server calculates the viewshed from
that point. The tool has a list for selecting the base Digital Elevation Model (DEM) to
calculate the viewshed from.
Fig. 2.-Viewshed calculation in Terrasit. Comunidad Valenciana SDI.
Cartoweb (Comunidad Valenciana)
Another interesting public Web GIS project in Comunidad Valenciana is the viewer
of the Environmental and Forestry Public Administration (Conselleria de
Infraestructuras, Territorio y Medio Ambiente). This project is called Cartoweb6. Its
functionality is similar to the previous one, but the list of available environmental
information is more exhaustive. The application uses the JavaScript Application
Programming Interface (API) of ArcGIS. There is only one spatial process (buffer
calculation). The user selects any feature of any layer of the map (like a building or a
road) and the server returns a user-defined buffer and a list of features within that
buffer.
Fig. 3.-Buffer tool in Cartoweb (Comunidad Valenciana)
6
OTALEX Project (Junta de Extremadura)
OTALEX7 Project is the most complete WPS client in Spain. It is an open source
software solution that supports the regional SDI of Extremadura Region. It acts like a
viewer, but it has also various powerful tools like editing, WFS management, social
networks integration, etc. But maybe its main feature is the WPS client. It is based on
52ºN WPS JavaScript client and it contains a list of more than 230 different processes
of many types: from data management, conversions, spatial analysis, statistics
calculations, etc. The mapping library is OpenLayers and the GUI is programmed
with ExtJS. The idea of a project like this is highly interesting, but it has some
dysfunctions: the different tools are not well documented and thus it is difficult to
know how to use them, the usability is improvable and most of the time the processes
do not work properly.
Fig. 4.-View of OTALEX WPS Client
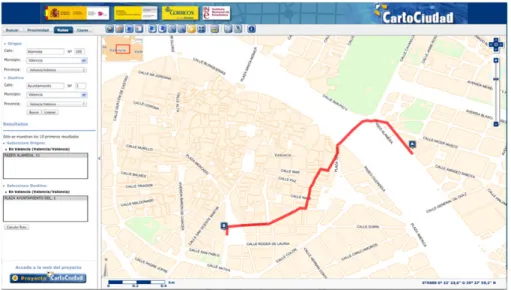
CartoCiudad (IGN)
CartoCiudad8is a national collaborative project for production and publication of web
services with this information: street network, urban cartography, toponymy, ZIP
codes and census districts. The National Geographic Institute (IGN), in coordination
with other Public Administrations, leads it. The project has developed a public viewer
where a set of OGC services is implemented (including WPS). It uses OpenLayers as
mapping library as well. The tool uses OGC WPS specification version number 0.4.0
7
and implements the following processes: route calculation between two or more
points, buffer calculation, points of interest finding tool and inverse geocoding tool.
Fig. 5.-Route calculation using WPS in CartoCiudad
Spatial Analysis tool (IGN)
From the existing applications made by the National Administration, this is the most
complete one in terms of number of WPS. Its name is Spatial Analysis Tool9 and it
has been created by IGN, in collaboration with universities and private companies. It
connects to services that offer environmental data and perform spatial analysis on that
data. To do that the application supports WMS, WCS, WFS and WPS OGC
specifications. This is an open source software solution. The mapping library is,
again, JavaScript. The list of implemented processes is: query of altitude data, query
of slope data, query of aspect data, profiles calculation, visibility maps and spatial
analysis statistics. It is worth to highlight that during the testing operations, the
application throws multiple errors in different browsers environments, so it is not
working properly.
9
Fig. 6.-Spatial Analysis tool of IGN
This is only a selection of all the currently available Web GIS applications, but it is
representative of the state of spatial processes on the web (in the Spanish level). This
state of the art shows how there is still big room for improving different aspects like
easy access of processes, good documentation, performance, downloading of results,
etc. The different solutions are or too limited (only one spatial process) or too wide
(many spatial processes coming from adaptations of other existing clients, with
3.
L
ITERATURE REVIEW
There are plenty of works and scientific papers related to WPS architectures and
implementations. In this Section we present a selection of some interesting references
to WPS projects that are directly and indirectly related to forestry or environment.
eHabitat project (Dubois et al., 2013) designs and implements environmental-related
spatial processes. The paper basically presents a WPS for computing the likelihood of
finding ecosystems with equal properties to those specified by the user. The problem
to solve is ecological niche modelling for a given species by introducing a set of
environmental variables. They explain the Mahalanobis distance as approach to
compute similarity to a reference location. But the interesting part for this work is the
WPS architecture and how it is implemented. WPS implementation is done using
PyWPS (a lightweight Python based framework). Input data is managed using OGC
standards. Boundaries can be either defined by the users or derived from a database of
polygons representing protected areas. This is one of the key features of this
application: the use of interoperable standards for data access and for process
execution eases model chaining and integration. The calculation of the Mahalanobis
distance itself is done using the R statistics language. The process finally works as
usual, a WPS execute request is sent to the WPS server. Then the results are processed
to generate different output formats. The paper presents two use cases: ecological
forecasting in the Tassilli n’Ajjer Unesco site and ecological forecasting of birds
ranges. As summary, the interest of this paper lies in the proposal of a simple and
easily extensible model that uses WPS in combination with other OGC standards. Its
versatility allows it to be used within different contexts and workflows. Despite the
availability of WPS for modelling, few practical implementations exist and e-Habitat
makes a significant addition to the field.
The design and implementation of web modelling, as a combination of chained WPS
processes, is a challenging topic. One excellent example is the hydrological modelling
processes description made in Díaz et al. (2010). This paper presents the architecture
and the implementation for constructing chained WPS in hydrology. These processes
(INSPIRE EU Directive, 2007). Compared to other solutions, this one allows users to
interact directly with the underlying hydrological model (changing the settings of the
WPS) and allows users to load specific datasets of interest. The architecture is defined
using layers: a presentation layer, which manages the user interface and the
interactions; a horizontal service layer, that allows the description and implementation
of the components (as for example the WPS client to run models); the service layer
that include all the OGC services and finally the data layer, which holds the spatial
data and the metadata. The service layer implements: discovery services (through an
open source implementation of a Catalogue Services for the Web - CSW
specification), view services (through MapServer WMS standard, including chart
services, necessary in hydrological modelling, and implemented using the OGC WPS
interface), download services (through the OGC WFS), transformation services (of
coordinates and data, all of them using the WPS interface too) and finally the
Processing Services, of course implemented with WPS OGC. Regarding processing
services, the paper presents a strategy that starts defining very simple processes,
chaining them to construct more complex ones. The more complex the processes are,
the less reusable they are. As summary, this paper has been very helpful and some of
its assumptions have been used in the present work. The main goal to keep in mind is
that processes and models in the web have to adopt a new paradigm for scientist
working in a distributed and remote environment in order to reuse and share
geospatial resources.
Similar to the previous paper is the work of Granell et al. (2009) about
service-oriented applications for environmental models. The topic is the same in both studies,
but in the latter the descriptions are more discursive. The AWARE project description
is the main goal of the paper. It is a project to offer online geospatial processing
services to help monitor and forecast water resources derived from specific quantity
and distribution of snowmelt in alpine regions (Granell et al., 2009). The architecture
is based on the layer structure explained above, but including in this case the full
explanation of every module included in the project. The interest of the approach lies
in the definition of an architecture that allows interoperability, reuse and a
compromise in the performance of an application for environmental modelling, basing
Finally, there is an article that summarizes the actual situation of web services in
forestry (Bastin et al., 2012) in line with INSPIRE and Global Earth Observation
System of Systems (GEOSS10) frameworks. GEOSS belongs to the Group on Earth
Observations (GEO), formed by the European Union and other nations and
international organizations. Its aim is to build a common interface to link together
different observing systems around the world. Forestry is one of the areas of interest
inside GEOSS. The article explains how forest data is compiled in a Pan-European
level through the European Forest Data Centre11 (EFDAC), which incorporates the
European Forest Fire Information System12 (EFFIS). At a global scale, TREES-3
Action of Joint Research Centre supplies data addressed specifically to study land
cover change over time. All this information is disseminated using web services:
WMS, WFS, WCS and used within web-based modelling activities (WPS). One
example of web client for managing this information is the EuroGEOSS13 project
Web Map Viewer, which allows the control of some WPS. TREES-3 project validates
the information from experts using a browser-based tool. But the interesting elements
come with the WPS examples. The study explains three cases: the eHabitat project
(described above) and two more. The second is about forest fire monitoring in
protected areas: the service provides direct access to EFFIS in the Iberian Peninsula
and returns the impact of forest fires in previous user-selected areas. The third is about
monitoring forest change. It analyses the extent of a gain, loss or stability of forest
areas between years 2000 and 2006 and returns a thematic map with statistical graphs.
10
http://www.earthobservations.org/geoss.shtml [accessed December 2nd, 2013]
11
http://forest.jrc.ec.europa.eu/efdac/ [accessed December 2nd, 2013]
12
http://forest.jrc.ec.europa.eu/effis/ [accessed December 2nd, 2013]
13
4.
A
PPLICATION DESIGN
B
ASICS OFW
EBGIS
TECHNOLOGY4.1.
4.1.1. I
NTRODUCTIONThis first Section is an introductory part about what Web GIS technology is, which
elements a Web GIS application needs, how are these different elements related, etc.
The aim is to establish the basic concepts to contextualize the other Sections and
make their understanding easier.
In a broad sense, we define Web GIS as a GIS that uses web technology (Fu and
Sun, 2011). The main principle of this technology is the communication between a
Web GIS server and clients of few types (normally web browsers, but also desktop
and mobile clients). The communication is performed using the Hypertext Transfer
Protocol (HTTP) created by the researcher Berners-Lee in the 90s. Understanding
this protocol is crucial in the development process and it is explained in detail in next
Section.
4.1.2. HTTP
PROTOCOLIn a regular communication process through the HTTP protocol, the user starts
sending a request to the server (by typing a Uniform Resource Locator, or URL)
using a client (normally a web browser). The server receives the request and processes
it. That normally generates a response back to the client. The client receives the
response that is shown to the user.
Technically, HTTP conducts the delivery of network resources. The term resource
refers here widely to any element like text, query results, images, etc. that can be
delivered. Usually HTTP takes place through what is called TCP/IP sockets. A
socket is an endpoint of a process communication flow across a computer network.
Transmission Control Protocol (TCP) sockets of Internet Protocol (IP) allows the
network. Web browsers use the TCP/IP when they connect to servers on the World
Wide Web (WWW) in the general structure of a client-server (C-S) model.
Therefore HTTP protocol is the basic element to control communication between
server and client. It can be defined as simple, stateless (after the response, the
connection between server and client is typically dropped by means of reducing the
load of the server) and flexible (allows the transmission of any type of data object,
including spatial data).
The structure of an HTTP transaction is well defined and it follows a formal
request format. Its elements are an initial request line, zero or more header lines, a
blank line and an optional message body (Marshal, 2012):
The initial request line has this structure: METHOD NAME (space) PATH TO URL (space) HTTP VERSION. The METHOD is the kind of request that
the user wants to do to the server. HTTP defines eight methods: GET, POST,
HEAD, PUT, DELETE, TRACE, OPTIONS and CONNECT. Usually, for
Web GIS applications, both methods GET and POST are used. GET requests
data from a specific resource (it is used for viewing something), while
POST is used to submit data to be processed to a specific resource (it is used
for changing something). The PATH TO URL indicates how to access the
resource. URL is a subset of a Uniform Resource Identifier (URI). The
HTTP VERSION has this format in uppercase: “HTTP/x.x”, where x.x is the
version used of the HTTP protocol.
Header lines. These lines provide information about the requests, the responses or the object sent in the message body. HTTP 1.1 defines 46
headers. As stated in the specification (W3C, 1999) these fields act as request
modifiers, with semantics equivalent to parameters on a programming
language method invocation.
Message body. This part contains a set of data sent after the header lines and
Once the request has been processed, the server returns the initial response line (also
called status line) that basically indicates using a code system whether the request
was correctly managed or not. The format of the status line is: HTTP/x.x CODE
REASON. HTTP/x.x indicates the version of the HTTP protocol. REASON is a text
in English describing the status code. CODE field is a three digits integer. The first
digit indicates the category of the response:
1xx: indicates an information message.
2xx: indicates success.
3xx: redirects to another URL.
4xx: indicates an error on the client side.
5xx indicates an error on the server side.
A typical example of the status code is: 200 OK (means that the request succeeded) or
404 Not found (the requested resource does not exist). Web services follow the HTTP
protocol to send and receive information between the server and the client. It is
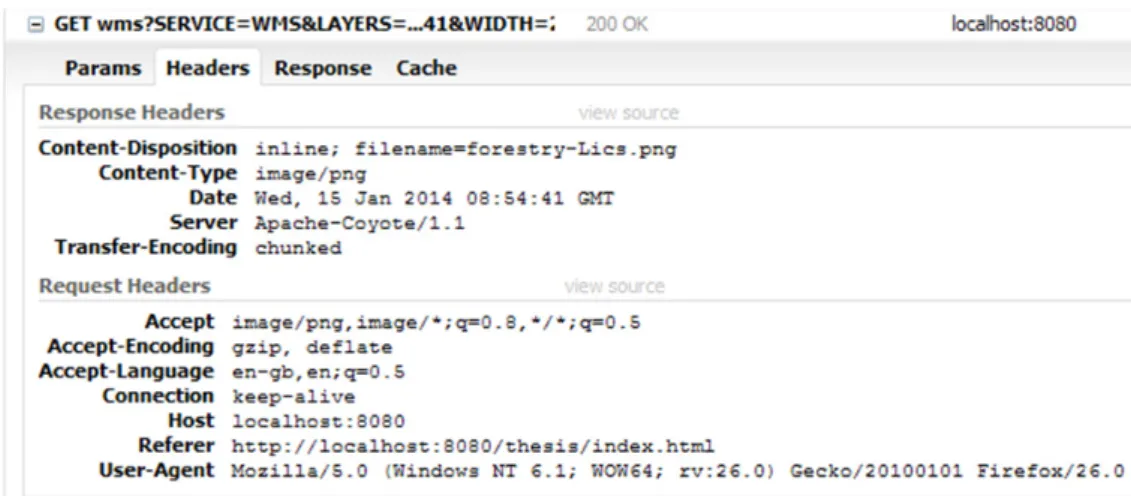
helpful to know the structure of the HTTP request in order to interpret the
communication flow and the problems that could arise.
Fig. 8.-Example of a GET HTTP request header information
In Web GIS the HTTP requests are usually sent by JavaScript code. When this
programming language is used, a common request is XMLHttpRequest (XHR). This
API allows sending the requests to the server (coming from the script), and loading
GIS is in WFS. The possibility to introduce modifications in the script using XHR can
led to security problems. Due to these security restrictions, it is not possible to retrieve
information from remote domains via this kind of request. To be able to do that, we
need to install a proxy host. It is a program that acts like an intermediary between the
server and the client. The requests are sent to the proxy and then the proxy forwards
the request to the server. This fact is taken into account in our implementation.
4.1.3. HTML,
CSS
ANDJ
AVAS
CRIPTHypertext Markup Language (HTML) is still the main language for creating web
pages and the basic structure for web technologies. The language is basically plain
text with a set of tags (markup). These tags define the content, the layout and the
formatting information of the web page. A good practice is to separate the content
from the layout. To do that, we use Cascading Style Sheets (CSS). Plain HTML is
not enough to work with Web GIS technologies. In fact, in order to enhance the user
experience, JavaScript is now the key element of these applications. That supposes the
movement from a web page paradigm to a web application paradigm. HTML is still
necessary as entry point to the application from a browser and to include the
references to the JavaScript code and CSS resources but JavaScript code is now
responsible of the application initialization and GUI definition.
4.1.4. S
ERVER ANDC
LIENT TECHNOLOGIESServer technology must comply with HTTP specifications and accordingly knows
how to manage the communication flow with clients. There are different kinds of
server technologies that can be used as Internet Information Services (IIS), Apache
Web Server, Oracle/Sun Java System Web Server, IBM WebSphere Web Application
Server, etc. We choose Apache Web Server 2.214 as Server technology. The reasons
are:
It is free and open-source.
It is very powerful, flexible and HTTP/1.1 compliant.
It is the most used server worldwide (NetCraft, 2013).
It manages object relational databases, needed for Web GIS.
It allows setting up files, like Common Gateway Interface (CGI) scripts (proxy host script).
The use of Apache Server is a necessary but not a sufficient step. We also need a
servlet container for Java code. In this regard we use Apache Tomcat15, which implements both Java Servlet and JavaServer Pages (JSP). That means the server-side
programming technology is Java.
From the client side, the software application is the Web Browser. Other clients exist,
but they are not considered in this work. Web browsers know how to communicate
with web server technology, how to display HTML, how to manage CSS styles and
how to execute JavaScript code. The browser is a choice of the user, so the application
has to be tested in the most used ones (basically Mozilla Firefox, Google Chrome,
Apple Safari and Microsoft Internet Explorer). Together all these browsers represent
(January 2014) the 96.7 % of browser usage16. We have already emphasized that
JavaScript is the scripting language that is used to create the GUI and to get
interactivity. To complement JavaScript there is a set of web development techniques
called AJAX (Asynchronous JavaScript and XML). The aim of AJAX is to allow an
asynchronous user interaction with the application (independent of the communication
with the server). Users interactions (that generate HTTP requests) are sent to what is
called the AJAX engine. Any response to a user action does not require going to the
server and the engine handles it instead. If the engine needs extra information, it
makes the requests asynchronously (normally using Extensible Markup Language,
XML) without delaying the user, improving the user experience this way.
4.1.5. D
ATA EXCHANGE FORMATSThe two most used data exchange formats for Web GIS are XML and JavaScript
Object Notation (JSON).
15
http://tomcat.apache.org [accessed October 21th, 2013]
16
XML is a markup language that encodes documents in both human-readable and
machine-readable way. It is defined in the XML 1.0 Specification of W3C (W3C,
2008). The main advantages of XML are its simplicity, its well-defined structure (and
thus its easy validation) and the facility to understand the content. The main drawback
is the use of closed tags, making parsing with JavaScript not efficient.
JSON interchange format is more efficient to parse than XML because it is lighter. It
is also human-readable but uses attribute-value pairs (AVP) instead of tags. It is
defined in the European Computer Manufacturers Association ECMA-404 standard
(ECMA, 2013). There is a variation of JSON for encoding geographic data structures
called GeoJSON17. It is not a standard, but it is useful in Web GIS applications. It can represent Point, LineString, Polygon, MultiPoint, MultiPolygon and
GeometryCollection geometries.
4.1.6. W
EBS
ERVICESWeb services, as defined in Fu and Sun (2011), are programs that run on a web server
and expose programming interfaces to other programs on the web. To fulfil the
functions any Web GIS application should have (data visualization, querying,
analysis, etc.) we use web services. The scope of this Section is to explain the main
content of the different web services standards. This information is basic to
understand the application implementation. All the standards are published on the
OGC website18.
4.1.6.1.WEB MAP SERVICE (WMS)
Web Map Service (WMS) standard implementation specification document (OGC,
2006) contains the full detail of this web standard. This service is used for showing
the cartography through images.
17
4.1.6.1.1.INTRODUCTION
The scope of this service is to produce maps as a digital image, suitable to be
displayed on a screen. This means that the map does not contain spatial data itself but
an image in one of a set of possible formats (like PNG, GIF or JPEG, among others).
To access maps, the user invokes a request using HTML through an URL. But in our
architecture the user does not need to write the request because the complexity is
hidden and the user only needs to activate and deactivate layers in a user-friendly
way. This standard conforms the main way to visualize maps. Additionally, the
standard defines two “types” of WMS: basic and queryable. As expected, in the
second case the user can query the attributes of the map. Latest version standard is
1.3.0.
4.1.6.1.2.HTTP REQUEST RULES
Both GET and POST methods can be used to request a WMS resource, but GET
method is mandatory while POST method is optional. GET requests URLs that are
built using reserved characters. These characters are (OGC, 2006):
? indicates the start of the query string.
& defines the separation between parameters in a query string.
= is the separator between name and value of a parameter.
, (comma) is the separation between individual values in list-oriented parameters.
+ is a shorthand representation for a space character.
The general structure for the request is a URL prefix (including the schema like
“http”, the hostname, port, path, etc.), the mandatory question mark “?” and the
optional string with parameters ending in an ampersand “&”. In order to compose a
query request, the client appends the mandatory request parameters and any optional
parameters as name/value pairs in the form “name=value&”, being the ampersand the
separator between different parameters. These rules are applicable to all the standards
4.1.6.1.3.HTTP RESPONSE RULES
Once the server receives the HTTP request, it sends back a response or a service
exception if it is unable to respond correctly. A Multipurpose Internet Mail
Extension (MIME) type accompanies the response object. It is always a file
containing text or a map image. The list of output formats is the following: GIF, PNG,
JPEG, TIFF, SVG and WebCGM.
4.1.6.1.4.WMSOPERATIONS
The standard defines three operations:
GetCapabilities. It is a mandatory operation that returns the service metadata
in a machine-readable and human-readable way. The request parameters can
be checked in Table 1.
Mandatory parameters
Name Value Description
SERVICE WMS Indicates the service type
REQUEST GetCapabilities Indicates the request name
Optional parameters
Name Value Description
VERSION VersionNumber Request version
FORMAT MIME_type Output format of service metadata
UPDATESEQUENCE String Sequence number or string for cache control
Table 1.-WMS GetCapabilities request parameters (OGC, 2006)
The response of this operation is a XML document containing the service
metadata. These metadata are (selection of the output): name, title, online
resource, abstract, keyword list, contact information, layers (there are as many
descriptions as layers), styles, Coordinate Reference System (CRS), bounding
box, scale denominators, etc.
GetMap. It is the mandatory operation that returns a map. The mandatory and
Mandatory parameters
Name Value Description
VERSION 1.3.0 The requested version
REQUEST GetMap The requested operation name
LAYERS layer_list Comma-separated list of one or more map layers
STYLES style_list Comma-separated list of one rendering style per layer
CRS namespace:identifier The Coordinate Reference System
BBOX minx,miny,maxx,maxy Bounding box corners (lower left, upper right) in CRS units
WIDTH output_width Width in pixels of map picture
HEIGHT output_height Height in pixels of map picture
FORMAT output_format Output format of map
Optional parameters
Name Value Description
TRANSPARENT TRUE/FALSE Background transparency of map (default=FALSE)
BGCOLOR colour_value Hexadecimal red-green-blue colour values for the background colour (default=FFFFF, white colour)
EXCEPTIONS exception_format The format in which exceptions are to be reported by the WMS (default=XML)
TIME time Time value for the layer
ELEVATION elevation Elevation value for the layer
Table 2.-WMS GetMap request parameters (OGC, 2006)
GetFeatureInfo. This is an optional operation supported only on layers in
which the attribute queryable is set to true (“1”). Once the map has been
returned using GetMap operation, the user choses a point on the map to obtain
more information. Parameters are in Table 3.
Mandatory parameters
Name Value Description
VERSION 1.3.0 The requested version
REQUEST GetFeatureInfo The requested operation name
(Map request part) Partial copy of the Map Request parameters that generated the map for which information is desired
QUERY_LAYERS layer_list Comma-separated list of one or more layers to be queried
INFO_FORMAT output_format Return format of feature information
Mandatory parameters
System
j / Y pixel_row j / Y coordinate in pixels of feature in Map Coordinate System
Optional parameters
Name Value Description
FEATURE_COUNT number Number of features (default=1)
EXCEPTIONS exception_format The exception format (default=XML)
Table 3.-WMS GetFeatureInfo request parameters (OGC, 2006)
Next figures show some examples of WMS requests for each operation. In Figure 9
there is a GetCapabilities XML response document, where we can see some metadata
about the service itself. In Figure 10 the GetMap operation returns a static image of a
layer (what is called a tile). Finally Figure 11 shows a GetFeatureInfo operation in a
pixel, and the response is a table with the layer attributes.
Request: http://localhost:8080/geoserver/wms?service=wms&version=1.1.1&request=GetCapabilities
Request:http://localhost:8080/geoserver/forestry/wms?SERVICE=WMS&LAYERS=forestry%3ALics&FO RMAT=image%2Fpng&TRANSPARENT=TRUE&VERSION=1.1.1&REQUEST=GetMap&STYLES=&S
RS=EPSG%3A900913&BBOX=-78271.516953126,4735426.7756641,-39135.758476563,4774562.5341406&WIDTH=256&HEIGHT=256
Fig. 10.-GetMap request response example
Request:http://localhost:8080/geoserver/forestry/wms?SERVICE=WMS&LAYERS=forestry%3ALics,forestry%3AMuni cipalities&QUERY_LAYERS=forestry%3ALics,forestry%3AMunicipalities&STYLES=,&SERVICE=WMS&VERSION
=1.1.1&REQUEST=GetFeatureInfo&BBOX=-180264.187372%2C4711667.245905%2C7006.531901%2C4751108.752495&FEATURE_COUNT=10&HEIGHT=258&W IDTH=1225&FORMAT=image%2Fpng&INFO_FORMAT=text%2Fhtml&SRS=EPSG%3A900913&X=481&Y=94
Fig. 11.-GetFeatureInfo request response
4.1.6.2.WEB FEATURE SERVICE (WFS)
4.1.6.2.1.INTRODUCTION
Web Feature Service standard implementation specification document (OGC, 2005)
describes how this service allows the exchange of vector data over the Internet.
Additionally, WFS-T (transactional) supports edit operations. The standard gives
access to tasks as querying, styling, editing and downloading vector data. WFS-T
performs the basic operations of persistent storage (known as CRUD operations:
4.1.6.2.2.WFSOPERATIONS
This standard is quite vast so we explain a selection of operations that are of interest
for our application. The operations available in all WFS versions are GetCapabilities
(discovery of data), DescribeFeatureType (information about an individual feature
type), GetFeature (downloading a selection of features from the data source),
LockFeature (prevention of a feature to be edited) and Transaction (creation,
updating and deleting of features).
As WMS, WFS can use both GET and POST methods and the rules of Section
4.1.6.1.2 are also applicable here. The request encoding can be done using two
different methods: XML (used in HTTP POST) and keyword-value pairs (used in
HTTP GET). The appropriate MIME type must accompany the response objects.
WFS returns features in a number of formats. The available options are: Geography
Markup Language (GML2 and GML3), shapefile (compressed in a ZIP file), JSON
and Comma-Separated Values (CSV).
Here there is an example of a WFS-T POST request to create a feature edited by the
user and saved in the spatial database. The first figure is the POST request. The
second figure shows the server response. In the request we see the coordinates of the
geometry that is sent to the server (in this case, a polygon). The response confirms
that it has been correctly inserted in the spatial database.
Fig. 13.-WFS Server response
4.1.6.3.WEB COVERAGE SERVICE (WCS)
4.1.6.3.1.INTRODUCTION
Web Coverage Service (WCS) standard retrieves geospatial data as coverages (grid
files). This functionality is very important for forestry and environmental purposes
because raster data is widely used in modelling. It is necessary to clarify the
differences of WCS respect WMS. WMS retrieves images that represent the data,
while WCS retrieves the original raw values (instead of pictures) and thus those data
can be used in spatial processes and interpreted in its complexity (and not just
portrayed).
The WCS standard specification implementation (OGC, 2006) clarifies its
characteristics.
4.1.6.3.2.WCS OPERATIONS
The three operations of WCS are:
GetCapabilities: as usual, it returns an XML document with the service
description and its coverages.
GetCoverage. As expected, this operation returns a coverage encoded in a well-known coverage format. The request allows the control of the coverage
we want to retrieve (see Table 4).
Mandatory parameters
Name Value Description
IDENTIFIER name Defines the coverage to get
FORMAT format
Format for the output. The formats are both images and
georeferenced. Images: JEP, GIF, PNG, Tiff and BMP.
Georeferenced: GeoTiff, GTopo30, ArcGrid and
GZipped ArcGrid.
Optional parameters
Name Value Description
RANGESUBSET field This parameter allows the selection of any of the available fields of the data
BOUNDINGBOX minx,miny,maxx,maxy The spatial subset of the data we want
Table 4.-WCS GetCoverage request parameters (OGC, 2006)
Next URL shows a GetMap WCS request example of a Digital Elevation Model
(DEM) raster dataset:
http://localhost:8080/geoserver/wcs?SERVICE=wcs&VERSION=1.0.0&REQUEST=
GetCoverage&coverage=mde200_V4&format=tiff.
The server returns the coverage, which can be saved to the local system.
4.1.6.4.WEB SERVICES SUMMARY
Web services are the standard-based units that fulfil the tasks a Web GIS is supposed
to give. The combination of different services (WMS, WFS, WCS and WPS) defines
a complete solution for every environmental or forestry issue. In the implementation,
the complexity of the service request is hidden to the user (it is encapsulated). Once
the service is created, third parts can use it (they are reusable), favouring the
A
RCHITECTURE4.2.
4.2.1. I
NTRODUCTIONThis Section’s aim is to propose a software architecture suitable to be applied in
applications where forestry / environmental data and processes are involved.
Processes themselves are not explained in detail here, thus they have their own
Section (see Section 5). Section 4 includes instead how other web services (except
processing) are integrated in the structure.
4.2.2. A
RCHITECTUREP
RINCIPLESWeb GIS technologies provide nowadays most of the needs of spatial information
users. However, an important challenge is still in process to be solved: how to
consolidate an efficient use of processing on the web. As a particular type of GIS,
Web GIS can perform the normal functions a regular GIS does, with some strengths
(and of course also some weaknesses). The general functions that the application
should perform are as follows:
Data visualization. This is the basic function. The application has to offer a
set of data in an accurate way and with adequate symbology. The user needs a
set of tools to move around the extent in a confortable way.
Querying. Displaying the graphical information (mapping) is not enough. Most of the interest comes when the user queries the data attributes. This
function consists on answering the question of: “what is here?”
User active interaction. To make the application more interesting, the user
interacts with the application creating his or her own information through
editing.