www.cbpv.org.br/rbpv
ISSN 0103-846X (Print) / ISSN 1984-2961 (Electronic) Doi: http://dx.doi.org/10.1590/S1984-29612016040
Factors associated with parasite dominance
in fishes from Brazil
Fatores associados com a dominância parasitária em peixes do Brasil
Cristina Fernandes do Amarante1*; Wagner de Souza Tassinari2; Jose Luis Luque1,3; Maria Julia Salim Pereira1
1 Programa de Pós-graduação em Ciências Veterinárias, Instituto de Veterinária, Universidade Federal Rural do Rio de Janeiro – UFRRJ, Seropédica, RJ, Brasil
2 Departamento de Matemática, Instituto de Ciências Exatas, Universidade Federal Rural do Rio de Janeiro – UFRRJ, Seropédica, RJ, Brasil
3 Departamento de Parasitologia Animal, Instituto de Veterinária, Universidade Federal Rural do Rio de Janeiro – UFRRJ, Seropédica, RJ, Brasil
Received April 09, 2016 Accepted April 27, 2016
Abstract
The present study used regression models to evaluate the existence of factors that may influence the numerical parasite dominance with an epidemiological approximation. A database including 3,746 fish specimens and their respective parasites were used to evaluate the relationship between parasite dominance and biotic characteristics inherent to the studied hosts and the parasite taxa. Multivariate, classical, and mixed effects linear regression models were fitted. The calculations were performed using R software (95% CI). In the fitting of the classical multiple linear regression model, freshwater and planktivorous fish species and body length, as well as the species of the taxa Trematoda, Monogenea, and Hirudinea, were associated with parasite dominance. However, the fitting of the mixed effects model showed that the body length of the host and the species of the taxa Nematoda, Trematoda, Monogenea, Hirudinea, and Crustacea were significantly associated with parasite dominance. Studies that consider specific biological aspects of the hosts and parasites should expand the knowledge regarding factors that influence the numerical dominance of fish in Brazil. The use of a mixed model shows, once again, the importance of the appropriate use of a model correlated with the characteristics of the data to obtain consistent results.
Keywords: Epidemiology, parasite ecology, mixed model, multiple linear regression analysis.
Resumo
Este estudo avaliou, por meio de modelos de regressão e sob o ponto de vista epidemiológico, a existência de fatores que podem influenciar a dominância numérica parasitária. Utilizou-se um banco de dados, contendo 3.746 espécimes de peixes e seus respectivos parasitos, para avaliar a relação da dominância parasitária com características bióticas inerentes aos hospedeiros e aos táxons parasitários estudados. Foram ajustados modelos de regressão linear multivariada, clássico e de efeitos mistos. Os cálculos foram realizados no software R (IC 95%). No ajuste do modelo de regressão linear múltipla clássico, as espécies de peixes dulcícolas, as planctívoras e o comprimento do corpo foram associadas à dominância parasitária, assim como os táxons Trematoda, Monogenea e Hirudínea. Entretanto, o ajuste do modelo de efeitos mistos demonstrou que apenas o comprimento do hospedeiro e os táxons Nematota, Trematoda, Monogenea, Hirudínea e Crustácea estão associados significativamente a dominância parasitária. Estudos que considerem os aspectos biológicos específicos dos hospedeiros e dos parasitos devem ampliar o entendimento sobre os fatores que interferem na dominância numérica em peixes do Brasil. A utilização do modelo misto demonstra, mais uma vez, a importância do uso adequado do modelo que respeite a natureza dos dados para a obtenção de resultados consistentes.
Palavras-chaves: Epidemiologia, ecologia parasitária, modelo misto, análise de regressão linear múltipla.
*Corresponding author: Cristina Fernandes do Amarante. Universidade Federal Rural do Rio de Janeiro – UFRRJ, BR-465, Km 7, s/n,
Introduction
The general numerical dominance was calculated for each parasite infracommunity, and the mean values represent the numerical dominance of each component community (BUSH et al., 1997). The most frequently used index is the relative dominance or Berger-Parker index, defined as the number of individuals of a parasite species or group of parasites divided by the total number of individuals of all species of each infracommunity (MAGURRAN, 2004).
The concept of numerical dominance has been widely used to determine whether a major species, or group of species, exists in the parasite infracommunities and to establish the numerically dominant parasite taxon in these infracommunities to contribute to and complement the distribution studies of parasites in several groups of hosts (SALGADO-MALDONADO & KENNEDY, 1997; SURES & STREIT, 2001; SCHABUSS et al., 2005; POULIN et al., 2008). However, relationships that aim to determine the quantitative weight of one or more parasite species in their infracommunities have rarely been addressed. In addition, for all types of analysis that have been performed, a database including several host species found in the same location has not been used, and these values have not been associated with biotic factors of the hosts to explain why some parasite communities are characterized by one or several dominant species, whereas others are not markedly dominated by any species (POULIN, 2007; POULIN et al., 2008).
In the present study, multivariate linear regression techniques were used to analyze a sample of 73 marine and freshwater fish species to detect the distribution patterns of the parasite numerical dominance in relation to a set of biotic factors of the hosts.
Materials and Methods
Data
The present study used the database developed by Amarante et al. (2015, 2016), which consists of 3,746 fish specimens from 73 species, 54 marine and 19 freshwater, collected from 1991 to 2009 along the coast of the State of Rio de Janeiro (21°-23°S and 42°-45°W) and the Guandu River (22°48’2” S, 43°37’35” W), Brazil.
Study variables
The explanatory variables used in the study included host genus (male or female), schooling habit (yes/no), aquatic environment (marine or freshwater), habitat (benthic/benthopelagic/pelagic), food habits (carnivore/planktivorous/omnivorous), host length (cm), and dominant parasite taxon. The outcome variable was the dominance index for the host specimens.
Statistical analysis
The numerical dominance was calculated using the Berger Parker index by dividing the greater number of individuals of a parasite species by the total number of all species of each infracommunity (BERGER & PARKER, 1970). In the present study, classification of the dominant species at the higher taxon level was used to calculate the dominance frequency.
A univariate analysis was performed to observe the distribution of means of dominance frequencies for each category of the studied variables. Data normality was determined using the Shapiro-Wilk test. A Wilcoxon text was used to determine the difference between two groups, and a Kruskal-Wallis test was used when more than two independent groups were analyzed (KATZ, 2006). Pearson’s correlation coefficient was used to evaluate the association between host length and dominance frequency (BUSSAB & MORETTIN, 2014).
Subsequently, a bivariate analysis was performed to observe the behavior of the variables. Due to the possible correlation between observations, the intra-class correlation coefficient (ICC) was calculated, which measures the percentage variation of the dominance frequency between the different existing groups, which in this case are formed by the different fish species (DOHOO et al., 2003). Also, a mixed-effects multiple linear regression model that better explained the variability in the frequency of parasite dominance was fit. First, a classical model was fitted, in which the different fish species were not considered as different groups. Subsequently, a mixed model was adjusted, assuming that the 73 fish species formed different groups. In this model, fish species were considered random effects.
Regression coefficients and their respective confidence intervals (CI) were calculated with a significance level of 5%. Wald’s test was also used to determine whether the parameter found for each explanatory variable included in the model was significant. The calculation consisted of the ratio of the coefficient and its respective standard error (BUSSAB & MORETTIN, 2014). All variables were included in the full model and then removed if they were not significant, using the rotine based in stepwise model selection by AIC (VENABLES & RIPLEY, 2002). For the residuals analysis were used shapiro-wilk normality test (SHAPIRO & WILK, 1965).
All statistical calculations were performed with R software for Windows, version 3.2.1 (R DEVELOPMENT CORE TEAM, 2014), using the packages lme4 version 1.1-7 (BATES et al., 2015) and Nlme version 1.1-7 (BATES et al., 2015).
Results
In all analyzed specimens, the dominant parasite taxon was Trematoda, (1,473) followed by Nematoda (593), Monogenea (405), Hirudinea (393), Cestoda (202), Crustacea (115), and Acanthocephala (62). In 503 specimens, no dominance of any taxon was observed.
According to Kruskal-Wallis and Wilcoxon tests, the parasite dominance was significantly different between the categories of all studied variables (Table 1). No correlation was found [–0.01 (–0.04; 0.03)] between the host length and the dominance frequency, although this result was not significant. According to the ICC value, 24% of the parasite dominance variability may be explained by the different fish species.
Table 1. Means of parasite dominance frequencies and their respective confidence intervals (95% CI) according to categories of the explanatory variables in fish collected in the state of Rio de Janeiro, Brazil.
Variables Categories Mean(95% CI)*
Host genus Male [0.72(0.71; 0.73)]
Female [0.72(0.71; 0.73)]
Schooling habits Yes [0.72(0.71; 0.73)]
No [0.70(0.68/ 0.72)]
Aquatic Environment Marine [0.82(0.81; 0.83)]
Freshwater [0.66(0.63; 0.69)]
Habitat
Benthic [0.72(0.71; 0.73)]
Benthopelagic [0.70(0.68; 0.72)]
Pelagic [0.78(0.76; 0.80)]
Food Habit
Carnivore [0.72(0.71; 0.73)]
Planktivorous [0.84(0.80; 0.88)]
Omnivore [0.71(0.70; 0.72)]
Dominant Taxon
Acanthocephala [0.20(0.17; 0.23)]
Nematoda [0.70(0.64; 0.76)]
Cestoda [0.70 (0.68; 0.72)]
Trematoda [0.70(0.67; 0.73)]
Monogenea [0.80(0.22; 0.81)]
Hirudinea [0.80(0.78; 0.82)]
Crustacea [0.80(0.78; 0.82)]
No dominance [0.80(0.76; 0.84)]
*Significance according to the Wilcoxon and Kruskal-Wallis tests.
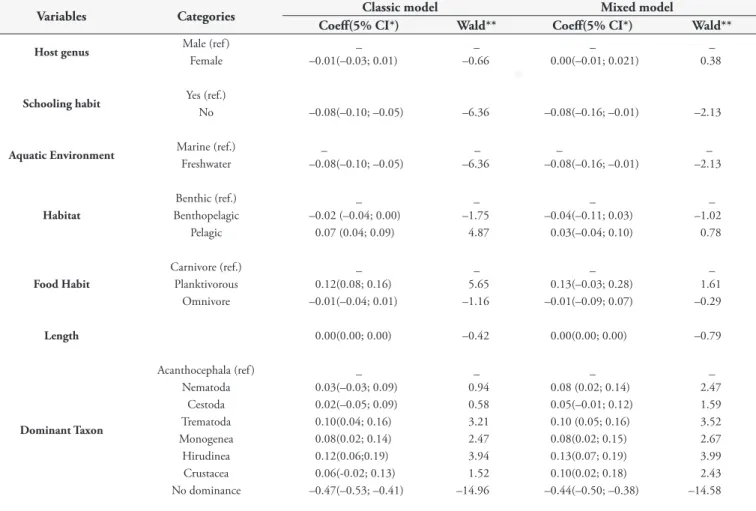
Table 2. Bivariate analysis of parasite dominance in fish collected in the state of Rio de Janeiro, Brazil.
Variables Categories Classic model Mixed model
Coeff(5% CI*) Wald** Coeff(5% CI*) Wald**
Host genus Male (ref ) _ _ _ _
Female –0.01(–0.03; 0.01) –0.66 0.00(–0.01; 0.021) 0.38
Schooling habit Yes (ref.)
No –0.08(–0.10; –0.05) –6.36 –0.08(–0.16; –0.01) –2.13
Aquatic Environment Marine (ref.) _ _ _ _
Freshwater –0.08(–0.10; –0.05) –6.36 –0.08(–0.16; –0.01) –2.13
Habitat
Benthic (ref.) _ _ _ _
Benthopelagic –0.02 (–0.04; 0.00) –1.75 –0.04(–0.11; 0.03) –1.02
Pelagic 0.07 (0.04; 0.09) 4.87 0.03(–0.04; 0.10) 0.78
Food Habit
Carnivore (ref.) _ _ _ _
Planktivorous 0.12(0.08; 0.16) 5.65 0.13(–0.03; 0.28) 1.61
Omnivore –0.01(–0.04; 0.01) –1.16 –0.01(–0.09; 0.07) –0.29
Length 0.00(0.00; 0.00) –0.42 0.00(0.00; 0.00) –0.79
Dominant Taxon
Acanthocephala (ref ) _ _ _ _
Nematoda 0.03(–0.03; 0.09) 0.94 0.08 (0.02; 0.14) 2.47
Cestoda 0.02(–0.05; 0.09) 0.58 0.05(–0.01; 0.12) 1.59
Trematoda 0.10(0.04; 0.16) 3.21 0.10 (0.05; 0.16) 3.52
Monogenea 0.08(0.02; 0.14) 2.47 0.08(0.02; 0.15) 2.67
Hirudinea 0.12(0.06;0.19) 3.94 0.13(0.07; 0.19) 3.99
Crustacea 0.06(-0.02; 0.13) 1.52 0.10(0.02; 0.18) 2.43
No dominance –0.47(–0.53; –0.41) –14.96 –0.44(–0.50; –0.38) –14.58
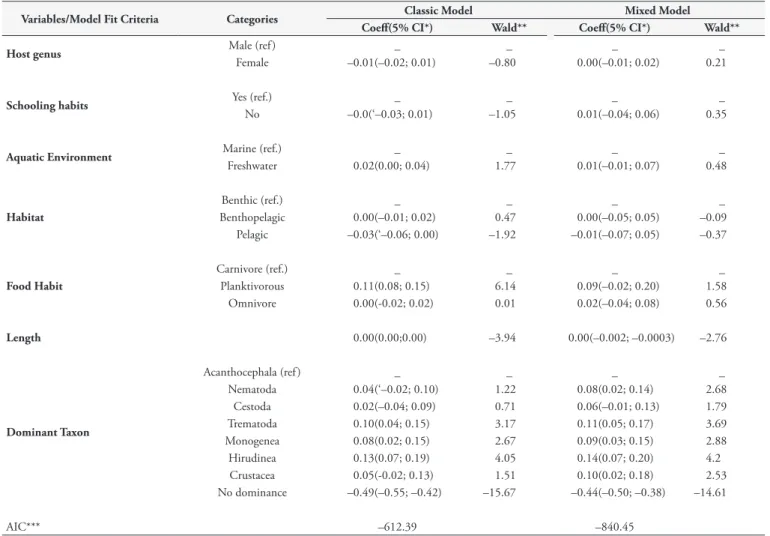
Table 3. Full multivariate linear regression model of the parasite dominance in fish collected in the state of Rio de Janeiro, Brazil.
Variables/Model Fit Criteria Categories Classic Model Mixed Model Coeff(5% CI*) Wald** Coeff(5% CI*) Wald**
Host genus Male (ref ) _ _ _ _
Female –0.01(–0.02; 0.01) –0.80 0.00(–0.01; 0.02) 0.21
Schooling habits Yes (ref.) _ _ _ _
No –0.0(‘–0.03; 0.01) –1.05 0.01(–0.04; 0.06) 0.35
Aquatic Environment Marine (ref.) _ _ _ _
Freshwater 0.02(0.00; 0.04) 1.77 0.01(–0.01; 0.07) 0.48
Habitat
Benthic (ref.) _ _ _ _
Benthopelagic 0.00(–0.01; 0.02) 0.47 0.00(–0.05; 0.05) –0.09
Pelagic –0.03(‘–0.06; 0.00) –1.92 –0.01(–0.07; 0.05) –0.37
Food Habit
Carnivore (ref.) _ _ _ _
Planktivorous 0.11(0.08; 0.15) 6.14 0.09(–0.02; 0.20) 1.58
Omnivore 0.00(-0.02; 0.02) 0.01 0.02(–0.04; 0.08) 0.56
Length 0.00(0.00;0.00) –3.94 0.00(–0.002; –0.0003) –2.76
Dominant Taxon
Acanthocephala (ref ) _ _ _ _
Nematoda 0.04(‘–0.02; 0.10) 1.22 0.08(0.02; 0.14) 2.68
Cestoda 0.02(–0.04; 0.09) 0.71 0.06(–0.01; 0.13) 1.79
Trematoda 0.10(0.04; 0.15) 3.17 0.11(0.05; 0.17) 3.69
Monogenea 0.08(0.02; 0.15) 2.67 0.09(0.03; 0.15) 2.88
Hirudinea 0.13(0.07; 0.19) 4.05 0.14(0.07; 0.20) 4.2
Crustacea 0.05(-0.02; 0.13) 1.51 0.10(0.02; 0.18) 2.53
No dominance –0.49(–0.55; –0.42) –15.67 –0.44(–0.50; –0.38) –14.61
AIC*** –612.39 –840.45
ref = reference category. Coeff - Coefficient. *Significant at the α = 5% level. **Significant when > 1.96. ***AIC (Akaike’s information criterion).
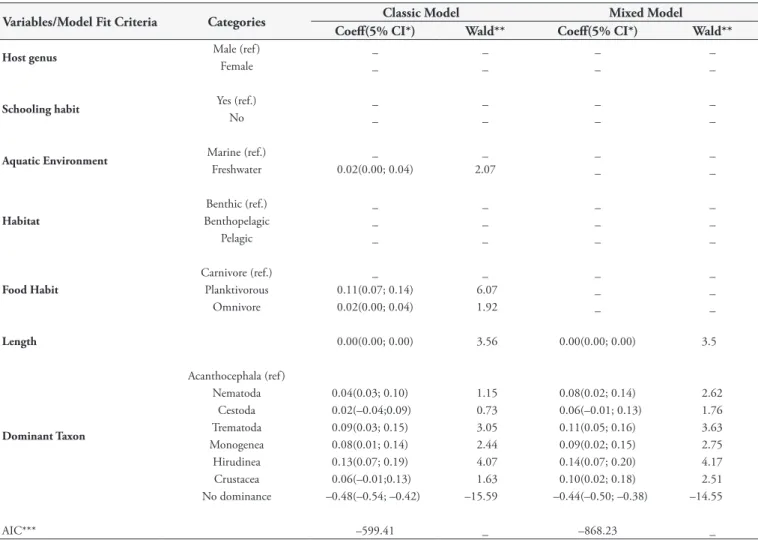
Table 3 shows the behavior of all variables in the full models. In the final model fit of the multivariate analysis (Table 4), in the classical model, freshwater and planktivorous fish species; the host length; and the species of the taxa Trematoda, Monogenea, and Hirudinea were significantly associated with parasite dominance. In the mixed model, in which different fish species were considered independent groups, only the host length and the taxa Nematoda, Trematoda, Monogenea, Hirudinea, and Crustacea were significantly associated with parasite dominance. Table 4 also shows that the value of Akaike’s information criterion (AIC) is lower for the mixed model, which indicates that the model is more parsimonious and therefore should be considered the model that best explains parasite dominance.
Discussion
Determining numerical dominance patterns in some parasite groups is highly relevant to understanding of the structure of parasite communities. This creates the possibility of relating parasites to infection rates, which may result in epidemiological studies. However, parasite dominance has not been studied in a broader context or using a database that includes several hosts found at the same location, which makes it impossible to define the existence of factors that may influence parasite dominance.
Recently, Amarante et al. (2015) demonstrated that some biotic factors of the hosts, such as body length, food habits, and ability to form schools, may be associated with aggregation values and parasite abundance. It is noteworthy that some macroecological aspects may also influence these processes.
The construction of a mixed model to examine variables related to parasite dominance was justified by an ICC value greater than 15%, according to Snijders & Bosker (2012). In the present study, approximately 24% of the variability in the parasite dominance degree may be attributed to the different fish species that constitute the database.
Cestoda), and especially for digenetic trematodes and nematodes, which are both endoparasites with heteroxenous cycles. This fact may be related to the complexity of biological cycles and the greater degree of infection found in intermediate hosts of fish parasites, which, depending on the food habits of the fish and their population biology, may facilitate the ingestion of infectious stages by fish that act as definitive, intermediate, or paratenic hosts. The predominance of parasites from the taxa Trematoda and Nematoda, which are ectoparasites, was also expected due to the formation of a greater number of associations between hosts and parasites in fish in Brazil (LUQUE & POULIN, 2007).
Second, the numerical dominance of fish parasite species in Brazil was associated only with one of the biological characteristics used in the present analysis (length), suggesting that a stochastic process tends to occur, i.e., with no determined patterns and possibly originating from random events. Because length is a quantitative parameter of parasite infections, it was expected that an association would be found, similar to the association between the degree of parasite aggregation (AMARANTE et al., 2015) and the parasite abundance (according to the observations in chapter 2). However, the main component of dominance is its relationship with a major taxon, and this characteristic may cause the range of association possibilities to be much broader when a great diversity of these
fish parasite species with unknown biology and transmission are present. The presence of stochastic processes is not new in parasite population dynamics (MARION et al., 1998; CORNELL, 2010; HERBERT & ISHAM, 2000) or in the structuring of fish communities in tropical regions (LOWE-McCONNELL, 1987). According to Poulin et al. (2008), numerical dominance may be influenced by inter-specific differences between infection rates, which makes it difficult to explain or determine any patterns.
Our results indicate the need for more studies related to the biological aspects of hosts and parasites that allow the development of models to explain possible patterns of numerical dominance in the parasites of fishes in Brazil considering the variability of the diversity of the parasite species groups.
Acknowledgements
We acknowledge The National Council for Scientific and Technological Development (Conselho Nacional de Desenvolvimento Científico e Tecnológico do Brasil- CNPq) for the financial support in the form of a doctoral scholarship to the first author and a research productivity grant to José Luis Luque.
Table 4. Final multivariate linear regression model of the parasite dominance in fish collected in the state of Rio de Janeiro, Brazil.
Variables/Model Fit Criteria Categories Classic Model Mixed Model
Coeff(5% CI*) Wald** Coeff(5% CI*) Wald**
Host genus Male (ref ) _ _ _ _
Female _ _ _ _
Schooling habit Yes (ref.) _ _ _ _
No _ _ _ _
Aquatic Environment Marine (ref.) _ _ _ _
Freshwater 0.02(0.00; 0.04) 2.07 _ _
Habitat
Benthic (ref.) _ _ _ _
Benthopelagic _ _ _ _
Pelagic _ _ _ _
Food Habit
Carnivore (ref.) _ _ _ _
Planktivorous 0.11(0.07; 0.14) 6.07 _ _
Omnivore 0.02(0.00; 0.04) 1.92 _ _
Length 0.00(0.00; 0.00) 3.56 0.00(0.00; 0.00) 3.5
Dominant Taxon
Acanthocephala (ref )
Nematoda 0.04(0.03; 0.10) 1.15 0.08(0.02; 0.14) 2.62
Cestoda 0.02(–0.04;0.09) 0.73 0.06(–0.01; 0.13) 1.76
Trematoda 0.09(0.03; 0.15) 3.05 0.11(0.05; 0.16) 3.63
Monogenea 0.08(0.01; 0.14) 2.44 0.09(0.02; 0.15) 2.75
Hirudinea 0.13(0.07; 0.19) 4.07 0.14(0.07; 0.20) 4.17
Crustacea 0.06(–0.01;0.13) 1.63 0.10(0.02; 0.18) 2.51
No dominance –0.48(–0.54; –0.42) –15.59 –0.44(–0.50; –0.38) –14.55
AIC*** –599.41 _ –868.23 _
References
Amarante CF, Tassinari WS, Luque JL, Pereira MJS. Factors associated with parasite aggregation levels in fishes from Brazil. Rev Bras Parasitol Vet
2015; 24(2): 174-182. http://dx.doi.org/10.1590/S1984-29612015031. PMid:26083693.
Amarante CF, Tassinari WS, Luque JL, Pereira MJS. Parasite abundance and its determinants in fishes from Brazil: an eco-epidemiological approach.
Rev Bras Parasitol Vet 2016; 25(2). In press.
Bates D, Mächler M, Bolker B, Walker S. Fitting linear mixed-effects models using lme4. J Stat Softw 2015; 67(1): 67-101. http://dx.doi. org/10.18637/jss.v067.i01.
Berger WH, Parker FL. Diversity of planktonic Foraminifera in deep sea sediments. Science 1970; 168(3937): 1345-1347. http://dx.doi. org/10.1126/science.168.3937.1345. PMid:17731043.
Bush AO, Lafferty K, Lotz JM, Shostak AW. Parasitology meets ecology on its own terms: Margolis et al. revisited. J Parasitol 1997; 83(4): 575-583. http://dx.doi.org/10.2307/3284227. PMid:9267395.
Bussab WO, Morettin PA. Estatística básica. São Paulo: Saraiva; 2014.
Cornell SJ. Modelling stochastic transmission processes in Helminth infections. In: Michael E, Spear RC. Modelling parasite transmission and control. 3rd ed. New York: Springer; 2010. p. 66-78.
Dohoo I, Martin W, Stryhn H. Veterinary epidemiologic research. Charlottetown: University of Prince Edward Island; 2003.
Herbert J, Isham VS. Stochastic host-parasite interaction models. J Math Biol 2000; 40(4): 343-371. http://dx.doi.org/10.1007/s002850050184. PMid:10853797.
Katz MH. Study design and statistical analysis. Cambridge: Cambridge University; 2006.
Lowe-McConnell RH. Ecological studies in tropical fish communities.
Cambridge: University Press; 1987.
Luque JL, Poulin R. Metazoan parasite species richness in Neotropical fishes: hotspots and the geography of biodiversity. Parasitology 2007; 134(6): 865-878. http://dx.doi.org/10.1017/S0031182007002272. PMid:17291392.
Magurran AE. Measuring biological diversity. Oxford: Blackwell Publishing; 2004.
Marion G, Renshaw E, Gibson G. Stochastic effects in a model nematode infection in ruminants. IMA J Math Appl Med Biol 1998; 15(2): 97-116. http://dx.doi.org/10.1093/imammb/15.2.97. PMid:9661280.
Poulin R. Evolutionary ecology of parasites. New Jersey: Princeton University Press; 2007.
Poulin R, Luque JL, Guilhaumon F, Mouillot D. Species abundance distributions and numerical dominance in gastrointestinal helminth communities of fish hosts. J Helminthol 2008; 82(3): 193-202. http:// dx.doi.org/10.1017/S0022149X08982626. PMid:18544177.
R Development Core Team. R: a language and environment for statistical computing. Vienna: R Foundation for Statistical Computing; 2014 [cited 2014 Jun 10]. Available from: http://www.R-project.org
Salgado-Maldonado G, Kennedy CR. Richness and similarity of helminth communities in the tropical cichlid fish Cichlasoma urophthalmus from the Yucatan Peninsula, Mexico. Parasitology 1997; 114(6): 581-590.
Schabuss M, Kennedy CR, Konecny R, Grillitsch B, Schiemer F, Herzig A. Long-term investigation of the composition and richness of intestinal helminth communities in the stocked population of eel, Anguilla anguilla, in Neusiedler See, Austria. Parasitology 2005; 130(2): 185-194. http:// dx.doi.org/10.1017/S0031182004006444. PMid:15727068.
Shapiro SS, Wilk MB. An analysis of variance test for normality (complete samples).Biometrika 1965; 52(3-4): 591-611. http://dx.doi.org/10.1093/ biomet/52.3-4.591.
Snijders TAB, Bosker RJ. Multilevel analysis: an introduction to basic and advanced multilevel modeling. London: Sage; 2012.
Sures B, Streit B. Eel parasite diversity and intermediate host abundance in the River Rhine, Germany. Parasitology 2001; 123(2): 185-191. http:// dx.doi.org/10.1017/S0031182001008356. PMid:11510684.
Venables WN, Ripley BD. Modern applied statistics with S. New York: Springer; 2002.
Vignon MP, Sasal P. Multiscale determinants of parasite abundance: a quantitative hierarchical approach for coral reef fishes. Int J Parasitol