UTILIZATION OF HOSPITAL BIRTH WEIGHTS AND MORTALITY AS INDICATORS OF HEALTH PROBLEMS IN INFANCY1
Carlos V. Serrano, M.D., Ph.D.,* and Ruth R. Puffer, Dr.P.H.3
The primary aim of this presentation is to encourage and facilitate routine employment of hospital data on the out- come of pregnancy in order to help meet basic health program needs. Such action would also lay a groundwork for collection and use of these data in a vital statistics system.
Introduction
In evaluating the state of health of a newborn infant, weight at birth is a most important variable. Birth weight is a condition- ing factor of survival and of future growth and development. It is also a clear reflection of factors and conditions responsible for the level of reproductive and pregnancy risk in the mother. Such factors and conditions may be present or acting even before the product is conceived.
The Inter-American Investigation of Mortal- ity in Childhood4 has revealed the seriousness of immaturity or low birth-weight in 13 Latin American projects (I). Our analyses (2), as well as those of Legarreta and co-workers (3), have also indicated that registration of infant deaths in hospitals, particularly deaths occurring in the neonatal period, is incomplete. Hospitals- especially in areas where a high proportion of births occur in these institutions-constitute the source of valuable data needed to evaluate the problems of immaturity and low birth-weight, and to learn more about the proportion of babies born with deficient birth weights. Hos-
1 Also appearing in Spanish in Boletin de la Oficina Sanitaria Panamericana, Volume LXXVIII, 1975.
*Medical Officer, Pan American Health Organiza- tion.
3Principal Investigator, Inter-American Investiga- tion of Mortality in Childhood.
4A collaborative research effort coordinated by the Pan American Health Organization on a continental scale in order to explore in depth the causes of excessive mortality in infancy and early childhood in the Americas (I). The investigation was made possible by a contract between the Agency for International Development of the United States and the Pan American Health Organization.
pitals can also provide the basic data needed for study of mortality in the first day and the first few days of life.
With respect to pregnancy risk, a high-risk pregnancy is one in which there is an increased overall hazard of fetal and neonatal death, or of disability to the offspring, due to complications of the maternal condition, or disease (current or past), or treatment, or unfavorable reproduc- tive characteristics. Many products of such pregnancies have low or deficient birth weights; some have weights considered favorable, and a few are oversized.
For actions leading to improvement of the health of infants and young children in Latin American countries, knowledge is needed on the distribution of live-born infants by birth weight. A greater understanding is likewise required of the causes and factors involved in low and deficient birth weights, of their in- volvement in neonatal mortality, and of their role in mortality due to nutritional deficiency in the post-neonatal period and early life. This knowledge is needed because adequate weight at birth appears to be an outstanding deter- minant of survival and normal development.
326 PAHO BULLETIN . Vol. VIII, No. 4, 1974
infants. Thus information for preventive pro- grams is urgently needed regarding distribution of birth weights in the cities, states or prov- inces, and countries of Latin America. In order to extend and apply our knowledge of low and deficient birth weights and the effect of birth weight on health and survival, utilization of indicators of these problems is proposed.
Research (5) is being carried out in New York City
. . . to identify the antecedents as well as the consequences of low birth-weight, in an effort first to establish, and then to plan strategies to prevent, its occurrence and sequelae.5
Kessner, et al. (6) stated in the recommenda- tions from their study of 142,017 live births in the same city that more detailed studies of the relationship between infant survival and mater- nal characteristics are required and that
From such new analyses, providers of obstetric services would be able to determine the risk faced by an individual female and direct her to appropriate services that decrease her chances of producing a low-birth-weight or nonviable infant.6
Official birth certificates were utilized in the New York City study (6). The frequency of low-weight births can be obtained in this manner through the official registration system if weight at birth is included on the birth certificate, and if procedures are established for babies delivered in hospitals to be weighed in the delivery room, and for those delivered at home to be weighed by the midwife. In areas where many births occur at home, midwives and empirical personnel attending deliveries can be provided with scales for recording birth weight. The data they can provide would be a very beneficial by-product of educational and control programs for midwives and auxiliaries participating in programs of simplified delivery of health care.
The inclusion of weight at birth on birth certificates in all countries of the Americas is highly recommended. Implementation of this
5D. Rush, et al. (5), International Journal of Epidemiology 1 (4): 375, 1972.
6D. M. Kessner, et al. (6), p. 11.
measure would be facilitated if hospitals would assume the role of initiating birth certificates and assisting with development of satisfactory registration systems. However, the development of complete and accurate data will take several years, and a satisfactory system will depend on obstetricians, pediatricians, and other hospital staff taking the lead in showing the value of the data involved.
The large maternity hospitals and the mater- nities of general hospitals can provide two types of urgently needed basic data: fist, the dis- tribution of live births by birth weight; and second, mortality in the first day of life. Such data may also be analyzed according to other variables, among them the age of the mother and birth order.
The purpose of this paper is to encourage routine use of hospital data on the outcome of pregnancy in order to increase knowledge of these important problems. Data obtained during the Investigation or as a result, through special tabulations, are included to show the value of such information and to serve as a basis for comparisons in new studies. The frequencies of low and deficient birth weights and of death rates in the first day of life are termed indicators of specific problems. Since all mem- bers of the teams responsible for delivery and care of the newborn may contribute to the recording of vital information, educational pro- grams are proposed and exercises have been designed for use in courses of preventive medicine, nursing, midwifery, and medical records.
Serrano and Puffer . INDICATORS OF HEALTH PROBLEMS IN INFANCY 327
Definition of Live Birth and Fetal Death
The birth attendant, by observing vital signs present at birth, determines whether the prod- uct should be classed as a live birth or a fetal death. The definitions of live birth and fetal death which the World Health Organization (7) recommends for use in member countries are as follows:
Live birth is the complete expulsion or extraction from its mother of a product of conception, irrespective of the duration of the pregnancy, which, after such separation, breathes or shows any other evidence of life, such as beating of the heart, pulsation of the
umbilical cord, or definite movement of volun- tary muscles, whether or not the umbilical cord has been cut or the placenta is attached; each product of such a birth is considered live-born.7
Fetal death is death prior to the complete expulsion or extraction from its mother of a product of conception, irrespective of the duration of pregnancy; the death is indicated by the fact that after such separation the fetus does not breathe or show any other evidence of life, such as beating of the heart, pulsation of the umbiIica1 cord, or definite movement of voluntary muscles.7
The document Vital Signs Present at Birth
(8) contains the results of analysis of vital signs observed for 2,429 vital events in five selected New York City hospitals. A specific form was used for recording the presence of the four vital signs cited by the foregoing WHO definitions. The presence or absence of these signs (respir- atory effort, heartbeat, pulsation of the umbil- ical cord, movement of voluntary muscles) was observed within 120 seconds after delivery, delivery being defined as complete expulsion or extraction of the product from its mother.
A live birth has one or more of these vital signs and a fetal death has none. On this basis, 2,565 products were classed as live births, 57 as fetal deaths, and seven as having insufficient records for classification. Heartbeat, detected by palpation or auscultation, was the most frequently encountered sign, being absent in ‘World Health Organization, International Classifi cation of Diseases, Eighth Revision, Geneva, 1967, p. 469.
only one of the 2,565 live births during the first two minutes of life.
This study demonstrates the feasibility of conducting such studies of routine hospital services and emphasizes the importance of acquiring accurate basic information regarding live births and fetal deaths. The value of studies of this kind extends beyond internal hospital
procedures, also affecting registration practices and the comparability of statistics 09 birth and death.
In order to obtain both accurate hospital data and accurate official statistics, all those responsible for recording live births and fetal deaths must be fully aware of the four signs of life cited above and must clearly distinguish live births from fetal deaths.
Some of the babies classed as live births die in the frost hour or first few hours of life. III fact, within the live-birth cohort of 1960 in the United States (9), nearly one-fifth of those dying in the first day of life did so within the first hour-7,811 deaths in the first hour out of 43,317 in the first day. Some newborns fail to live long enough to be placed in an incubator, or to receive care in the newborn intensive care unit or premature nursery.
ImmaturitJt and Low Birth- Weight
The accepted indicator of immaturity-the percentage of live-born babies weighing 2,500 grams (5 l/2 Ibs.) or less-should be obtained from data recorded in the delivery room and not in the nursery.
Indicator of immaturity (or low birth-weight) =
Live-born of 2,500 grams or less x 100 Ali live-born babies
All hospitals should therefore place scales in their delivery rooms and record birth weights routinely.
The Sixth Revision of the International Classification of Diseases of WHO (10) contains the following definition of immaturity:
328 PAHO BULLETIN . Vol. VIII, No. 4, 19 74
immature infant is a liveborn infant with a birth weight of 5 l/2 pounds (2,500 grams) or less, or specified as immature.
In June 1948 the First World Health Assem- bly adopted regulations governing application of the International Classification by WHO ,member countries (11). Thus a definition of immaturity in terms of birth weight was estab- lished which should automatically be applied in countries using the Classification.
The term “low birth-weight” (12) has been suggested as a replacement for “immaturity.” Although such a change is feasible in areas where all babies are weighed, it is likely that many newborn infants in developing countries will continue to be classed as immature on clinical grounds.
During the Inter-American Investigation of Mortality, efforts were made to obtain data on length of gestation for each birth, but the available data were not as complete or reliable as those on birth weight. Thus the definition of immaturity that utilizes weight without con- sidering length of gestation has been main- tained, even though the limitations involved in defining immaturity on the basis of birth weight alone are recognized. Furthermore, since the problems of immaturity and nutritional deficiency may be more serious in areas where length of gestation cannot be determined accurately at present, the use of birth weight is recommended.
Use of this indicator would permit obste- tricians, pediatricians, and other staff respon- sible for maternal and child health services to be aware of the size of local problems of immaturity. Ideally, prenatal clinics and obstet- ric services would strive to prevent the birth of a low-weight baby, and utilization of the indicator would permit the results of their efforts to be evaluated from year to year. Frequency
of
Low- Weight BirthsThe first question that needs to be answered is the following: What is the frequency of low-weight births or immaturity?
In two of the projects of the Inter-American
Investigation of Mortality in Childhood, suf- ficient information is available about live births to provide the answer to this question and to calculate the indicator-the percentage of all live births of low birth-weight. The State Health Department in California (13) provided a tab-
ulation of live births by birth weight for the four counties in the California project, namely Alameda, Contra Costa, San Francisco, and San Mateo. Birth certificates, on which birth weights were routinely recorded, were the source of the data. In 1969 there were 47,613 live births in these counties for which birth weights were stated.* Of these, 3,630 (7.6 per cent) weighed 2,500 grams or less.
(Indicator of low birth-weight = 3,630
- x
47,613 100 = 7.6 per cent) In the RibeirZo Prdto project the principal collaborator (14) established procedures for recording birth weights in hospitals during the Investigation and tabulated the results. Out of the 15,192 live births in that project for which birth weight and the mother’s age were stated,
1,326 (8.7 per cent) of the babies weighed 2,500 grams or less. The indicator of immatu- rity or low birth-weight in the Ribeirgo P&o project was thus slightly higher than in the California project.
Within the 1968 cohort of 142,017 live births in New York City (6), the birth weight of 141,624 babies was known. Of these latter, 14,160 (10.0 per cent) weighed 2,500 grams or less. No doubt several factors contributed to this frequency, which was found to be higher in New York City than in the California project. Rios (1.5) obtained a frequency of 11.9 per cent for births of 2,500 grams or less in five closed hospital services of Cuba where 39,600 live births were recorded in 1971. She used this indicator from these five hospitals, which were believed to have goodquality data, to evaluate deficiencies of certain other hospitals. Data from one closed hospital service indicated that 10.6 per cent of the live newborns weighed
Serrano and Puffer . INDICATORS OF HEALTH PROBLEMS IN-INFANCY 329
2,500 grams or less at birth, and that only 0.7 per cent weighed 1,500 grams or less, while data from the five closed services with good- quality records indicated that 11.9 per cent weighed 2,500 grams or less and 1.2 per cent weighed 1,500 grams or less.
Using these frequencies, plus data on mortal- ity by weight, she offered the explanation that this under-registration might have been caused by some of the infants who died a few minutes after birth being classed as fetal deaths. Evalua- tions of this type, assessing the degree to which WHO definitions of live birth and fetal death have actually been employed, are useful in establishing and improving hospital procedures. Data on the frequency of low-weight births in the Americas are difficult to compare with similar data from European countries. In Europe, birth weights have not been recorded on birth certificates and the WHO definitions may not have been maintained in the official registration systems. Chase (16) in the docu- ment International Comparisons of Perinatal and Infant Mortality, refers to “low-rate” coun- tries where infants weighing 2,500 grams or less constituted 5 per cent of the live births. Such countries include the Netherlands, Sweden, and New Zealand. According to Chase (16), the frequency of low birth-weight products (includ- ing both live births and stillbirths) for Great Britain in 1963 was 7.4 per cent. This calcula- tion was based on notifications received by the British Ministry of Health in 1963.
Lack of data from official registration sys- tems has delayed understanding of either the extent of the problem of immaturity in the neonatal period or the probable relationship of deficient weight at birth to nutritional de& ciency in the postneonatal period and early childhood. Moreover, a cumulative effect may be operating from one generation to the next in many areas of the world, thereby hampering growth and development of healthy popula- tions. When the frequencies of babies born with low or deficient weight are excessive, some die from immaturity (principally in the neonatal period) and some die from infectious diseases combined with nutritional deficiency in the
postneonatal period and early childhood. - Others may survive without making satisfactory weight gains and may constitute a high-risk group in terms of reproduction. That is, mothers in this group may give birth to low-weight babies and to infants with deficient weights, thereby continuing the vicious circle. These relationships deserve greater study. The initiation of such study through analysis of hospital deliveries is recommended.
Because of the evidence revealed in the projects of the Investigation in Latin America concerning the seriousness of immaturity as a health problem, exploratory tabulations are being made of the weights of live births occurring in large maternities in Latin American cities. This presentation includes data from two series of such tabulations, principally to illus- trate the value of these data in understanding the health problems of infancy and childhood in Latin America.
Aceves (17) the principal collaborator of the Investigation in Monterrey, Mexico, pro- vided a listing of all live births in a hospital in Mexico City that included birth weight, age of mother, and birth order. A tabulation was also made of birth weights in a large maternity hospital in San Salvador. (These experiences, which are limited, are presented only as exam- ples.)
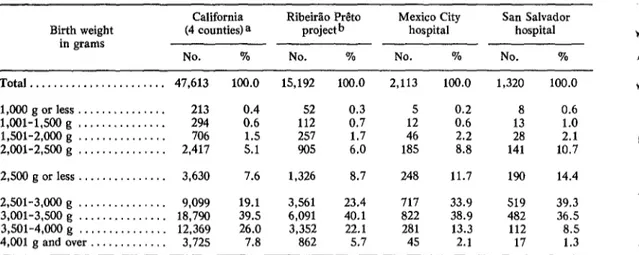
Table 1 provides the distribution by weight of live births in these two hospitals, in the Ribeirgo Pr&to project, and in the four Cali- fornia counties. These four distributions serve to illustrate the types of differences which may be encountered in different places, and to show that larger series of tabulations and greater in-depth study of birth weights are required.
330 PAHO BULLETIN . Vol. VIII, No. 4, 1974
TABLE l--Distribution of live births by birth weight in two projects of the Inter-American Investigation and two hospitals.
Birth weight in grams
California (4 counties) a
No. %
RibeirZo P&o projectb
No. %
Mexico City hospital
No. %
San Salvador hospital
No. %
Total ... 47,613 100.0 15,192 100.0 2,113 100.0 1,320 100.0
1,OOOgorless.. ... 213 52 0.3 5 0.2 8 0.6
l,OOl-1,500 g ... 294 82 112 0.7 12 0.6 13 1.0
1,501-2,000 g ... 706 257 1.7 46 2.2 28 2.1
2,001-2,500 g ... 2,417 ::: 905 6.0 185 8.8 141 10.7
2,500 g or less ... 3,630 7.6 1,326 8.7 248 11.7 190 14.4 2,501-3,000 g ... 9,099 19.1 3,561 23.4 717 33.9 519 39.3 3,001-3,500 g ... 18,790 39.5 6,091 40.1 a22 38.9 482 36.5 3,501-4,000 g ... 12,369 26.0 3,352 22.1 281 13.3 112 a.5
4,001 g and over ... 3,725 7.8 862 5.7 45 2.1 17 1.3
aData for the four counties (Alameda, Contra Costa, San Francisco, and San Mateo) provided the birth weights of live births.
bData for this project provided the birth weights of live births and the mothers’ age.
FIGURE l-Distribution of live births by birth weight in two hospitals and two projects of the Inter-American Investigation.
CALIFORNIA PROJECT lFOUR COUNTIES)
RIBEIR~O PRtTO MEXICO CITY SAN SALVAOOR
HOSPITAL HOSPITAL
t
1
i’
c L
L.
I-
*
;.
Serrano and Puffer . INDICATORS OF HEALTH PROBLEMS IN INFANCY 331
Frequency ofBirths with Deficient Weights In addition, it is proposed that an indicator of deficient birth weight be employed, deficient weight being defined by us as a weight of 2,SO l-3,000 grams.
Indicator of deficient birth weight = Live-born of 2,501-3,000 grams
x 100 All live-born babies
For the four California counties, the Ribei- rao Prdto project, and the hospitals in Mexico City and San Salvador, this indicator was as follows:
California, four counties . . . . _ . . . . 19.1 per cent Ribeirao P&o project . . . 23.4 per cent Mexico City hospital . . . 33.9 per cent San Salvador hospital . . . _ . . . . 39.3 per cent As with the percentages of births immature, the differences between indicators for these areas were great. The frequency of newborn babies with deficient weights in the San Salva- dor hospital was over twice as great as in the California counties. In the San Salvador hos- pital over half of the babies (709 out of 1,320, or 53.7 per cent) had low or deficient weights, while the comparable percentage in the four California counties was 26.7.
Differences in the relative size of these weight groups may depend on the extent to which certain biological and social factors are involved during the process of reproduction. For instance, chronic nutritional deficiency or relative depletion in the mother might be responsible for many of the low and deficient birth-weights of 2,00 l-3,000 grams, while other social and biological factors and causes might be more heavily involved in very low birth- weights (2,000 grams or less). Studies of these relationships would contribute to our under- standing of the pathogenesis of high reproduc- tive risks.
Favorable Birth Weights
While the percentages of births with low and deficient weights were higher in the San Salva- dor hospital than in other experiences, the
reverse was found for the percentages of births weighing 3,501-4,000 grams. The percentages in this latter weight group (shown in Table 1 and Figure l), which we have termed the “most favorable” weight group,9 varied from 8.5 in the San Salvador hospital to 26.0 in the California counties. As may also be seen, very few babies in the two Latin American hospitals weighed over 4,000 grams at birth.
Age of Mother and Birth Weight
Our indicators of low and deficient birth- weights depend on several factors, one of the most important being the age of the mother at birth of the child. Mothers under 20 years of age have a higher frequency of low birth-weight babies than do mothers in the four other age groups shown in Table 2 and Figure 2. The
1960 live-birth cohort in the United States had a low-weight indicator which varied from 10.1 per cent for young mothers under 20 years of age to 7.0 per cent for mothers of 25-29 years, as shown below:
Under 20 years . . . 10.1 per cent
2S24years . . . . . ~ . . . . . . . . . 7.5 per cent 25-29 years . . . 7.0 per cent
30-34years . . . . . . . . . . . . ..-.. 7.5 per cent
35 years and over . . . 8.1 per cent (For all ages combined the low-weight indicator was 7.8 per cent.)
The frequency of low-weight births in these five maternal age groups followed the same pattern in the Ribeirgo P&o project as in the United States, but the frequencies were slightly higher in the Ribeirzo PrCto project, namely: Under 20 years . . _ . . . _ 11.7 per cent
20-24 years . . . . . . .._. 7.8 per cent 25-29 years . . . 8.1 per cent
332 PAHO BULLETIN . Vol. VIII, No. 4, 1974
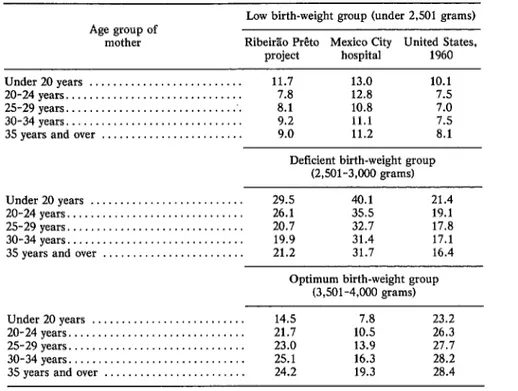
TABLE 2-Percentages of live births wftb low, de5cient, and most favorable weights, for mothers in 5ve age groups in the Ribeiriio Pr$to project, In a Mexico City hospital, and in the United States live-birth cohort of 1960.
Low birth-weight group (under 2,501 grams) Age group of
mother Rib&Lo P&o Mexico City United States,
project hospital 1960
Under20years ... 11.7 13.0 10.1
20-24years ... 7.8 12.8 7.5
25-29years ... 8.1 10.8 7.0
30-34years ... 9.2 11.1 7.5
3.5 years and over ... 9.0 11.2 8.1
Deficient birth-weight group (2,5Ol-3,000 grams) Under 20 years ... 29.5 40.1 21.4
20-24years ... 26.1 35.5 19.1
2.5-29years ... 20.7 32.7 17.8
30-34years ... 19.9 31.4 17.1 35 years and over ... 21.2 31.7 16.4
Optimum birth-weight group (3,501-4,000 grams) Under 20 years ... 14.5 7.8 23.2
20-24years ... 21.7 10.5 26.3
25-29years ... 23.0 13.9 27.7
30-34years ... 25.1 16.3 28.2 35 years and over ... 24.2 19.3 28.4
Unfortunately, these indicators of low- weight births among the different maternal age groups were not available for the California project.
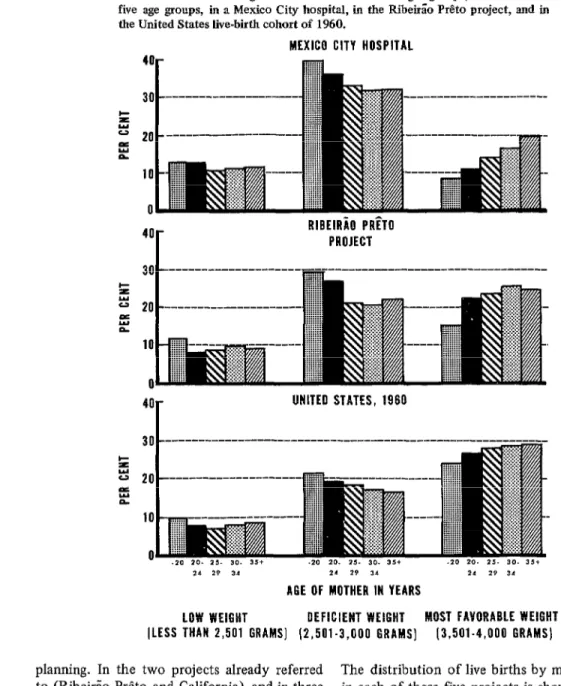
Data on frequencies of low, deficient, and most favorable birth weights for the five mater- nal age groups in the Ribeirao Pr&to project, the Mexico City hospital, and the 1960 live-birth
cohort in the United States are presented in Table 2. Even though the three sets of expe- riences were clearly different, there is no doubt that the mothers in the youngest age group (under 20 years) had the highest percentage of babies with low and deficient weights at birth. Moreover, with only one exception, for mothers in the next youngest age group (20-24 years) the percentages of infants with low and deficient weights were higher than for mothers in the three older groups.
different experiences. As may be observed in the left section of the figure, the proportions of infants with low birth-weight were consistently higher among those born to mothers under 20 years of age. Although the differences were slight, the smallest percentages of low-weight babies of mothers in these age groups were found in the 1960 birth cohort of the United States.
Serrano and Puffer . INDICATORS OF HEALTH PROBLEMS IN INFANCY 333
FIGURE 2-Percentages of live births in three weight groups, for mothers in five age groups, in a Mexico City hospital, in the RibeirEo P&o project, and in the United States live-birth cohort of 1960.
MEXICO CITY HOSPITAL
RIBEIR~O PRETO PROJECT
40 UNITED STATES, 1960
21 29 3,
21 29 31
11 19 34
A6E OF MOTHER IN YEARS
LOW WEIGHT OEFICIENT WEIGHT MOST FAVORABLE WEIGHT (LESS THAN 2,501 GRAMS] (2,501.3,000 GRAMS] 13,501.4,000 GRAMS] planning. In the two projects already referred
to (Ribeirao Preto and California), and in three others referred to in the section on mortality which follows, the birth rate varied from a low of 16.3 births per 1,000 population in the California project to a high of 40.4 in the El Salvador project. The birth rates for the other three projects were intermediate: 33.7 per 1,000 in Chaco Province, Argentina; 24.8 in SZro Paulo, Brazil; and 27.5 in Ribeirgo Preto.
The distribution of live births by maternal age in each of these five projects is shown in Table 3.
334 PAHO BULLETIN . Vol. VIII, No. 4, I974
P
I
TABLE 3-Percentage distribution of live births by maternal age group in five projects of the Inter-American
Investigation. fi
Brazil I
Age group of Argentina El Salvador United States
mother (Chaco so RibeirLo (Department of (California, t
Province) Paul0 P&o San Salvador) 4 counties)
% Under 20 years.. . . . 16.0 8.1 11.8 18.3 15.8
20-24years... 26.8 32.0 32.9 31.5 36.8 t
2529years... 23.8 30.6 27.2 22.6 28.5
30-34 years.. . . . , . . . 15.3 17.4 16.1 14.6 12.7 35 years and over.. . . . 18.0 11.9 12.1 13.0 6.1
b
percentage of births to mothers 35 or over (12.1 per cent of all births) was nearly twice as high as in the California project. The patterns in the three other projects also differed. In Sa’o Paul0 only 8.1 per cent of the births were to mothers under 20 years of age, while in the California, Chaco Province, and El Salvador projects the respective percentages in that age group were 15.8, 16.0, and 18.3. These findings clearly show that tabulation of births by maternal age group is advisable in analyzing distributions of live births by weight.
Birth Order and Birth Weight
Another important determinant of infant mortality is birth order. Of live births to mothers under 20 years in the U.S. birth cohort of 1950 (19), the frequency of low-weight births increased from 8.6 per cent for first products to a high of 18.3 per cent for fifth or later products. In calculating the birth order, previous live births and stillbirths were includ- ed. Unfortunately, similar data on the fre- quency of low-weight births are not available for the 1960 U.S. birth cohort or for any of the projects. Moreover, a large experience will be needed in order to obtain accurate frequencies of low-weight births among young mothers by birth order. The Ministry of Health of Cuba may provide the first such data for a Latin American country, since birth weight was added to the birth certificate in Cuba in 1971. In the cohort of 142,017 live births in New York City the presentation of data by birth order was limited to infant mortality, a subject
which will be referred to in the next section. However, it is noteworthy that birth order in that study was total birth order, the sum of live births and fetal deaths that a mother has had, including the birth being recorded. For exam- ple, if a mother had previously given birth to two live babies (either singly or as twins) and to one dead baby, the next product was counted as number four in the total birth order. The study utilized the WHO definition of fetal death, irrespective of length of gestation.
Many studies use birth order in a more limited sense, as the number of live births (or of live births and fetal deaths of 28 weeks or more of gestation). However, whether these pregnan- cies terminated in live births or fetal deaths, maternal health is known to depend on the number of pregnancies involved and also on the frequency of these pregnancies. The chance that a low-weight baby will be delivered is also influenced by the time intervals between preg- nancies, as well as by the age of the mother. Furthermore, the mother’s history of fetal deaths (both early and late) and of low-weight births has an important bearing on evaluation of reproductive risk. Thus it would seem advisable for studies on the outcome of preg- nancies to use total birth order.
The high frequency of low and deficient birth-weights found in many areas indicates serious problems. These findings need to be supported by additional data and further studies in many parts of the world. The problems involved first need to be defined and then strategies of prevention must be devel- oped. Nevertheless, the available data already
Serrano and Puffer . INDICATORS OF HEALTH PROBLEMS IN INFANCY 335
suffice to indicate that excessive percentages of the babies born to young mothers have low or deficient weights at birth.
Mortality in the First Day of Life Registration
The Investigation used a rate of 10 deaths in the first day of life per 1,000 live births as a standard to indicate whether sufficient deaths in early life had been included. In several areas preliminary tabulations revealed that many such deaths were not included. For example, data in one project showed a rate of only three deaths in the first day of life per 1,000 live births. In this project many of the deaths which had occurred in a large hospital were found to lack death certificates. Procedures were then changed and the rate obtained for that project exceeded 10 deaths per 1,000 live births for the two-year period.
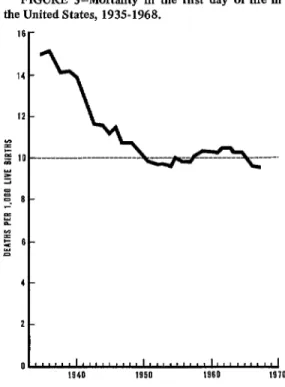
Shapiro, Schlesinger, and Nesbitt (20) showed that the death rate during the first day of life in the United States declined from 15.0 per 1,000 live births in 1935 to 10.2 in 1950 and remained around 10 per 1,000 from 1950 to 1964. Actually, the latest figure available for the United States is 9.5 in 1968 (Figure 3).
In all Latin American projects of the Investi- gation, principal collaborators and their staffs made careful searches for unregistered deaths. Hospital delivery books were used as a source; clinical histories of babies with low Apgar scores and low birth-weights were reviewed to find out whether death had occurred, and if it had a search was made for a death certificate. If no death certificate was found, the death was added to those already known by death certif- icates in the Investigation.
Often only one of a pair of dead twins was registered, as only one casket was used for burial; and in several instances the definitions of WHO were being ignored. For example, one clinical history had the admission diagnosis “threatened abortion.” But the next page of the history showed that a baby had been delivered in the hospital and had lived for two
FIGURE 3-Mortality in the first day of lie in the United States, 1935-1968.
16
r
z -. O-
% YI = 6- z
4-
2-
ol,,,,,,I,,,,,.,,,1.,,.,,,.,1,,,,,,.,,(
1940 1959 1960 19JO
hours. Therefore the birth should have been recorded on a birth certificate and the death on a death certificate, and the latter event should have been included among the neonatal deaths listed in the hospital’s statistics. This type of misclassification illustrates the need to establish hospital procedures for routinely recording the outcome of all pregnancies, as well as the need for hospital staff members to bear responsi- bility for registering births and deaths. In this particular case the very small product was disposed of, and the parents were probably told it was a stillbirth to save them the cost of burial.
336 PAHO BULLETIN . Vol. VIII, No. 4, 1974
hospitals were not registered. The hospital disposed of the bodies and the families avoided the expenses of burial. Evidently the hospitals do not have specific responsibility for birth and death certificates, so for many deaths the certificates are not completed and filed with the Civil Registry. These findings further demonstrate the necessity of establishing re- sponsibility for certification of these vital events in the hospitals and for providing regis- tration offices in them. According to Legarreta, et aZ., although 536 of the 1,003 unregistered deaths of infants with known birth weights (53.4 per cent) occurred within 24 hours of birth, 105 (10.5 per cent) of the dead infants were known to have lived for at least a week. Thus the problem was not limited to those products which might have been reported as stillbirths.
In all 13 Latin American projects and in the Canadian project, unregistered deaths were found and included in the Investigation. In fact, of the 4,216 known deaths that occurred during the first day of life in the 14 projects, 977 (23.2 per cent) were not registered. Most of these deaths (3,709) took place in hospitals, the remainder (507) occurring at home. Of the hospital deaths, 897 (24.2 per cent) were not registered.
Although registration of deaths which occur at home is a problem, the increasing use of hospitals for deliveries and the high proportion of deaths in the first day or days of life which occur in hospitals make it important to estab- lish correct procedures for registering hospital births and deaths. The birth attendant is logical- ly the person who should be responsible for certification of birth. Certificates for both births and fetal deaths in hospitals should be prepared as part of routine hospital procedures, and these certificates should be filed at registra- tion offices without expense to the family. Also, hospitals must accept full responsibility for certifying the deaths of ah babies whose bodies are disposed of, in addition to ensuring that all other deaths occurring in them are certified and reported to the health authorities.
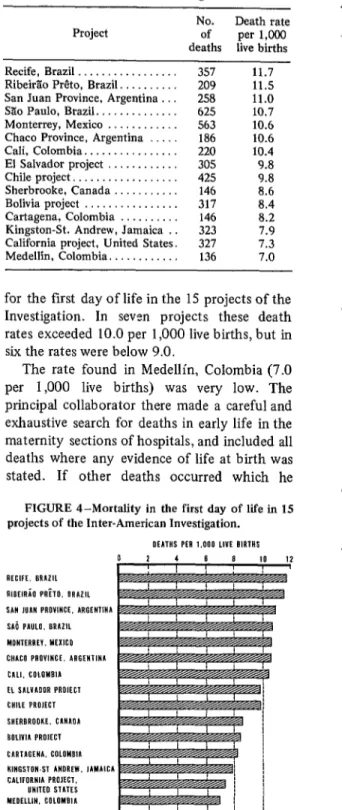
Table 4 and Figure 4 show the death rates
TABLE 4-Mortality in the flmt day of life in 15 projects of the Inter-American Investlgagatlon.
Project No. of Death rate per 1,000 deaths live births Recife, Brazil . . . . . . . . . 357 11.7 RibeirZo P&o, Brazil. . . . . 209 11.5 San Juan Province, Argentina . 258 11.0 SZo Paulo, Brazil.. . . . . 625 10.7 Monterrey, Mexico . . . . . . . 563 10.6 Chaco Province, Argentina . 186 10.6 Cali, Colombia.. . . . . . . 220 10.4 El Salvador project . . . . 305 9.8 Chile project, . . . . . . 425 9.8
Sherbrooke, Canada . . 146 8.6
Bolivia project . . . . . . 317 8.4 Cartagena, Colombia . . . . . 146 8.2 Kingston-St. Andrew, Jamaica . . 323 7.9 California project, United States. 327 7.3 Medellin, Colombia.. . . . 136 7.0
for the first day of life in the 15 projects of the Investigation. In seven projects these death rates exceeded 10.0 per 1,000 live births, but in six the rates were below 9.0.
The rate found in Medellin, Colombia (7.0 per 1,000 live births) was very low. The principal collaborator there made a careful and exhaustive search for deaths in early life in the maternity sections of hospitals, and included all deaths where any evidence of life at birth was stated. If other deaths occurred which he FIGURE 4-Mortality in the first day of life in 15 projects of the Inter-American Investigation.
OIATHS PER 1.000 LlVf BIRTHS
2 4 6 a
AECIFE. BRAZIL RleElnia PAh, BAAlll SAN ,UAN PROVINCE. ARGENTINA SAi PAW. BRAZIL MONTERREV. MEXICO CNACO PROVINCE. ARGENIINA CALI. COLOMBlA fl SALVAUOR PROIECI CHILE PROJECT SHfRBRODKE. CANAOA tIOLlVlA PROIECI CARTAGENA, COLOMBIA
KINGSTUN-ST ANDREW. JAMAICA I
Serrano and Puffer . INDICATORS OF HEALTH PROBLEMS IN INFANCY 337
missed, the birth attendant failed to mention any sign of life.
However, the number of live births in Medellin had to be estimated, as baptisms are used as the basis for birth rates. Thus there are several possible explanations for the low rate observed: the estimated number of live births might have been too large, some neonatal deaths may have been erroneously classed as fetal deaths, the distribution of births by weight and age of the mother might have been unusually favorable (resulting in a low death rate), many deaths in the fist day of life might have been prevented in other ways, or a combination of these circumstances might have been involved. The distribution of live births by birth weight or by age of mother were not available, so it was not possible to determine whether these factors could have played a significant role in the low death rate observed. To clarify this situation a study of the outcome of pregnancy is desirable.
Also, the relevant WHO definitions should be widely disseminated and educational pro- grams should be conducted to ensure that all birth attendants observe and utilize the four vital signs involved in correct classification of products as live births or fetal deaths.
In the California,project, the death rate of 7.3 per 1,000 live births was lower than the rate of 10.2 for the 1960 live-birth cohort in the United States. Fortunately, data from the California project could be analyzed by birth weight and maternal age. Mortality by weight group, shown in Figure 5, was very favorable, with lower rates in all weight groups except the first (1,000 grams or less).
The death rate for the first day of life in the 1968 cohort of 142,017 live births (6) in New York City was 10.2 per 1,000 live births. Not only was this death rate higher than that found in the California project, but the frequency of low-weight births was also higher (10.0 per cent in New York City and 7.6 per cent in the California project). These figures probably reflect real differences in the frequencies and in mortality as well.
New York City has a long history of studies
of maternal, infant, and fetal deaths, and has required reporting of the latter since 1939 (21). Although the reporting of fetal deaths estab- lished by the Sanitary Code (22) was incom- plete at fist (Z’), the fact that they were reported for many years and that studies on many aspects of infant mortality were con- ducted (24, 25) has probably resulted in one of the world’s most accurate and complete series of data. on pregnancy outcome. Registration of births and deaths is a responsibility of the New York City Health Department and certificates are sent to that department. The department’s annual summary report gives the distribution of live births by weight at delivery, and infant mortality by birth weight and age at death. This experience, reflecting 50 years of concern by the medical society and health department regarding prevention of needless maternal and infant deaths, is cited because it provides an example of great potential value for many other parts of the world.
In Kingston-St. Andrew, Jamaica, there was a favorably low infant death rate of 38.8 per 1,000 live births, and the rate of 7.9 deaths in the first day of life (Figure 4) may be only slightly low. In the pilot testing phase of the Investigation, procedures were changed in the large maternity hospital so as to include all ’ products showing signs of life as live births. Before that all products under two pounds (907 grams) were considered nonviable and were recorded as fetal deaths. It is likely that all or nearly all hospital deaths in Metropolitan Kingston were registered; the rate in the first day of life was found to be 8.3. In rural St. Andrew the rate was only 3.4, indicating a deficiency.
Nineteen deaths during the first day of life in Kingston-St. Andrew which did not occur in hospitals were included in the Investigation. Of these, 12 were not registered, thereby revealing a need for improving the registration of deaths in early life which occur at home.
338 PAHO BULLETIN . Vol. VIII, No. 4, 1974
about vital signs. Also, some unregistered deaths are known to have occurred at home. The death rates cited (8.4 and 8.2 per 1,000 live births) probably indicate that some deaths were not included.
Regarding the project in Chile, although searches were conducted at six maternities in Santiago, where 85 per cent of the deliveries occurred, probably a few non-registered deaths occurred in the small maternity sections of other hospitals. The death rate for Santiago, after inclusion of unregistered deaths, was 10.0 per 1,000 live births. The lower rate of 6.5 per 1,000 found in four comunas10 may have been due to omissions in the registration system.
In San Juan, Argentina, observed death rates for the furst day of life were higher in the suburban departments of San Juan Province (13.8 per 1,000 live births) and in the rural departments (10.1 per 1,000) than in the City of San Juan, where the rate was 8.9. This appears consistent with other findings indicat- ing a higher mortality in suburban and rural areas than in cities.
In the El Salvador project (for which the field work was unusually through), a higher death rate was found in the rural municipios (12.6 per 1,000 live births) than in the City of San Salvador, where it was 9.3 per 1,000 live births.
A review of these results showed that use of a standard of around 10 deaths in the fist day of life per 1,000 live births seems justified for Latin American cities, and that higher death rates would be expected in rural areas. This indicator of 10 deaths per 1,000 live births is thus recommended for use in evaluating mortal- ity in hospitals and registration systems. Mortality by Weight Group and Maternal Age
The size of the death rate in the first day of life depends partly on the frequency of low- weight births and partly on the age distribution of mothers of newborn infants. In only two
loThe term comuna, as used in Chile, refers to a political subdivision of a Department, the Department in turn beine a oolitical subdivision of a Province.
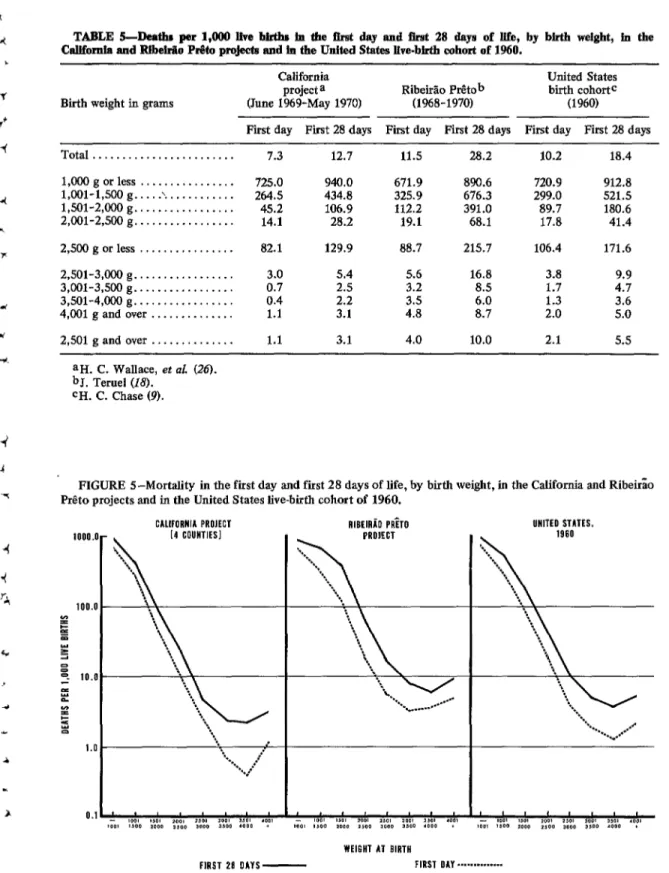
projects could the death rate in the first day of life and the neonatal death rate be given by weight group, namely in the California and RibeirZo Prdto projects. For the California project, the distribution of birth weights found for 47,613 live births in the four counties involved was applied to the number of live births (44,740) in the portions of the counties included in the project. In the Ribeirao P&o project the weight distribution of 15,172 babies with known birth weights was applied to the number of births estimated (18,240). The results must be regarded as approximations. Using these distributions, death rates in the first day and first 28 days of life were calculated (Table 5); these death rates are shown graph- ically in Figure 5, together with similar data for the 1960 cohort of live births in the United
States.
All three sets of data show that very high proportions of babies weighing 1,000 grams or less died in either the first day or the first 28 days of life. However, the fact that around 30 per cent survived the first day indicates the importance of including these very low-weight babies in studies of the outcome of pregnancies. The figures also show that neonatal mortality declined as weight increased and became lowest for those babies weighing 3,501-4,000 grams at birth. In each area the neonatal death rate for infants with deficient birth weights (2,501-3,000 grams) was over twice that for infants with the most favorable birth weights (3,501-4,000 grams).
These death rates have been provided for purposes of comparison with death rates ob- tained by study of the outcome of pregnancies in hospitals. If the hospital rates are lower than expected, definitions and procedures for desig- nating live births, fetal deaths, and deaths in early life should be reviewed to ensure that all are being processed correctly.
Serrano and Puffer - INDICATORS OF HEALTH PROBLEMS IN INFANCY 339
TABLE S-Death per l,OO!I live births fa the &at day and Brst 28 days of life, by birth weight, iu the CaUfomta and Rlbekiio P&I projects and in the United States live-birth cohort of 1960.
Birth weight in grams
California United States
project a Ribeido Ptitob birth cohort=
(June 1%9-May 1970) (1968-1970) (1960)
Fit day First 28 days Fit day First 28 days First day First 28 days Total ...
1,000 g or less ... l,OOl-1,500 g .... .\. ... 1,501-2,000 g ... 2,001-2,500 g ... 2,500 g or less ... 2,501-3,000 g ... 3,001-3,500 g ... 3,501-4,000 g ... 4,001 g and over ... 2,501 g and over ...
7.3 12.7 11.5 28.2 10.2 18.4
725.0 940.0 671.9 890.6 720.9 912.8
264.5 434.8 325.9 676.3 299.0 521.5
45.2 106.9 112.2 391.0 89.7 180.6
14.1 28.2 19.1 68.1 17.8 41.4
82.1 129.9 88.7 215.7 106.4 171.6
3.0 0.7 0.4 1.1 1.1
5.4
2.5 2.2 3.1 3.1
5.6 3.2 ::85 4.0
16.8 8.5 6.0 8.7 10.0
3.8 1.7 1.3 2.0 2.1
9.9 4.7 3.6 5.0 5.5 aH. C. Wallace, et al. (26).
bJ. Teruel (18. CH. C. Chase (9).
FIGURE S-Mortality in the fist day and first 28 days of life, by birth weight, in the California and Ribeirao P&o projects and in the United States live-birth cohort of 1960.
1000
100. P B e z z I 10. % z !Z =:
1.
0. .o-
o-
o-
o-
.1 -
340 PAHO BULLETIN . Vol. VIIZ, No. 4, I974
infants with excessive birth weights are known to experience increased morbidity and mortal- ity stemming from metabolic complications (usually products of diabetic mothers, etc.) and from complications of delivery, the death rates found for the group weighing 4,001 grams or more were relatively low in comparison with those for the group weighing 3,000 grams or less. The number of births in this highest weight group, especially in Latin American areas, was small compared to the number of babies born with low or deficient weights (Table 1).
The prevailing concept that the fetus is a perfect parasite, capable of obtaining the neces- sary nutrients from its mother regardless of her nutritional status, needs to be re-evaluated. From the public health point of view it is safer to assume that under optimal circumstances human organisms have the same potential for achieving optimal intrauterine growth and development, regardless of their geographic location and ethnic characteristics, and in fact the differences observed between so-called “normal” distributions of weights at birth in different areas may indeed be due to differ- ences in the state of health and nutrition of mothers. Thus intervention programs (providing education, food supplementation, etc.) should emphasize the importance of achieving birth weights of at least 3,001 grams and preferably 3,.501-4,000 grams. Mothers should be en- couraged to gain sufficient weight during preg- nancy to have a healthy baby, ideally one weighing 3,5014,000 grams at birth, which will have the greatest chance of surviving the neo- natal period and, according to the New York study, the first year of life.
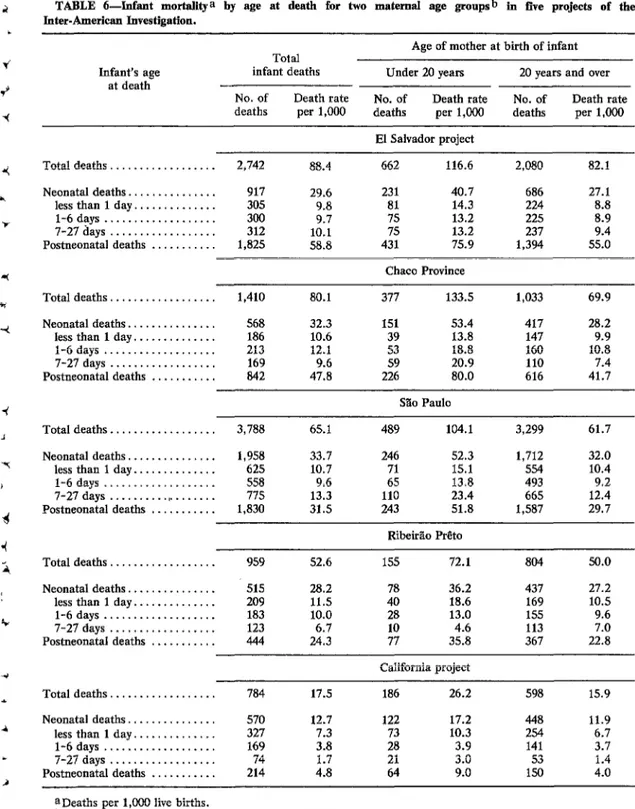
A recent report stemming from the Investi- gation (4) provided an analysis of infant mortal- ity by maternal age group in eight of the projects. These were the eight projects where data on the distribution of live births in terms of the age of the mother were available. The death rates were exceedingly high for infants of young mothers under 20 years of age, and were lowest for infants of mothers 25-29 years of age.
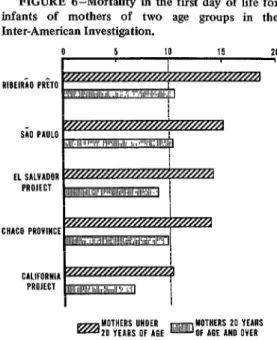
Data from five of these projects” are presented in Table 6 to show the distinct differences, according to age at death, of infants whose mothers were less than 20 years of age at the time of birth, as contrasted with infants whose mothers had been 20 years of age or more. Of the two maternal groups, the younger mothers are known to produce higher proportions of infants with low birth-weights; and thus an excessive frequency of low-weight births are known to result in high death rates during the first day of life for babies born to the younger group. These latter rates varied from 10.3 deaths per 1,000 live births in the California project to 18.6 in Ribeirzo P&o, thus being 39 to 77 per cent higher than the death rates of infants whose mothers had reached 20 years of age (Figure 6).
Referring back to the section on low and deficient birth-weights, the proportion of births to young mothers and the frequency of low- weight births among them affects the size of the death rate in the first day of life, in the remainder of the neonatal period, and in the postneonatal period. These multiple deter- minants deserve study.
Unusually low death rates in the first day of life have been shown for several European countries (1) namely the Netherlands (4.0 deaths per 1,000 live births), Sweden (4.4) Norway (5.6) and Denmark (5.7). A possible explanation of these low rates could be that the proportion of births to mothers under 20 years of age was low, and that a high proportion of
births occurred in women belonging to the most favorable age group (25-29 years).
4
4
I
d 4 i
r,
Serrano and Puffer . INDICATORS OF HEALTH PROBLEMS IN INFANCY 341
TABLE CL-Infant mortality a by age at death for two maternal age groapsb in five projects of the Inter-American Investigation.
Infant’s age at death
Total infant deaths No. of Death rate deaths per 1,000
Age of mother at birth of infant Under 20 years 20 years and over No. of Death rate No. of Death rate deaths per 1,000 deaths per 1,000
El Salvador project
Total deaths . . . 2,742 88.4 662 116.6 2,080 82.1 Neonatal deaths ...
less than 1 day ... l-6 days ... 7-27days.. ... Postneonatal deaths ....
Total deaths. ... Neonatal deaths ...
less than 1 day ... l-6days.. ... 7-27 days ... Postneonatal deaths ...
. . . . 917 29.6 231 40.7 686 27.1
. . . . 305 9.8 81 14.3 224 8.8
. . . . 300 9.7 75 13.2 225 8.9
. . . . 312 10.1 75 13.2 237 9.4
. * . . 1,825 58.8 431 75.9 1,394 55.0
Chaco Province
. . . . 1,410 80.1 377 133.5 1,033 69.9
. . . 568 32.3 151 53.4 417 28.2
. . . 186 10.6 39 13.8 147 9.9
. . . 213 12.1 53 18.8 160 10.8
. . . 169 9.6 59 20.9 110 7.4
. . . 842 47.8 226 80.0 616 41.7
S?io Paul0
Total deaths. . . . _ . . . 3,788 65.1 489 104.1 3,299 61.7 Neonatal deaths ...
less than 1 day ... l-6 days ... 7-27 days ... , .. Postneonatal deaths ...
. . . 1,958 33.7 246 52.3 1,712 32.0
. . . 625 10.7 71 15.1 554 10.4
. . . 558 9.6 65 13.8 493 9.2
. . . 775 13.3 110 23.4 665 12.4
. . . 1,830 31.5 243 51.8 1,587 29.7
Ribeirlo P&o
Total deaths.. . . . 959 52.6 1.55 72.1 804 50.0 Neonatal deaths. ...
less than 1 day ... l-6 days ... 7-27days.. ... Postneonatal deaths ....
. . . . 51.5 28.2 78 36.2 437 27.2
. . . . 209 11.5 40 18.6 169 10.5
. . . . 183 10.0 28 13.0 15.5 9.6
. . . . 123 6.7 10 4.6 113 7.0
. . . . 444 24.3 77 35.8 367 22.8
California project
Total deaths.. . . . 784 17.5 186 26.2 598 15.9 Neonatal deaths ...
less than 1 day ... l-6 days ... 7-27 days ... Postneonatal deaths ....
. . . . 570 12.7 122 17.2 448 11.9
. . . . 327 7.3 73 10.3 254 6.7
. . . . 169 3.8 28 3.9 141 3.7
. . . . 74 1.7 3.0 53 1.4
. . . . 214 4.8 9.0 150 4.0
aDeaths per 1,OOO live births.
342 PAHO BULLETIN . Vol. VIII, No. 4, 1974
FIGURE 6-Mortality in the fist day of life for infants of mothers of two age groups in the Inter-American Investigation.
0 5 IO 15 20
RlBElRiO P&O
sio PQLO
EL SALVAOOR PROIECT
CMCO PROVINCE
CALIFORNIA PROIECT
1,000 live births). In contrast, 17.8 per cent of the births to Puerto Rican mothers were to young mothers, and the infant death rate was high (25.4 per 1,000 live births). Probably the age distribution of mothers accounts for part of the difference in mortality. However, whenever death rates in the first day of life are low they should be studied in terms of the infant’s age at death (in hours or minutes) and birth-weight. Also, proper application of the WHO definition of live birth should be verified by methods such as those used by the previously mentioned investigation of vital signs conducted in New York City (8).
Mortality and Birth Order
Another factor that deserves study is birth order. As pointed out earlier, the 1950 live- birth cohort in the United States (19) showed the frequency of low-weight births among mothers under 20 years of age to increase from 8.6 per cent for first birth order to 18.3 per cent for fifth and higher birth orders. Further- more, analysis of three important determinants of infant mortality (4) has shown neonatal and infant death rates to increase with birth order.
For example, the neonatal death rate for third births of mothers under 20 years in the El Salvador project was found to be 144.3 deaths per 1,000 live births-over four times the rate of 30.1 for first births. Similarly, the infant death rate increased from 89.6 for first births to 334.8 for third births. In the New York City study, which was based on total birth order, the infant death rate for babies of mothers 15-19 years of age likewise increased, going from 24.1 for first births to 49.5 for second, 37.3 for third, and 62.2 for fourth.
The Need for Additional Data
Additional information on death rates in the first day of life according to birth weight, mother’s age, and total birth order, utilizing data on the outcome of hospital deliveries would be valuable. However, in order to provide an adequate analysis of all these deter- minants, large data bases are needed. It is also desirable that data used for such an analysis be founded on the concept of total birth order used in the New York City study. Since data on deliveries occurring in the home should ideally be included, planning for recording of these vital facts on birth certificates is advisable.
For evaluating multiple factors such as birth weight, total birth order, and age of mother, it is highly desirable to utilize the first year of life of a large cohort of live births, such as that used in the New York City study. This permits the same definitions to be used for numerator and denominator. If tabulations for a given period are taken from birth certificates, the data base may prove to be unsatisfactory unless the same definitions have been adhered to and careful checking of deaths has been done. For example, in one area of the Investigation there were more neonatal deaths of low-weight babies than there were births in this same weight group.
Serrano and Puffer . INDICATORS OF HEALTH PROBLEMS IN INFANCY 343
ensure that proper registration of deaths has occurred.
Cuba added the item birth weight to its birth certificate in 1971 and plans to analyze the frequencies of births in 1971, 1972, and 1973 by birth weight in late 1974. It will thus be the first Latin American country to provide this important information on birth weights.
To ensure that all hospital births in Cuba are registered, Resolution No. 169 of 1967 of the Ministry of Justice (28) requires that “when the delivery takes place in a medical care institution of the Ministry of Public .Health, the registra- tion of the newborn will be performed in that same institution, always before the discharge of the infant and not more than 20 days after delivery.” This requirement that the birth certificate be completed before the infant is discharged is very important, as is the designa- tion of the hospital, rather than the family, as the agency responsible for ensuring that this requirement is fulfilled. Cuba has also incor- porated procedures for completion of birth and death certificates into manuals for hospitals and clinics (29, 30). Registration of deaths in Cuba is a responsibility of the Ministry of Health.
Registration of births and deaths in the United States is a responsibility of the State Department of Health in all states but one. The birth attendant signs the birth certificate, and the Hospital Handbook on Birth and Fetal Death Registration (31) sets forth the proce- dures to be followed routinely. As explained in the handbook’s introduction, the quality of birth registration depends almost entirely on health personnel.
Another manual (32), introduced in Argen- tina’s San Juan Province during the Investiga- tion, also describes procedures for registering hospital births and deaths.
City, provincial, and national health author- ities of Latin America should make plans so that their official registration systems will provide the data needed for study of low and deficient birth weights and mortality. While such plans are being developed, the initiation of studies on the outcome of hospital deliveries would alert birth attendants to the need for
providing the essential facts and would empha- size the need to establish measures for eval- uating hospital experiences. Manuals developed in the hospitals for such studies might eventual- ly be used in the official registration systems. Development of Hospital Data on Outcome of Pregnancy
Hospitals are an excellent source of data on outcome of pregnancy, the frequency of low and deficient weights at birth, and mortality in the first day of life. With the introduction of forms for recording the vital facts provided by the mother, the attendant in the delivery room, and the pediatric service, analyses may be prepared in which the three important deter- minants of birth weight, birth order, and age of mother are considered. Other factors may also be utilized in such analyses. In some cases, data from prenatal visits can be combined with those provided by delivery and pediatric services. For example, the weight gain in pregnancy might be recorded and analyzed in relation to the weight at birth of the infant.
A form included in the Appendix is designed to provide the minimum data needed regarding the mother, the outcome of delivery, and the condition of the infant on discharge from the hospital. If death occurred, the date and hour, age at death, and underlying and associated causes of death would be stated.
The items on forms of this kind have to be stated so that they will be understood by both the informant and the hospital attendants. For example, when this form was tried out in hospitals in one city the item number of previous products was not understood and was
344 PAHO BULLETIN . Vol. VIII. No. 4, 1974
the value of their work in recording this information.
The mechanics for completing the form might involve obtaining certain information regarding the mother upon her admission to the hospital. This would include her residence, age, education, previous birth products, and weeks or months of gestation. Facts obtained in the delivery room would be added next, including date and hour of delivery, complications, con- dition of the product at birth, and whether the product should be considered a live birth or fetal death on the basis of observation of the four vital signs (respiratory effort, heartbeat, pulsation of the umbilical cord, and movement of voluntary muscles). Congenital anomalies noted during the first examination of the body should be recorded. If death occurred in the delivery room the exact time (including the hour) and the baby’s age at death, in hours- and in minutes (if less than one hour)-should also be noted. If the newborn was transferred to the intensive care unit or pediatric ward (or nursery) and death occurred in one of those services, these facts should be added at that time. A record of the infant’s condition upon discharge from the pediatric service should also be provided.
In providing underlying and associated causes of death, maternal conditions such as toxemia should be stated, as well as abnormal conditions of the newborn such as immaturity. In this particular case the maternal condition (toxemia) would be the underlying cause, and immaturity would be an associated cause.
This form provides only minimum data. The World Health Organizatin (33) is working with health services of several countries on utiliza- tion of a form for registration of pregnancies and their outcome. The purpose of this project is to study the methodology needed for collect- ing the proposed data and the feasibility of its collection. The form includes additional items, such as the date when the last menstrual period began and the mode of delivery.
In general, the amount of data to be collected should depend first on the quality of the information that can be obtained from the participants (the mother and the obstetric and pediatric services), second on the possibilities for tabulating and analyzing these data, and third on the extent to which the findings obtained can be put to practical use. Some of the information should be used as the source of facts on birth and death certificates, and this should be considered vital information essential for the registration system.
In order to stimulate studies on the outcome of pregnancies that include consideration of birth weights and mortality in the first day of life, exercises12 have been developed for use in educational programs in the fields of preventive medicine, nursing, midwifery, and medical records. This paper, which defines relevant indicators and provides illustrative examples, could be used for teaching and reference purposes in such programs.
12Three exercises-on immaturity, nutritional
deficiency, and pregnancy outcome-may be obtained
in English and Spanish from the Pan American Health
Organization.
SUMMARY 1) Three indicators of health problems in infancy are proposed; namely, the frequency of low-weight births (2,500 grams or less), the frequency of births of deficient weight (2,501-3,000 grams), and mortality in the first day of life. Data for obtaining these indicators can be found routinely in hospitals, utilizing the clinical records of the obstetric and pediat- ric services.
2) To serve as a basis for comparison with the results of hospital studies, the distributions
of birth weights obtained from two projects of the Inter-American Investigation of Mortality in Childhood and from two hospitals are provided as examples.