Original Article
Artigo Original
Teacher’s voice: vocal tract discomfort
symptoms, vocal intensity and noise in the
classroom
Voz do professor: sintomas de desconforto do
trato vocal, intensidade vocal e ruído
em sala de aula
Amanda Louize Félix Mendes1
Brunna Thaís Luckwu de Lucena2
Aline Menezes Guedes Dias De Araújo3
Luciana Pimentel Fernandes de Melo2
Leonardo Wanderley Lopes2
Maria Fabiana Bonfim de Lima Silva2
Keywords
Speech, Language and Hearing Sciences Voice Noise Faculty Occupational Health Working Conditions
Descritores
Fonoaudiologia Voz Ruído Docentes Saúde do Trabalhador Condições de Trabalho
Correspondence address: Amanda Louize Félix Mendes Rua Ministro Nelson Hungria, 253, Aracaju (SE), Brazil, CEP: 49045-510. E-mail: [email protected]
Received: February 18, 2015
Accepted: June 30, 2015
Study carried out at Departamento de Fonoaudiologia da Universidade Federal da Paraíba – UFPB - João Pessoa (PB), Brazil.
1 Universidade Federal de Sergipe – UFS - Lagarto (SE), Brazil.
2 Departamento de Fonoaudiologia, Universidade Federal da Paraíba – UFPB - João Pessoa (PB), Brazil. 3 Universidade Federal da Paraíba – UFPB - João Pessoa (PB), Brazil.
Financial support: none.
Conlict of interests: nothing to declare.
ABSTRACT
Objective: To identify a possible correlation between teachers vocal intensity and the noise in the classroom, as well as between vocal intensity and the symptoms of vocal tract discomfort before and after classes. Methods: 27 Elementary School I teachers participated in the study. We used the questionnaires “Vocal Production Condition of the Teacher” and “Vocal Tract Discomfort Scale - VTD” which were applied before and after the class. A properly calibrated noise meter was used for measuring noise in the classroom and the teachers’ vocal intensity. Results: There was a moderate positive correlation between vocal intensity and noise and also a signiicant difference between the VTD and the teachers with and without vocal complaint before and after classes. When compared separately on both occasions, there was an increase in the group’s scores for both groups and with and without complaints. We found association of the vocal tract symptoms before and after classes, frequency
of burning, itching, sore throat and sensitive throat were observed. The intensity of symptoms was signiicant for sore throat, itching and feeling of lump in the throat. We observed signiicant values of vocal intensity and
frequency and intensity of symptoms for sensitive throat and lump in the throat before the class, and sore throat and lump in the throat after the. Conclusion: The increase in teacher’s vocal intensity correlates to high noise levels in the classroom. The evidence suggests correlation between vocal intensity and discomfort of the vocal tract, with most of the symptoms reported in greater frequency and intensity after the class.
RESUMO
Objetivo: Identiicar se existe correlação entre a intensidade vocal das professoras e o ruído em sala de aula, assim como entre a intensidade vocal e os sintomas de desconforto do trato vocal, antes e após a aula. Métodos: Participaram 27 professoras do Ensino Fundamental I. Foram utilizados os questionários Condição de Produção Vocal do Professor e Escala de Desconforto do Trato Vocal, aplicados antes e após a aula. Para medição do ruído dentro da sala de aula e da intensidade vocal das professoras foi utilizado decibelímetro. Resultados: Houve
correlação positiva moderada entre a intensidade vocal e o ruído. Observou-se diferença signiicativa entre a
EDTV e as professoras com e sem queixa vocal antes e após a aula. Quando comparadas separadamente nos
dois momentos, veriicou-se aumento nos escores tanto para as professoras com queixa vocal quanto para as que
não apresentaram queixa. Ocorreram associações dos sintomas do trato vocal antes e após a aula, da frequência
de queimação, coceira, garganta irritada e garganta sensível. A intensidade dos sintomas foi signiicativa para garganta dolorida, coceira e bola na garganta. Observaram-se valores signiicativos sobre intensidade vocal e
INTRODUCTION
Teaching is one of the professions with the highest incidence of voice disorders, mostly due to the poor working conditions(1) related to the excessive vocal demand and the elevated voice intensity, often as a result of the presence of intensive noise in the classroom(2).
This multifactorial nature of teachers’ work environment can cause various symptoms(3,4), constituting a risk factor for the development of voice disorders, impacting work performance(5-7).
One of the main risk factors for the development of voice disorders is the increase in vocal intensity in the classroom(8). In general, the intensity of the teacher’s voice rises from 10 to 30 dB(A) above the intensity of ambient noises(9,10).
Thus, the noise assessment objectively performed with the sound level meter at different times and school sites(11) as well as the self-assessment of symptoms reported by teachers(12) contribute to understanding the noise–voice relationship and the environmental and organizational aspects.
In general, the symptoms reported by the patient with vocal complaints, whether they are teachers or not, can be sensory, when they involve unpleasant sensations in the body, speciically in the area of shoulders and neck at the time of vocal emission, or auditory, when the patient perceives auditorily that their voice quality has changed(4,13,14). Moreover, these symptoms may continuously vary in terms of both frequency and intensity, affecting, in some cases, the individual’s well-being(4,13).
In this context, the Vocal Tract Discomfort Scale (VTD) was developed as a measurement tool for the intensity and frequency of symptoms of discomfort of the vocal tract, illed by the individual, through the use of qualitative descriptors(13).
The understanding of issues related to the symptoms of discomfort of the vocal tract is essential in the evaluation of individuals exposed to risk factors for the development of voice disorders, because often these symptoms may indicate the onset of a voice disorder(15).
In this study, we start from the hypothesis that the symptoms of discomfort can be exacerbated by poor working conditions, with constant exposure to noise, which can lead to increase in intensity of the teacher’s voice and, consequently, burden the vocal tract(16-18), predisposing to the development of voice disorders.
In this context, this study aimed at identifying whether there is a correlation between teachers’ vocal intensity and the noise in the classroom, as well as correlation between vocal intensity and symptoms of vocal tract discomfort referred to by teachers before and after classes.
METHODS
This is a descriptive, transversal, quantitative study. The Human Research Ethics Committee of the home institution, under protocol no. 091/13, approved it and the participating teachers signed an informed consent.
The study was conducted in four public schools that participated in an extension project of a federal educational institution, whose purpose was to deploy a Vocal Health Consultancy Program (ASSEVOX) for elementary school teachers.
Inclusion criteria were being female and participating in all the steps proposed in this study. The gender criterion aimed at avoiding the inluence of male and female anatomical and physiological variables on the search results. The teachers who presented auditory complaints were excluded from the study, as well as the teachers of physical education, as their work is conducted in a different environment from that of the conventional classroom, such as sports ields, not itting in the design of this research.
Thus, the sample consisted of 27 teachers, with an average age of 43 years (SD = 9.42), with an average time of experience of 19 years and average workload of 20 hours per week in the classroom. This sample was composed in a non-probabilistic approach, and by convenience.
In order to avoid the vocal fatigue acquired by teachers along a working week, data collection occurred only on Mondays. In addition to this reason, we chose this day in order to eliminate other variables that could inluence the outcome of the research, such as physical education class, which could generate higher noise levels when they occur.
The survey consisted in the application of two self-perception questionnaires. The irst was the Teachers’ Vocal Production Condition–CPV-P(7), in which the participants responded to questions related to personal identiication, functional status, physical characteristics of the workplace, and vocal aspects. The other questionnaire completed by the participants was the Vocal Tract Discomfort Scale–VTD. This scale was applied in two stages: before the beginning of a class and after its completion, that is, after 4 hours of class. This procedure was adopted in order to verify the frequency and intensity of symptoms of vocal tract discomfort before and after classes. In addition, the noise level in the classroom and teachers’ vocal intensity at the time of the class were measured.
Teachers’ Vocal Production Condition – CPV-P
The CPV-P(7) consists of 79 questions related to the following aspects: identiication of the respondent, identiication of the school, functional status, school environment, organization of work, vocal aspects, and lifestyle. For this study, the following data on variables were used: date of birth, sex, time of profession, working hours, noisy school, noise site, loud noise, unpleasant noise, history of voice problems, and the causes most often cited for this change. The answers to the questions regarding the workplace environment in the CPV-P questionnaire are presented in a Likert scale of four points (never, rarely, sometimes, always).
Vocal Tract Discomfort Scale – VTD
The answers to the questions are presented in a Likert scale of six points: never, rarely, a few times, sometimes, often, almost always, and always to the frequency of symptoms; and none, almost none, mild, almost moderate, moderate, strong, and extreme to the intensity of symptoms.
Procedures for the collection of noise level in the class
-room and vocal intensity of teachers
The measurement of noise inside the classroom was made with an Akso brand sound pressure level meter, model AK814, 201208154893 series, with calibration certiicate n. 6508/2013. For the measurement, the weighting scale (A) was used, for presenting the closest response to the human ear’s, and a slow response circuitry, due to large luctuation of values and for readability. The equipment was turned to the center of the room at 1 meter from the loor and 1 meter from the walls, in order to avoid standing waves.
The measurement of the noise level held during the class was recorded by the sound level meter on three points: next to the windows (P1), next to the chalkboard (P2), and next to the door (P3) for a period of 5 minutes, as shown in Figure 1. The lowest (minimum measure) and the highest (maximum measure) sound pressure levels were considered in each classroom (Figure 1).
The measurement intended to verify if the noise level was within the limits recommended by NBR 10.152(19) – Noise levels for acoustic comfort, for indoor environments, which provides that for the classroom, the noise must be between 40 and 50 dB(A).
Subsequently, the level of vocal intensity of the teachers at the time of the class was measured for a 5-minute period, and the minimum and maximum sound pressure measures found during this period were considered. To this end, the equipment was placed in front of the teacher and 1 meter away from her and from the ground. The positioning was established aiming at favoring the main sound source, which is the voice of the teacher.
Data analysis
The data found in the two questionnaires and the measurements of minimum and maximum levels of vocal intensity of teachers and the noise in the classroom were tabulated in Microsoft Excel 2010.
For registration into the database, the questions from the CPV-P questionnaire whose responses were I don’t know, never, and rarely were considered as absence, and the responses sometimes and always, as presence.
The VTD scale was tabulated according to the frequency and severity of symptoms on a scale from 0 (never) to 6 (always) before and after classes.
The data related to noise were grouped from the maximum and minimum levels found in each of the three points.
The Cronbach’s alpha coeficient was used to measure the reliability of the CPV-P and VTD questionnaires. Statistical analysis was performed using the Statistical Package for Social Sciences (SPSS), version 20.0, using the Pearson correlation test, to correlate the vocal intensity of the teachers and the average noise level in the classroom. The signiicance level was 5% (p < 0.05).
To relate the data from the VTD scale before and after classes, the chi-square test was used, in which the categories never, almost never, a few times, sometimes, often, almost always, and always were considered for the frequency of symptoms; and none, almost none, mild, almost moderate, moderate, strong, and extreme for the intensity of symptoms. Chi-square test allowed concluding if there are discrepancies between the observed and expected frequencies. The signiicance level was 5% (p < 0.05).
To identify the degree of correlation between the VTD scale variables and the vocal intensity of the teachers, Spearman coeficient was used, which indicates the correlation between the points, ranging from −1 (negative correlation) to +1 (positive correlation), adopting a signiicance level of 5% (p < 0.05).
In this study, to classify the correlation coeficients, values from 0.1 to 0.3 were considered to represent a weak correlation; values between 0.4 and 0.6 indicated moderate correlation; and values above 0.7 represented a strong degree of correlation between the variables.
To compare the scores obtained in the VTD scale by teachers who did or did not report complaints of voice disorders in CPV-P, the Mann–Whitney test was used. The analysis of before and after the VTD of teachers within their respective groups (with or without voice disorder complaint) was performed using the Wilcoxon test for paired samples.
RESULTS
By analyzing the Cronbach’s alpha coeficient, values found were 0.843 for the CPV-P questionnaire and 0.971 for the VTD scale.
With regard to the noise issue in the school environment, from the 27 study participants, 24 (89.9%) reported that the school is noisy, 17 (63%) reported that the noise comes from within the classroom, 23 reported being loud (85.2%), and 21 as unpleasant (77.8%).
Regarding the vocal aspects, 17 (63%) reported that they have had some voice disorder and 8 (29.6%) reported they are currently facing it. By comparing these data with the symptoms of vocal tract discomfort, it was observed that there was signiicant difference between teachers with and without voice disorder complaints prior to (p = 0.033) and after classes (p = 0.038) and higher scores in the group that claimed to have voice disorders. Furthermore, when compared separately the two moments, there was a signiicant increase in scores both in the group with no voice disorder (p < 0.001) and in the group that presented voice disorders (p = 0.040) (Table 1). The causes most frequently cited for this disorder were the intensive use of
voice (20/74.1%), exposure to noise (15/55.6%), and allergy (13/48.1%).
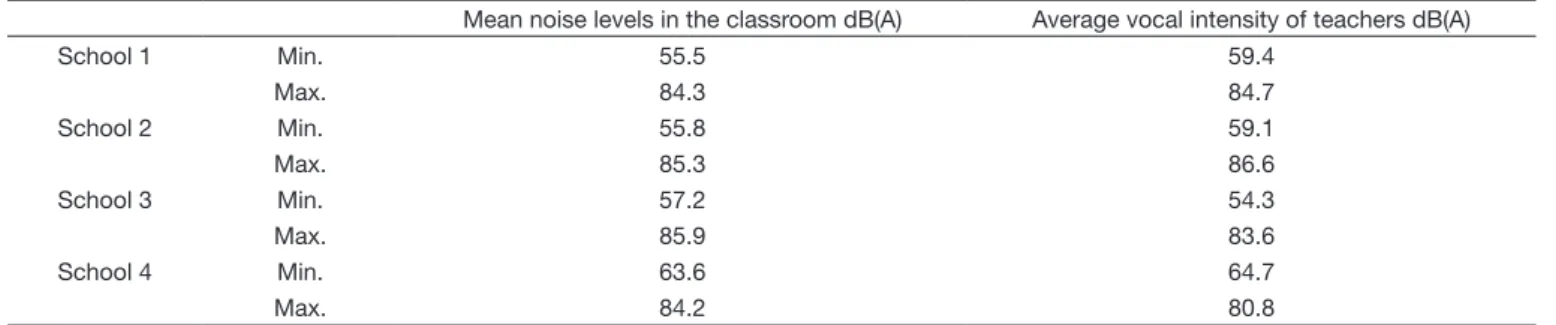
The minimum and maximum noise measures collected within the classrooms of the four schools ranged between 55.5 and 85.9 dB(A), with an overall mean of 70.7 dB(A). The minimum and maximum average values of the teachers’ voice intensity ranged between 54.3 and 86.6 dB(A), with an overall mean of 71.4 dB(A) (Table 2).
The distribution of the mean values of noise in each classroom and of the vocal intensity of each teacher (Figure 2) was performed.
The level of noise and vocal intensity of the teachers showed moderate positive correlation (p = 0.041).
Table 2. Distribution of mean values of noise levels in the classroom and vocal intensity of teachers, per school
Mean noise levels in the classroom dB(A) Average vocal intensity of teachers dB(A)
School 1 Min. 55.5 59.4
Max. 84.3 84.7
School 2 Min. 55.8 59.1
Max. 85.3 86.6
School 3 Min. 57.2 54.3
Max. 85.9 83.6
School 4 Min. 63.6 64.7
Max. 84.2 80.8
Caption: Min. = minimum; Max. = maximum; dB = decibels
Figure 2. Distribution of the values (mean) of noise in the classroom and vocal intensity (mean) of the teachers during class
Table 1. Comparison between groups of teachers on the VTD scores before and after class, according to the presence or absence of voice disorder complaints reported in CPV-P
VTD Absence Presence P-value*
Mean SD Standard error Mean SD Standard error
VTD before 1.21 1.30 0.30 2.33 1.16 0.41 0.033
VTD after 1.94 1.54 0.35 3.07 0.92 0.33 0.038
P-value** <0.001 0.040
* Significant values (p < 0.05) – Mann–Whitney test ** Significant values (p < 0.05) – paired Wilcoxon’s test
With regard to symptoms of vocal tract discomfort, there was an increase in the mean frequency and intensity of the majority of symptoms after class (Table 3).
There was an association of symptoms before and after classes with frequencies of burning in the throat (p = 0.001), itchy throat (p = 0.001), sensitive throat (p = 0.029), and throat irritation (p = 0.001). Regarding the intensity of the symptoms, there was difference between the moments before and after classes for sore throat (p = 0.001), itchy throat (p = 0.001), and lump in the throat (p = 0.001) (Table 3).
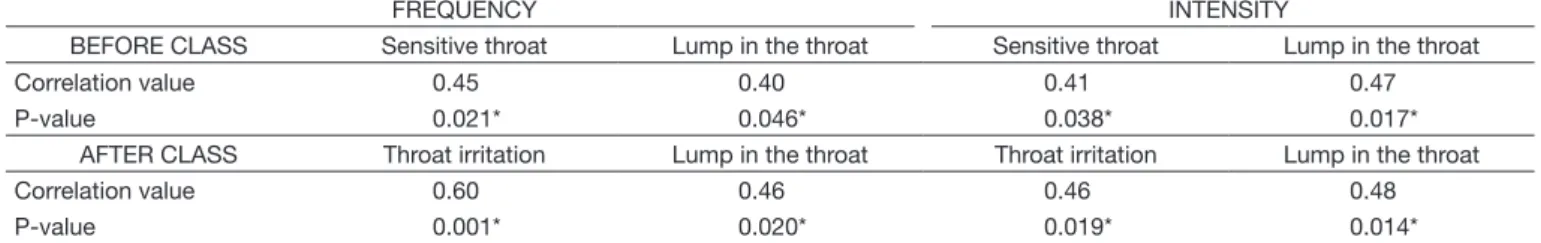
By correlating the frequency and the intensity of symptoms of vocal tract discomfort to the vocal intensity of teachers, there was a moderate positive correlation between vocal intensity and the frequency and intensity of symptoms of sensitive throat and lump in the throat before class and throat irritation and lump in the throat after class (Table 4).
DISCUSSION
This study consisted of the application of two questionnaires (CPV-P and VTD scale) to active teachers in four primary education schools in a public network, as well as the measurement of the vocal intensity of teachers and noise in the classroom.
The results found by Cronbach’s alpha test for the CPV-P self-perception questionnaire showed good reliability, which means a high level of internal consistency. The VTD scale showed excellent level of reliability, higher than that found in a study of the same population and scale(4).
The composition of this study’s sample is similar to other related studies, which presented participants with an average age close to the end of the vocal eficiency period(8,11,20). The average time of profession found was higher than in other studies(2,8,21), and the workload was lower when compared to
Table 3. Mean, standard deviation, and standard error of the scores of symptoms, according to the frequency and intensity observed before and after class
VTD scale before VTD scale after
P-value
Mean SD Standard error Mean SD Standard error
FREQUENCY
Burning 1.11 1.67 0.32 2.11 1.93 0.37 0.001*
Tightness 0.67 1.44 0.28 1.63 1.88 0.36 0.096
Dryness 2.19 1.94 0.37 3.56 1.97 0.38 0.067
Sore throat 1.59 1.76 0.34 2.33 2.00 0.38 0.062
Itchiness 1.41 1.95 0.37 2.07 2.20 0.42 0.001*
Sensitive throat 1.78 2.04 0.39 2.63 2.12 0.41 0.029*
Throat irritation 1.85 1.94 0.37 2.56 1.89 0.36 0.001*
Lump in the throat 1.22 1.55 0.30 1.11 1.37 0.26 0.063
Subtotal 1.48 1.36 0.26 2.25 1.51 0.29
INTENSITY
Burning 1.07 1.47 0.28 1.85 1.70 0.33 0.083
Tightness 0.70 1.07 0.21 1.56 1.70 0.33 0.081
Dryness 2.44 2.06 0.40 3.41 1.82 0.35 0.064
Sore throat 1.63 1.86 0.36 2.41 1.89 0.36 0.001*
Itchiness 1.48 1.95 0.38 1.93 2.04 0.39 0.001*
Sensitive throat 2.07 2.27 0.44 2.82 2.11 0.41 0.074
Throat irritation 2.00 2.02 0.39 2.85 1.92 0.37 0.067
Lump in the throat 1.37 1.78 0.34 1.52 1.91 0.37 0.001*
Subtotal 1.60 1.44 0.28 2.29 1.44 0.28
Total 3.08 2.69 0.52 4.54 2.94 0.56
*Significant values (p < 0.05) – chi-square test
Caption: VTD scale = Voice Tract Discomfort Scale; SD = standard deviation
Table 4. Correlation between vocal intensity and symptoms of vocal tract discomfort, before and after class
FREQUENCY INTENSITY
BEFORE CLASS Sensitive throat Lump in the throat Sensitive throat Lump in the throat
Correlation value 0.45 0.40 0.41 0.47
P-value 0.021* 0.046* 0.038* 0.017*
AFTER CLASS Throat irritation Lump in the throat Throat irritation Lump in the throat
Correlation value 0.60 0.46 0.46 0.48
P-value 0.001* 0.020* 0.019* 0.014*
some studies(2,21,22), which may be related to the fact that most of the primary education teachers in this study only teach classes in one period per day.
As for the noise in the school environment being loud and unpleasant, similar results were shown in other studies(16,18,23). It was also found that the noise originated in the classroom was more noticeable for the teachers than that generated externally, which is in line with studies reporting that the internal noise is more noticeable by teachers than the external, which is perceived randomly(13,24).
The reports of voice disorders by the teachers were equal to the national research and similar to the international research(20). Risk factors most often cited as the cause of this disorder were also reported in another study(25). Authors(26) point out that the main factor for the emergence of a voice disorder is the intensive use of voice related to harmful environmental factors such as exposure to noise. In this sense, it is known that the intensive use of voice can burden the vocal tract of teachers, inluencing the coniguration of the vocal tract and the operation of the vocal folds(8).
We found that before the beginning of class, the teachers who reported voice disorder complaints at the time of the survey already had signiicantly higher scores on the VTD scale than teachers without complaints. After class, the VTD scale scores remained higher in teachers with voice disorder complaints; however, when compared separately the two periods, there was a signiicant increase in the scores of both the group without voice disorders and the one that presented them (Table 1).
From the above, we can infer that poor working conditions, with constant exposure to noise at high levels, as measured in the classrooms, may have generated a high intensity of voice in the teachers involved in this study, thus burdening the vocal tract, with decrease in the length of the vocal tract, predisposing to the development of auditory and sensory vocal symptoms or even indicating voice disorders(8).
One study revealed, among other things, discomfort in the vocal tract of teachers with and without vocal complaints; it was found that the symptoms in teachers with complaints are more frequent and the intensity of discomfort in the vocal tract is greater when compared to teachers without complaints, and throat irritation and dry throat were the more frequent and intense symptoms(4).
The average noise found in this study was 20.7 dB(A), above the ideal limit of acoustic comfort for classrooms, established by NBR 10.152(19), which must not exceed 50 dB(A) (Table 2). It appears that even with the existence of this standard, the noise levels are above the maximum value suggested in the legislation for indoor environments, which can have negative effects for both the teacher and the student(16).
The vocal intensity of the teachers was slightly higher than the noise in the classroom. Studies show that the auditory masking generated by high noise levels leads to increased voice intensity in normal individuals(27), a phenomenon known as the Lombard effect, which is the individual’s natural tendency of increasing vocal intensity, such as when there is exposure to noise, which prevents the subjects from listening to and understanding the message accordingly (Table 2).
By correlating the vocal intensity of teachers and the measurements of noise in the classroom, a moderate positive value was observed, i.e., the higher the noise in the classroom, the more vocal intensity, leading to sound competition and increasing the vocal efforts made during class.
A moderate positive correlation between noise and vocal intensity has been observed in other studies(16,23) that show the noise exposure along with excessive vocal demand and high voice intensity as risk factors that can lead to burden the vocal tract of teachers, inluencing the coniguration of the vocal tract (decrease of supraglottic cavities) and glottal mechanisms, both in terms of greater glottal adduction and of the modiication of vocal folds vibration, with a tendency to elevate fundamental frequency and vocal intensity(8).
With regard to symptoms of vocal tract discomfort, it is observed that, after 4 hours of classes, teachers had a higher frequency and intensity of the majority of symptoms. This may be related to vocal fatigue caused by the exposure to risk factors that are detrimental to the health of the voice, such as the high levels of noise measured in classrooms and the voice intensity of the surveyed teachers.
The teachers’ vocal fatigue consists of an overload of glottal mechanisms with the decrease in the extent of resonator cavities, resulting in auditory and sensory vocal symptoms or even voice disorders(8).
The surveyed teachers presented a higher frequency of burning throat, itchy throat, sensitive throat, and throat irritation after class, as well as greater intensity of symptoms of sore throat, itchy throat, and lump in the throat after class (Table 3).
Often, the irst symptoms reported in a voice disorder are throat irritation, itchy throat, dry throat, and lump in the throat(28,29). In addition, teachers often have hoarseness, dry cough, vocal fatigue, and decrease in their vocal projection capabilities, especially in vocal stress situations(30).
The initial study(14) carried out for the creation of the VTD scale noted that there are qualitative differences between the symptoms of discomfort. The most common symptoms in patients with voice disorders are throat irritation and sore throat. The symptoms of dry throat, itchy throat, throat irritation, sensitive throat, and burning throat relate more to the presence of inlammatory changes and/or changes in the tissue in the larynx and hypopharynx, while the symptoms of tightness in the throat, sore throat, and lump in the throat have a greater relationship with muscle tension in the larynx and hypopharynx region.
Thus, in the population studied in the present study, an increase was observed in the frequency and intensity of the sensation of lump in the throat before and after teaching classes (Table 4). Considering that this symptom has a higher correlation with the presence of muscle tension in the vocal tract(14), it can be inferred that teachers who use greater vocal intensity perform an improper adjustment to increase in intensity, with excessive tension in the vocal tract and laryngeal elevation, and they probably maintain this adjustment even outside of the professional environment(5).
by individuals with tissue injury and/or inlammation of the larynx and/or hypopharynx(14). Thus, teachers who use greater vocal intensity in their work activities can present a major risk for developing lesions in the laryngeal mucosa.
In this research, the increased frequency and intensity of symptoms of vocal tract discomfort in teachers who use greater vocal intensity during classes can underline the role of this variable in the genesis of a voice disorder in that professional category. A positive correlation between the intensity of the symptoms of vocal tract discomfort and vocal changes was also observed(4).
The above discussion highlights the importance of this study to support the planning and development of educational health promotion actions, such as voice health campaigns for teachers and awareness of the need to reduce the noise inside and outside the classrooms.
CONCLUSION
There is a correlation between the vocal intensity of the teachers and the noise in the classroom. The vocal intensity measures also relate to the symptoms of vocal tract discomfort before and after classes. A greater number of symptoms of discomfort was observed after 4 hours of class, and there is a correlation between this increase and the use of greater vocal intensity in the classroom.
REFERENCES
1. Ferracciu CCS, Almeida MS. O distúrbio de voz relacionado ao trabalho do professor e a legislação atual. Rev CEFAC. 2014;16(2):628-33. http:// dx.doi.org/10.1590/1982-0216201425112.
2. Caporossi C, Ferreira LP. Sintomas vocais e fatores relativos ao estilo de vida em professores. Rev CEFAC. 2011;13(1):132-9. http://dx.doi. org/10.1590/S1516-18462010005000099.
3. Azevedo LL, Vianello L, Oliveira HGP, Oliveira IA, Oliveira BFV, Silva CM. Queixas vocais e grau de disfonia em professoras do ensino fundamental. Rev Soc Bras Fonoaudiol. 2009;14(2):192-6. http://dx.doi.org/10.1590/ S1516-80342009000200009.
4. Rodrigues G, Zambon F, Mathieson L, Behlau M. Vocal tract discomfort in teachers: its relationship to self-reported voice disorders. J Voice. 2013;27(4):473-80. http://dx.doi.org/10.1016/j.jvoice.2013.01.005. PMid:23528674.
5. Niebudek-Bogusz E, Woźnicka E, Wiktorowicz J, Śliwińska-Kowalska M. Applicability of the Polish Vocal Tract Discomfort (VTD) scale in the diagnostics of occupational dysphonia. Logoped Phoniatr Vocol. 2012;37(4):151-7. http://dx.doi.org/10.3109/14015439.2012.671358. PMid:22512325.
6. Behlau M, Dragone ML, Nagano L. A voz que ensina: o professor e a comunicação oral em sala de aula. Rio de Janeiro: Revinter; 2004. 7. Ferreira LP, Giannini SP, Latorre MR, Zenari MS. Vocal disorders related to
work: proposing a tool to evaluate teachers. Disturb Comun. 2007;19(1):127-37.
8. Lima-Silva MFB, Ferreira LP, Oliveira IB, Silva MAA, Ghirardi ACAM. Distúrbio de voz em professores: autorreferência, avaliação perceptiva da voz e das pregas vocais. Rev Soc Bras Fonoaudiol. 2012;17(4):391-7. http://dx.doi.org/10.1590/S1516-80342012000400005.
9. Ferreira LP, Giannini SP, Figueira S, Silva EE, Karmann DF. Conditions of vocal production among the teachers of the town hall of São Paulo. Disturb Comun. 2003;14(2):275-308.
10. Crandell CC, Smaldino JJ, Kreisman B. Classroom acoustic measurements. Semin Hear. 2004;25(2):189-200. http://dx.doi.org/10.1055/s-2004-828669. 11. Servilha EAM, Justo FA. Relação entre percepção de ruído em sala de aula autorreferida por professores universitários e suas consequências sobre a voz. Distúrb Comun. 2014;26(4):769-76.
12. Jaroszewski GC, Zeigelboim BS, Lacerda A. Ruído escolar e sua implicação na atividade de ditado. Rev CEFAC. 2007;9(1):122-32. http://dx.doi. org/10.1590/S1516-18462007000100016.
13. Mathieson L, Hirani SP, Epstein R, Baken RJ, Wood G, Rubin JS. Laryngeal Manual therapy: a preliminary study to examine its treatment effects in the management of muscle tension dysphonia. J Voice. 2009;23(3):353-66. http://dx.doi.org/10.1016/j.jvoice.2007.10.002. PMid:18036777. 14. Mathieson L. Vocal tract discomfort in hyperfunctional dysphonia. J Voice.
1993;2:40-8.
15. Tavares EL, Martins RH. Vocal evaluation in teachers with or without symptoms. J Voice. 2007;21(4):407-14. http://dx.doi.org/10.1016/j. jvoice.2006.04.001. PMid:16753282.
16. Gonçalves VS, Silva LB, Coutinho AS. Ruído como agente comprometedor da inteligibilidade de fala dos professores. Produção. 2009;19(3):466-76. 17. Vedovato TG, Monteiro MI. Perfil sociodemográfico e condições de
saúde e trabalho dos professores de nove escolas estaduais paulistas. Rev Esc Enferm USP. 2008;42(2):290-7. http://dx.doi.org/10.1590/S0080-62342008000200012. PMid:18642741.
18. Guidini RF, Bertoncello F, Zanchetta S, Dragone MLS. Correlações entre ruído ambiental em sala de aula e voz do professor. Rev Soc Bras Fonoaudiol. 2012;17(4):398-404. http://dx.doi.org/10.1590/S1516-80342012000400006. 19. ABNT: Associação Brasileira de Normas Técnicas. NBR 10152: níveis de
ruído para conforto acústico. Rio de Janeiro: ABNT; 2000.
20. Roy N, Merrill RM, Thibeault S, Parsa RA, Gray SD, Smith EM. Prevalence of voice disorders in teachers and the general population. J Speech Lang Hear Res. 2004;47(2):281-93. http://dx.doi.org/10.1044/1092-4388(2004/023). PMid:15157130.
21. Ferreira LP, Latorre MR, Giannini SP, Ghirardi AC, Karmann DF, Figueira EE. Influence of abusive vocal habits, hydration, mastication, and sleep in the occurrence of vocal symptoms in teachers. J Voice. 2010;24(1):86-92. http://dx.doi.org/10.1016/j.jvoice.2008.06.001. PMid:19135852. 22. Xavier IALN, Santos ACO, Silva DM. Saúde vocal do professor: intervenção
Fonoaudiológica na atenção primária à saúde. Rev CEFAC. 2013;15(4):976-85. http://dx.doi.org/10.1590/S1516-18462013000400027.
23. Pizolato RA, Mialhe FL, Cortellazzi KL, Ambrosano GMB, Cornacchioni RMIB, Pereira AC. Evaluation of risk factors for voice disorders in teachers and vocal acoustic analysis as an instrument of epidemiological assessment. Rev CEFAC. 2013;15(4):957-66. http://dx.doi.org/10.1590/ S1516-18462013000400025.
24. Shield B, Dockrell JE. External and internal noise surveys of London primary schools. J Acoust Soc Am. 2004;115(2):730-8. http://dx.doi. org/10.1121/1.1635837. PMid:15000185.
25. Servilha EAM, Ruela IS. Riscos ocupacionais à saúde e voz de professores: especificidades das unidades de rede municipal de ensino. Rev CEFAC. 2010;12(1):109-14. http://dx.doi.org/10.1590/S1516-18462009005000061. 26. Fortes FSG, Imamura R, Tsuji DH, Sennes LU. Perfil dos profissionais
da voz com queixas vocais atendidos em um centro terciário de saúde. Rev Bras Otorrinolaringol. 2007;73(1):27-31. http://dx.doi.org/10.1590/ S0034-72992007000100005.
27. Quedas A, Duprat AC, Gasparini G. Implicações do efeito Lombard sobre a intensidade, frequência fundamental e estabilidade da voz de indivíduos com doença de Parkinson. Rev Bras Otorrinolaringol. 2007;73(5):675-83. http://dx.doi.org/10.1590/S0034-72992007000500014.
29. Loś-Spychalska T, Fiszer M, Śliwińska-Kowalska M. The incidence of vocal organ disorders in teachers. Otolaryngologia. 2002;1(I):39-44. [Polish]
30. Woźnicka E, Niebudek-Bogusz E, Kwiecień J, Wiktorowicz J, Śliwińska-Kowalska M. Applicability of the vocal tract discomfort (vtd) scale in evaluating the effects of voice therapy of occupational voice disorders. Med Pr. 2012;63(2):141-52. PMid:22779321.
Author contributions